
Kubernetes metrics show cluster activity. You need them to manage Kubernetes clusters, nodes, and applications. Without them, it also makes it harder to find problems and improve performance.
This post will explain what Kubernetes metrics are, the various kinds you should be aware of, how to gather them, and how to use middleware to monitor Kubernetes with ease.
To understand the context of what problems metrics can reveal, explore our blog on Kubernetes Troubleshooting Techniques.
What are Kubernetes Metrics?
Kubernetes metrics are pieces of information that indicate how well the items operating in your Kubernetes environment are performing. They are vital because it’s hard to find problems or solve them before they harm your apps without them. They show you how the cluster is performing.
For instance, to manage resources effectively, check resource metrics such as CPU and memory usage. These insights help them figure out whether to scale up or scale down.
Types of Kubernetes Metrics
Kubernetes generates different metrics that help you understand performance at different system layers. Here are the common ones:
Cluster Metrics
In Kubernetes, a cluster refers to the complete environment that executes your application. It has the control plane (API server, scheduler, controller manager, etc.), nodes (VMs or physical servers), and pods/workloads (the containers that operate your program).
So cluster metrics are a summary of metrics from the control plane, nodes, and pods/containers. They provide data relating to the health, performance, and resource usage of the whole Kubernetes cluster.
1. Node CPU Resource Usage
This tells you how much CPU capacity the cluster’s nodes are consuming compared to what is available. You can determine the total CPU usage of the cluster by summing the CPU consumption of all the nodes. Each node has a set amount of CPU power. You can tell if nodes are overloaded, balanced, or underused by keeping an eye on this metric.
2. Node Memory Usage
This indicates how much memory (RAM) all the processes on nodes are using, such as kubelet, container runtimes, running pods, and system services. Some important components of memory usage include:
- Working set memory: Memory actively in use by processes that cannot be reclaimed.
- Cache memory: File system cache that can be reclaimed if needed
- RSS (Resident Set Size): Portion of memory occupied in RAM.
Monitoring node memory usage helps prevent clusters from running out of resources, which can result in the termination and removal of a pod from a node or the crashing of apps.
Running out of resources can lead to pod eviction or failure. For more on this, check out our guide on Exit Code 137 in Kubernetes: Causes, Diagnosis, and Fixes.
3. Node Disk Usage
When disk use goes over a certain point, like when there is less than 10–15% free space, the kubelet kicks out a pod to make room.
Node disk usage indicates the amount of space each node in a cluster occupies on the hard drive. There may be no pods left on the node if you run out of disk space.
To make sure that applications with stateful storage don’t run out of space, you need to keep an eye on how much space is being utilized on persistent volumes.
Node Metrics
In Kubernetes clusters, node metrics provide lots of information regarding node health and resource usage.
Instead of guessing at the cluster level, monitoring individual nodes aids in troubleshooting issues on a particular node. For example, Node CPU Usage and Node Memory Consumption show the amount of CPU capacity and RAM a particular node is consuming.
Other node metrics include:
1. Disk I/O and Available Disk Space
These are two related but separate metrics. Disk I/O is the rate of read/write operations on the node’s storage devices (number of operations or bytes per second). Available Disk Space is the remaining free space on the node’s filesystem.
High disk I/O can slow down workloads that perform heavy read/write tasks, causing latency. Also, running out of disk space may trigger pod eviction or node failures.
2. Network Bandwidth Usage
This displays how much data in bytes or packets per second the node’s network interfaces send and receive. It affects how well pods, nodes, and external services communicate. Issues may cause delays in response times or timeouts.
Control Plane Metrics
Control plane metrics indicate the effectiveness of the control plane. Just for clarity, Kubernetes has two main parts:
- Control plane: The brain (decides what should run where)
- Nodes: The worker (actually runs your apps and containers).
The control plane is where Kubernetes holds its decision-making and cluster-running capabilities. It schedules your programs, or pods, and monitors the cluster’s health. It also provides instructions to the worker nodes.
Keeping track of control plane metrics can help you find problems with resources and important services like the API server, scheduler, and controllers. It helps you get ready for difficulties and make sure the cluster is reliable and responds.
1. API Server Request Latencies
This is how long the Kubernetes API server takes to respond to client queries like listing nodes, deploying items, and getting pod information. It shows how long messages and replies take.
Assume that a request to list every pod typically takes 100 milliseconds. The server may be suffering a delay as a result of an overload if there is a delay of up to two seconds.
An excessively long API request indicates a sluggish control plane, which may make the entire cluster less responsive.
2. Scheduler Queue Length
This is where you can view the current count of pods that are waiting to be assigned to a node in the scheduler’s queue. It is the sum of all the unplanned pods that have formed up until now. Early detection of cluster resource shortages or scheduler performance concerns can be achieved by monitoring queue length.
The cluster may be experiencing issues with resource allocation or setup if the scheduler queue length, which is typically small, unexpectedly increases to 50+.
The availability and user experience can be negatively affected by delays in app deployment or workload scalability caused by a large queue length.
Pod Metrics
Pod metrics are the performance data about your running pods. Kubernetes Monitoring helps you catch problems early, know when to scale your apps, and keep everything running smoothly before users notice any issues.
Aside from CPU usage and memory consumption, here are other examples of pod metrics.
1. Pod Restart Count
This displays how many times a pod’s container restarted due to a crash, failure, or resource shortage. If the system restarts often, apps or resources might be the problem.
A high pod restart count is a clear sign that something is wrong. Our guide on how to restart pods in Kubernetes provides several methods to safely address these issues.
2. Pending Pod Count
This shows how many pods are pending. Pending pods are the ones that are still waiting to be scheduled to a node. They wait for the Kubernetes scheduler to locate a node that is good for them.
Pods can be pending for the following reasons:
- Insufficient resources available: No node has sufficient free CPU, memory, or other resources to run the pod.
- Scheduling problems: Some of the rules that could limit where the pod can go are node selectors, taints, tolerations, pod affinity, and anti-affinity. This makes it hard to plan for existing nodes.
- Problems with image: If containers inside the pod are unable to download the necessary images, the pod will not start.
Run “kubectl get pods — field-selector=status.phase=Pending” to get a list of pods to be scheduled.
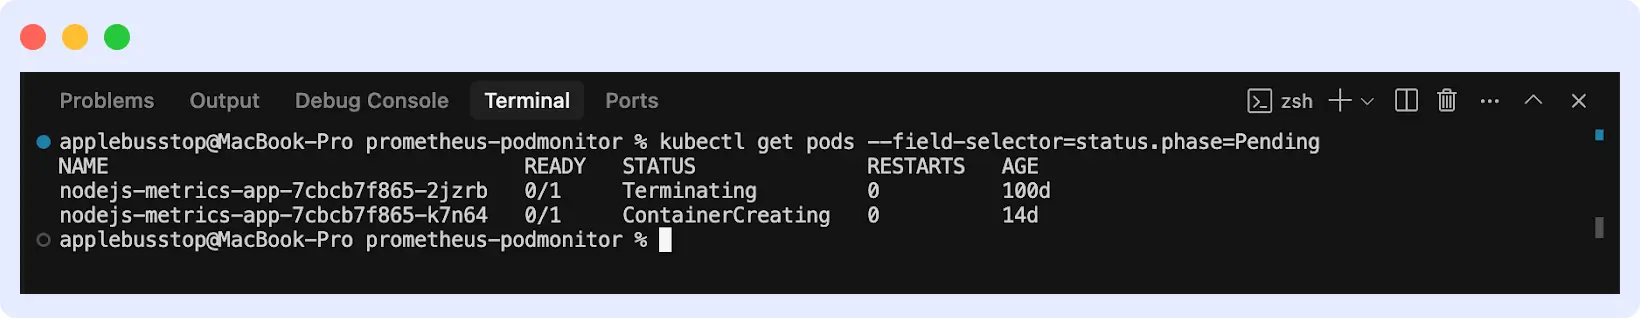
For a deeper dive into debugging pending pods, including how to find and analyze logs, explore our article on Kubectl Logs Tail.
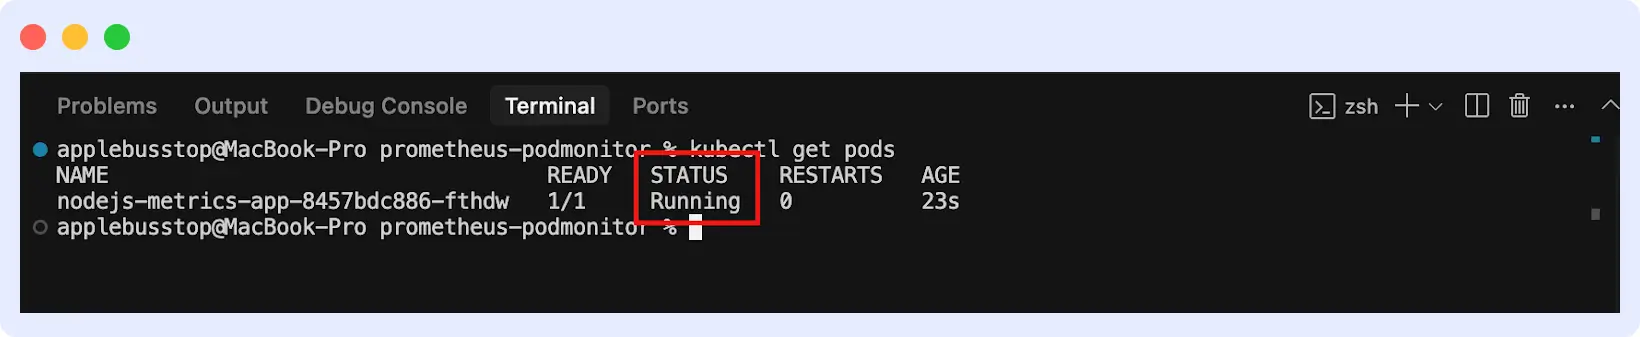
3. Pod Status
Pod status shows the current state or health of a pod and indicates if it’s running smoothly or facing any challenges. Common pod statuses include:
- Pending: The pod has been accepted by Kubernetes, but its node operation has not yet been scheduled.
- Running: Pod is assigned a node, and at least one container is running.
- Succeeded: All containers in the pod completed successfully.
- Failed: One or more containers terminated with an error.
- Unknown: Kubernetes is unable to ascertain the pod’s condition as a result of poor communication.
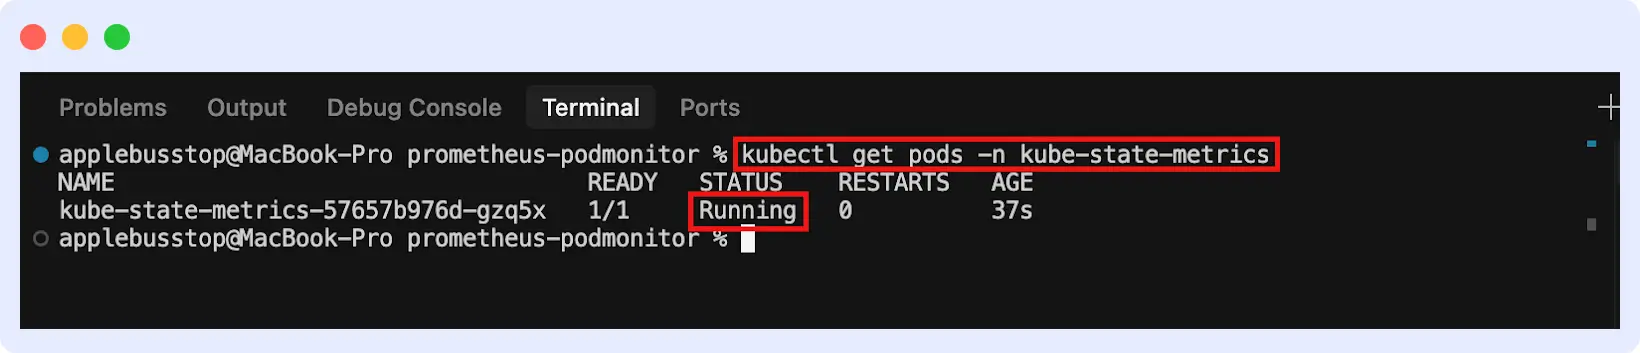
If you run the command
You’ll see the list of pods and their status.
How to Collect Metrics in Kubernetes
You need Kubernetes monitoring tools that collect, process, and occasionally store information for analysis because Kubernetes does not store all metrics by default.
Metrics Server
The Metrics Server is the simplest way to collect CPU and memory metrics in Kubernetes. It is a Kubernetes component that gathers data on node and pod resource utilization. It provides real-time metrics that other programs can utilize, rather than storing them for an extended period.
Metrics Server collects metrics by scraping the kubelet on each node, which exposes resource usage data. These metrics are then combined and made accessible through the Kubernetes API. It gathers data by default every 15 seconds to display resource utilization in real-time.
While Metrics Server provides basic data, a complete observability stack requires more. See how Kubernetes observability goes beyond simple metrics.
Here’s how to set up Metrics Server:
1. Install the Metric Server using the kubectl command
kubectl apply -f https://github.com/kubernetes-sigs/metrics-server/releases/latest/download/components.yaml
This will create the necessary Deployment, ServiceAccount, roles, and bindings.
2. Verify installation by running the command “kubectl get deployment metrics-server -n kube-system”
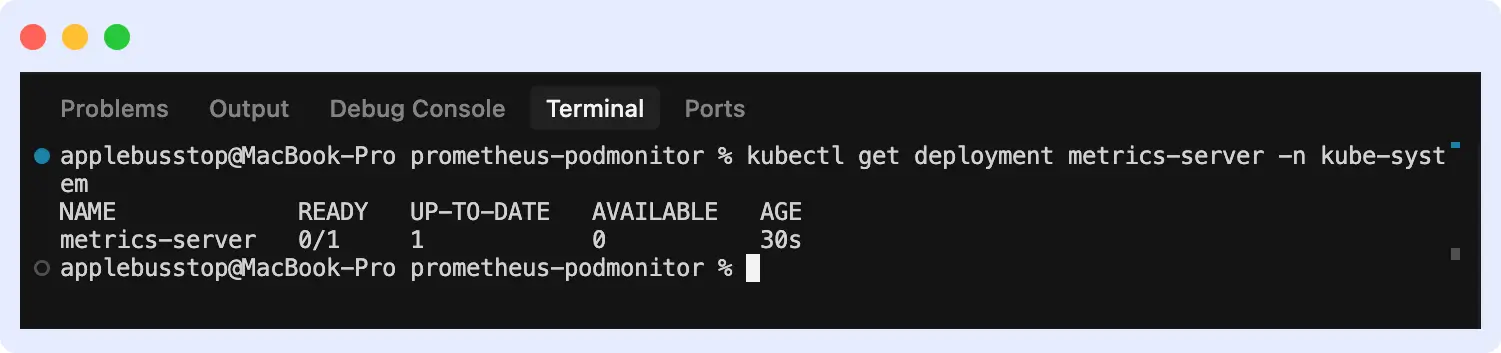
This will ensure it is running with available pods.
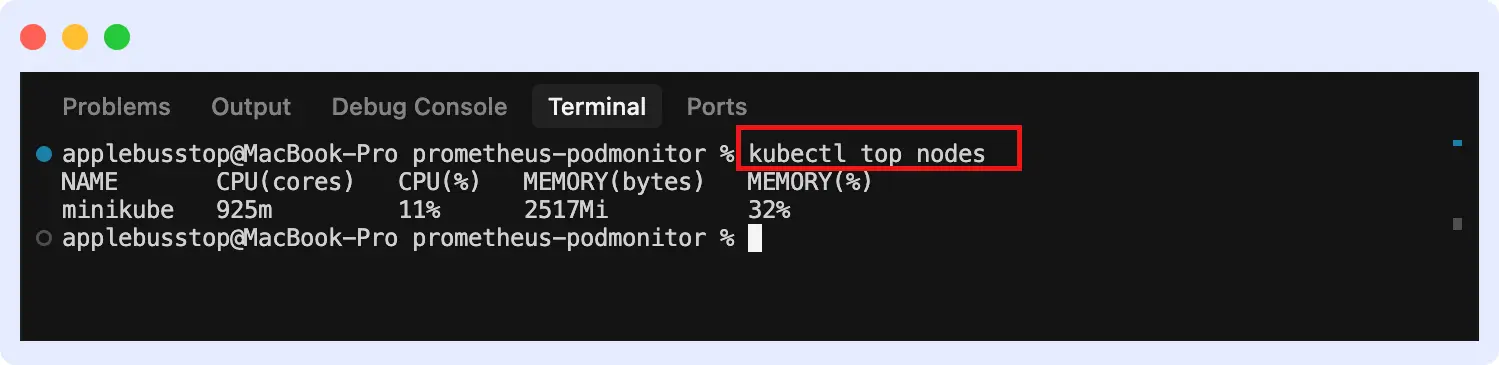
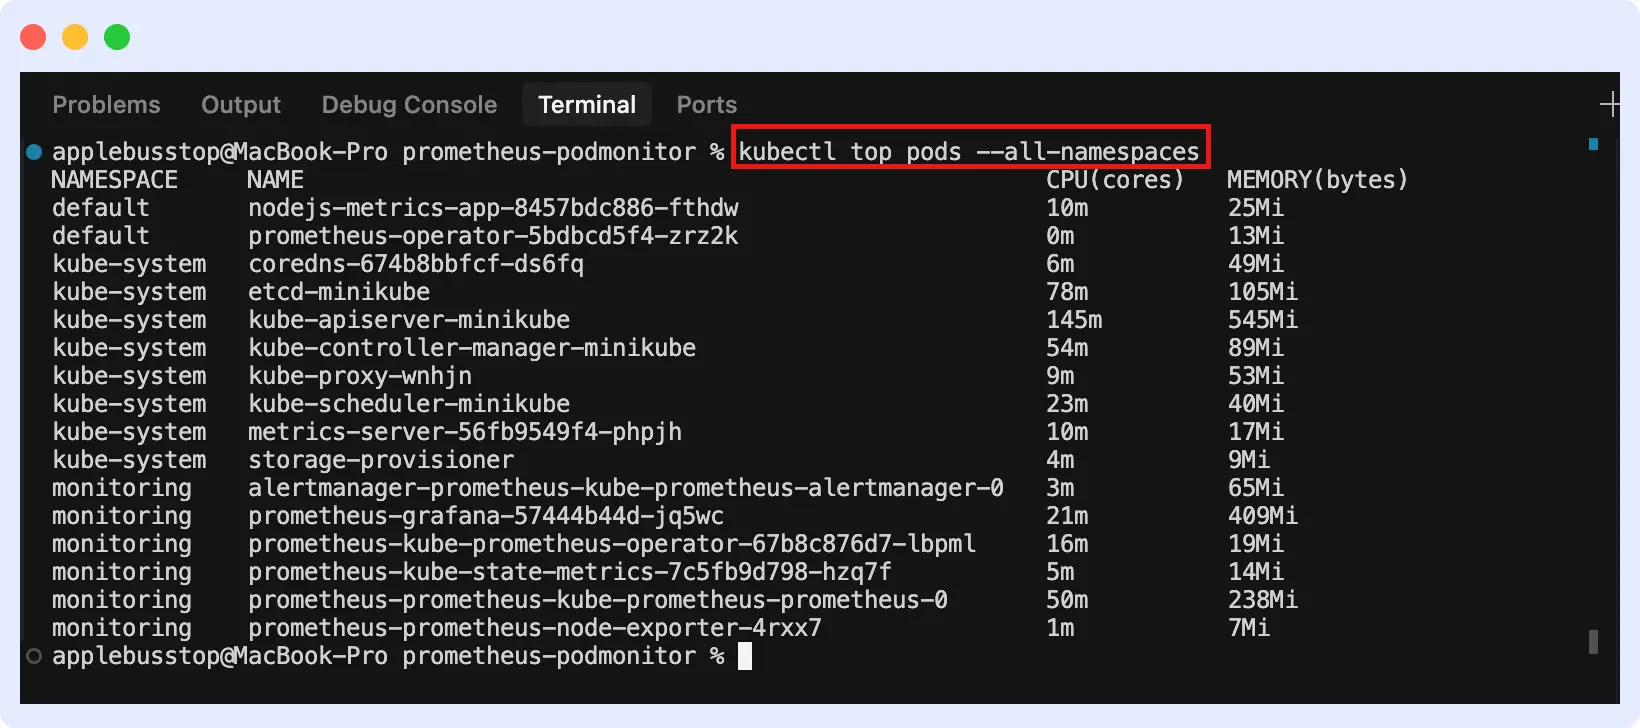
3. Then you can view metrics for both nodes and pods.
For nodes:
For pods (across all namespaces):
cAdvisor
Container Advisor, or cAdvisor, gathers data on resource consumption in real time for pods and containers.
Since cAdvisor is embedded within the kubelet, it automatically collects container-level data on every node. The Kubelet’s endpoint provides metrics that may be used with Prometheus to create dashboards and analyze data.
Kube-State-Metrics
This tool watches over Kubernetes nodes, namespaces, deployments, and pods. It doesn’t keep track of how resources are being used, like Metrics Server and cAdvisor do. Instead, it checks the state, configuration, and health of objects at the cluster level. It lets monitoring programs collect these metrics for display, alerting, and analysis.
Here’s how to install it:
1. Install via Helm
First, add the Prometheus community Help repo:
helm repo add prometheus-community https://prometheus-community.github.io/helm-charts
helm repo update
Install Kube-State-Metrics in your cluster:
This creates the necessary deployments, service accounts, and permissions automatically.
2. Install manually using YAML manifests
Apply the official Kube-State-Metrics manifests provided in the GitHub repo:
kubectl apply -f https://github.com/kubernetes/kube-state-metrics/releases/latest/download/kube-state-metrics-standalone-release.yaml
This will deploy Kube-State-Metrics in your cluster. You can go ahead to confirm if it’s running:
Prometheus
Prometheus is a free monitoring program that gathers and stores time-series data. It gets metrics from cAdvisor, Metrics Server, Kube-State-Metrics, and other places and saves and queries them.
Prometheus constantly gets information from endpoints and stores it in a time-series database. PromQL (Prometheus Query Language) lets you query these metrics, while Alertmanager lets you deliver alerts. You can also use it with other tools, like Middleware, to construct dashboards.
Prometheus is a powerful tool for metrics, but logs are also essential for debugging. Learn how to collect and analyze Kubernetes logs to get a full picture of your application’s health.
Monitoring Kubernetes Metrics with Middleware
Nodes, pods, containers, and the control plane are various components that produce different kinds of metrics. It can be hard to keep track of these numbers. Setting up and maintaining tools like Prometheus and Grafana is complex.
Middleware provides an easy way of monitoring Kubernetes metrics. Once you install the “Middleware Agent” into your Kubernetes environment, you’ll be able to collect and analyze metrics.
The agent’s ability to collect comprehensive data without complexity is similar to how a Kubernetes Operator can automate complex tasks for you.
To do this, follow the instructions on the official documentation or the steps below:
1. Log in to your dashboard and navigate to “Installation.”
You’ll see a list of infrastructures; click on “Kubernetes”, then give your cluster a name with other necessary information.
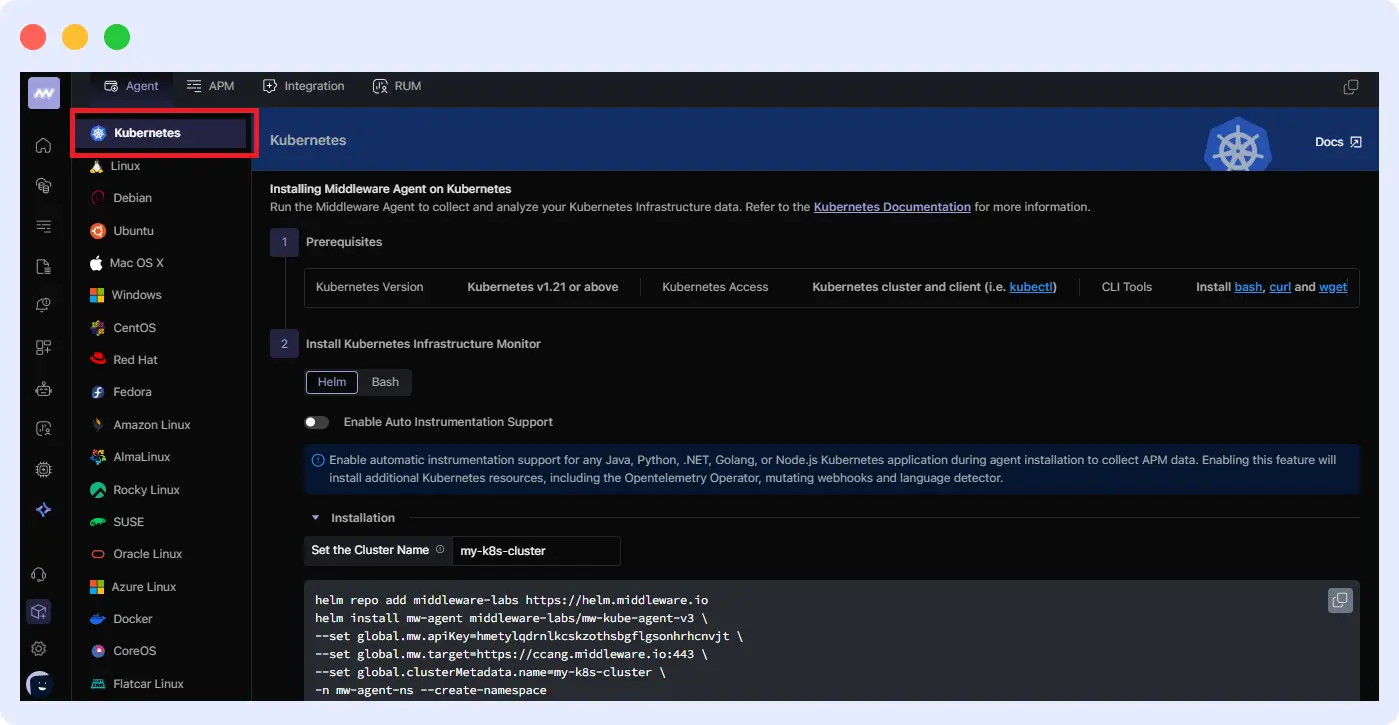
2. Install the Middleware agent with Helm, Bash, or .bat, as specified in the official documentation.
Using Helm:
helm repo add middleware-labs https://helm.middleware.io
helm install mw-agent middleware-labs/mw-kube-agent-v3 --set mw.apiKey=<MW_API_KEY> --set mw.target=https://<MW_UID>.middleware.io:443 --set clusterMetadata.name=<your-cluster-name> -n mw-agent-ns --create-namespace
With Bash:
MW_API_KEY="<MW_API_KEY>" MW_TARGET=https://<MW_UID>.middleware.io:443 bash -c "$(curl -L https://install.middleware.io/scripts/mw-kube-agent-install-v3.sh)"With .bat:
set MW_API_KEY="<MW_API_KEY>"
set MW_TARGET=https://<MW_UID>.middleware.io:443
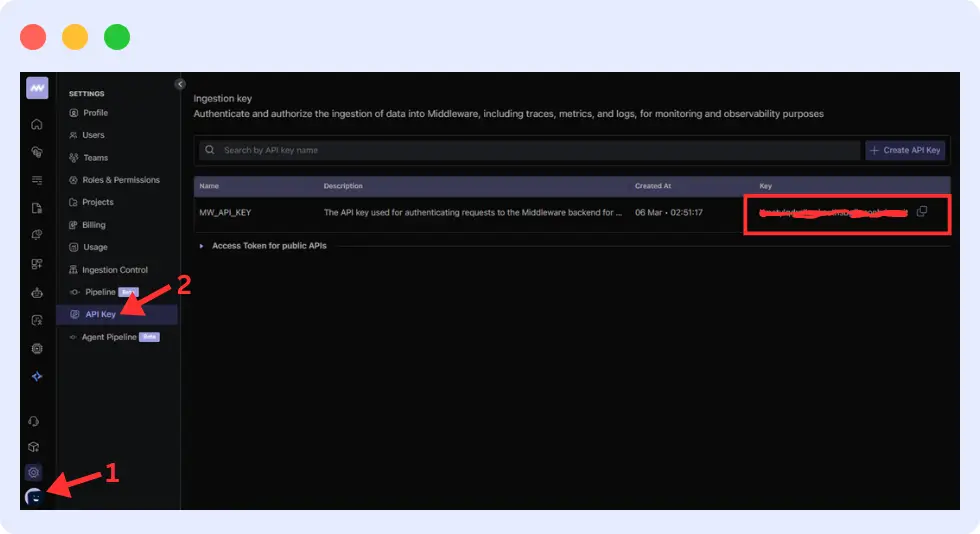
mw-kube-agent-install-windows.batReplace <MW_API_KEY> with your actual Middleware API key. You can get this from your dashboard. When using Helm, you’re required to add a “cluster name.” Use the name you gave your cluster from your dashboard.
3. Verify the installation by checking the status of the Middleware agent. Use the following command:
kubectl get daemonset/mw-kube-agent -n mw-agent-ns
kubectl get deployment/mw-kube-agent -n mw-agent-ns
The middleware dashboard displays pods, nodes, CPU, memory, and more.
You can also set up alerts and notifications to respond quickly and avoid damage.
Conclusion
Metrics help you check pods, nodes, and clusters. They allow you to keep an eye on the health and condition of workloads to find problems early and make sure apps work well.
Middleware is easy to set up, so you can use it to show and keep track of this data. The real-time dashboard, alert system, and simple interface of middleware make it easy to keep an eye on your apps.
FAQs
How do I collect metrics in Kubernetes?
You can use Metrics Server, cAdvisor, Kube-State-Metrics, and Prometheus.
What differentiates Metrics Server from Prometheus?
Metrics Server displays CPU/memory consumption without history. Prometheus collects and saves data for analysis.
What metrics should I track with Kubernetes?
Some important metrics are cluster metrics (node CPU/memory), node metrics (disk, network), pod metrics (CPU, memory, restarts), and control plane metrics (API server latency, scheduler performance).
How can Kubernetes metrics simplify autoscaling?
The HPA dynamically scales pods based on CPU or memory usage. This keeps apps responsive without wasting resources.


