
Ever tried digging through a messy log file to find out what went wrong? Unstructured logs can be a nightmare; hard to read, search, and analyze. With no predictable structure, debugging becomes time-consuming, and log management tools struggle to interpret the data. Proper log formatting is essential in this situation, making logs easier to read, filter, and integrate with analysis tools.
Log formatting organizes log data to enhance readability, consistency, and automation. A well-structured log helps track events, identify errors, and examine system behavior effectively. Using a standard format, such as JSON or XML, improves filtering, searching, and processing while enabling integration with log analysis tools for better automation.
Role of log formatting in various environments:
- Development: Helps in debugging by providing clear and structured error logs.
- Staging: Assists in performance testing and identifying potential issues before deployment.
- Production: Provides real-time monitoring, quicker troubleshooting, and improved system stability.
The Importance of Standardization in Log Formatting
For effective log analysis, system monitoring, and troubleshooting, standardized log formatting is crucial. Logs can become challenging to understand without a consistent structure, which makes it more difficult to find problems and automate log processing.
Developers can increase log readability, guarantee compatibility with log analysis tools, and expedite debugging efforts by adhering to best practices for standardization.
Why standardization matters:
- Improved Consistency: Guarantees that every log entry adheres to a set structure.
- Better Integration: Well-structured logs work well with tools like Elasticsearch, Kibana, and Splunk.
- Faster Debugging: Enables teams to swiftly pinpoint errors and performance hiccups.
Common Log Formats and Their Uses
Choosing the right log format is essential for easy storage, analysis, and troubleshooting. Below are some widely used log formats, their key features, and where they are commonly used.
1. Plaintext Logs
Plaintext logs are simple, human-readable logs that lack a defined structure. While they are easy to create and read, they can be challenging to parse and analyze at scale.
Use Case:
- Suitable for small-scale debugging or manual inspection.
- Used in applications where structured logging is not required.
Example Syntax:
2025-03-17 12:00:05 ERROR Connection failed2. JSON Logs
JSON (JavaScript Object Notation) logs provide a structured, machine-readable format that is widely adopted in modern logging systems. These logs are easy to parse, index, and search.
Use Case:
- Ideal for cloud-based applications and microservices.
- Commonly used in log aggregation platforms like ELK, Middleware, Splunk, and Datadog.
Example Syntax:
{"timestamp": "2025-03-17T12:00:05Z", "level": "ERROR", "message": "Connection failed"}3. XML Logs
XML logs follow a structured format similar to JSON but are more verbose. They are typically used in legacy enterprise systems that require strict formatting.
Use Case:
- Preferred in older enterprise applications that rely on XML-based processing.
- Used where schema validation is a requirement.
Example Syntax:
<log>
<timestamp>2025-03-17T12:00:05Z</timestamp><level>ERROR</level>
<message>Connection failed</message>
</log>
4. Key-Value Pairs
This lightweight format consists of labeled data fields, making it easy to parse and process with command-line tools.
Use Case:
- Used for performance logging and quick debugging.
- Helpful for log monitoring via shell commands like grep or awk.
Example Syntax:
timestamp=2025-03-17T12:00:05Z
level=ERROR
message="Connection failed"
5. Common Event Format (CEF)
CEF is a standardized log format designed for security event logs, ensuring consistency across different security tools.
Use Case:
- Essential for Security Information and Event Management (SIEM) systems.
- Used tools like ArcSight, IBM QRadar, Middleware, and Splunk for security log analysis.
Example Syntax:
CEF:0|SecurityVendor|Product|1.0|100|Connection failed|5|timestamp=2025-03-17T12:00:05Z msg=Connection failedChoosing the Right Log Format
The choice of log format depends on the application’s needs. JSON and key-value pairs are best for structured logging and modern cloud applications, while plaintext logs remain useful for basic debugging. For security logging, CEF provides a standardized approach, while XML is preferred in legacy environments.
By selecting the right log format, organizations can enhance log management efficiency, streamline troubleshooting, and improve overall system monitoring.
Structuring Logs for Enhanced Readability and Analysis
Log files are an essential source of data for performance optimization, debugging, and system monitoring. Unstructured logs, however, can be challenging to interpret, which makes analysis laborious and ineffective.
A standardized format offered by structured logging guarantees compatibility with log analysis tools, improves readability, and makes log parsing easier.
Best Practices for Structuring Logs
1. Use Consistent Field Names and Formats
- Define a standard set of log fields (e.g.,
timestamp,log_level,message,service_name). - Use a structured format like JSON or key-value pairs to maintain uniformity.
- Ensure timestamps follow the
ISO 8601 standard(YYYY-MM-DDTHH:MM:SSZ) for consistency across systems.
Example:
{ "timestamp": "2025-03-15T14:30:00Z", "log_level": "ERROR", "service_name": "user-auth", "message": "Failed login attempt", "user_id": "12345"}2. Using Log Formatter Libraries
- Use built-in logging libraries like log4j (Java), Winston (Node.js), or structlog (Python) to enforce a standardized format.
- They allow logs to be stored in files, databases, or sent to monitoring tools for real-time tracking.
- Tools like Middleware help enforce uniform logging rules across distributed systems, ensuring easy integration with API gateways, authentication services, and microservices.
3. Adopt Industry-Standard Log Formats like CEF
- The Common Event Format (CEF) is widely used for security and centralized logging.
- It is an open-log format designed for security event management. It provides a standardized structure for logging security-related events, making it easier to integrate logs from various sources into SIEM (Security Information and Event Management) tools like Middleware, Splunk, ArcSight, and QRadar.
{ "timestamp": "2025-03-15T14:30:00Z", "log_level": "ERROR", "service_name": "user-auth", "message": "Failed login attempt", "user_id": "12345"}src (source IP), dst (destination IP), and msg (message) provide structured security event details.
4. Ensure Compatibility with Log Management and Analysis Tools
- Logs should be formatted for easy ingestion by tools like Elasticsearch, Logstash, Kibana (ELK Stack), and Fluentd.
- Standardized logs improve searchability, filtering, and visualization in dashboards.
Log Levels and Their Role in Log Formatting
Log levels play a crucial role in organizing log data by categorizing messages based on severity. Properly assigned log levels ensure that critical events stand out while reducing unnecessary log noise, making filtering and analysis more efficient.
Without structured log levels, debugging becomes time-consuming, and storage costs increase due to excessive log data.
When formatting logs, it’s essential to include log levels explicitly (e.g., in JSON or key-value formats) to improve readability and integration with log analysis tools.
Common Log Levels
| Log Level | Purpose | Example |
| DEBUG | Detailed technical messages for troubleshooting. Used mainly in development. | DEBUG – Fetching user data from API. |
| INFO | General operational messages that confirm the system is running as expected. | INFO – User successfully logged in. |
| WARNING | Indicates potential issues that may not require immediate action. | WARNING – Disk space running low (80% full). |
| ERROR | Highlights failures that impact functionality but don’t stop the system. | ERROR – Database connection failed. |
| CRITICAL | Major failures that require immediate attention. | CRITICAL – Server crashed, restarting now. |
Best Practices for Configuring Log Levels
1. Set Appropriate Log Levels for Each Environment
- Development: Enable DEBUG logs to capture detailed execution flow for troubleshooting.
- Staging: Use INFO and WARNING logs to test system behavior without excessive logging.
- Production: Restrict logs to ERROR and CRITICAL to capture system failures while minimizing log noise.
2. Using Dynamic Log Level Configuration
- Implement environment-based log levels where logs can be dynamically adjusted without restarting applications.
- Example: Changing log levels in Python at runtime:
import logging
logging.getLogger().setLevel(logging.WARNING)3. Include Log Level Metadata
- Always store log levels in a structured format (e.g., JSON logs should explicitly include a log_level field for easier querying).
4. Avoid Excessive DEBUG Logging in Production
- Debug logs can cause performance issues. Ensure that excessive debugging is disabled in production environments.
5. Implement Alerts for Critical Logs
- Use monitoring tools like Middleware, Prometheus, or Splunk to trigger alerts on CRITICAL or ERROR log events.
- Middleware helps you aggregate logs from multiple services, correlate errors with application performance, and provide real-time notifications for faster incident resolution.
6. Improve Log Searchability with Structured Log Levels
- Store log levels as structured fields in JSON-formatted logs for better filtering in tools like Elasticsearch, Kibana, Middleware, and Splunk.
- Implement indexing strategies to optimize search performance in large-scale systems.
Example:
const winston = require('winston');
const logger = winston.createLogger({  level: 'info',  format: winston.format.json(),  transports: [    new winston.transports.Console(),    new winston.transports.File({ filename: 'app.log' })  ]});
logger.info("Server started successfully");logger.error("Database connection failed");
Conclusion
Proper log formatting is essential for maintaining operational efficiency, enabling easy debugging, and optimizing system monitoring. By following best practices such as using structured JSON logs, standardizing timestamps, categorizing log levels, and ensuring compatibility with log analysis tools, teams can streamline log management and improve incident response times.
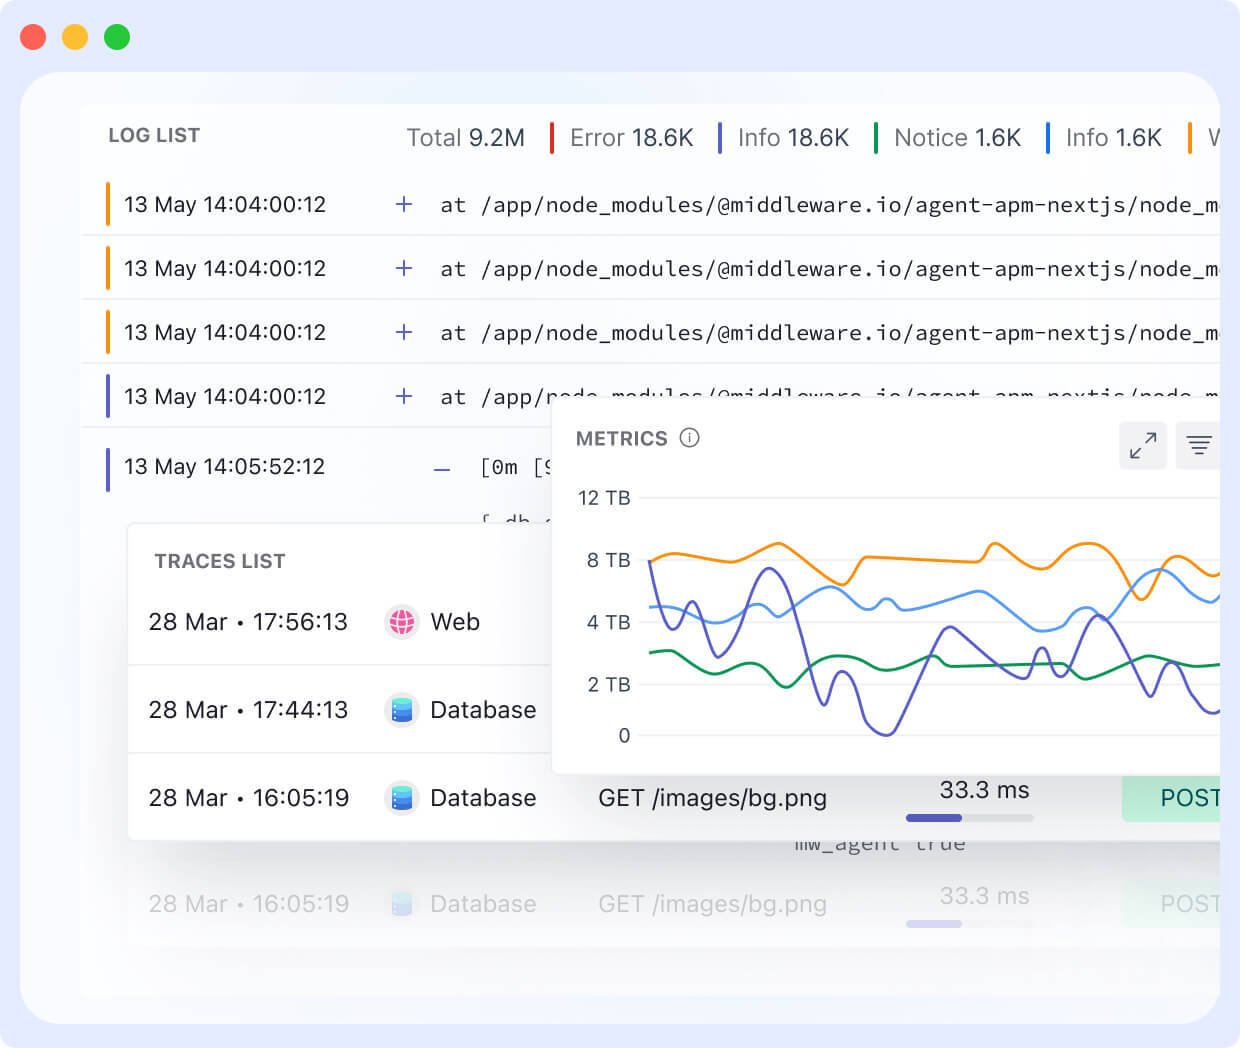
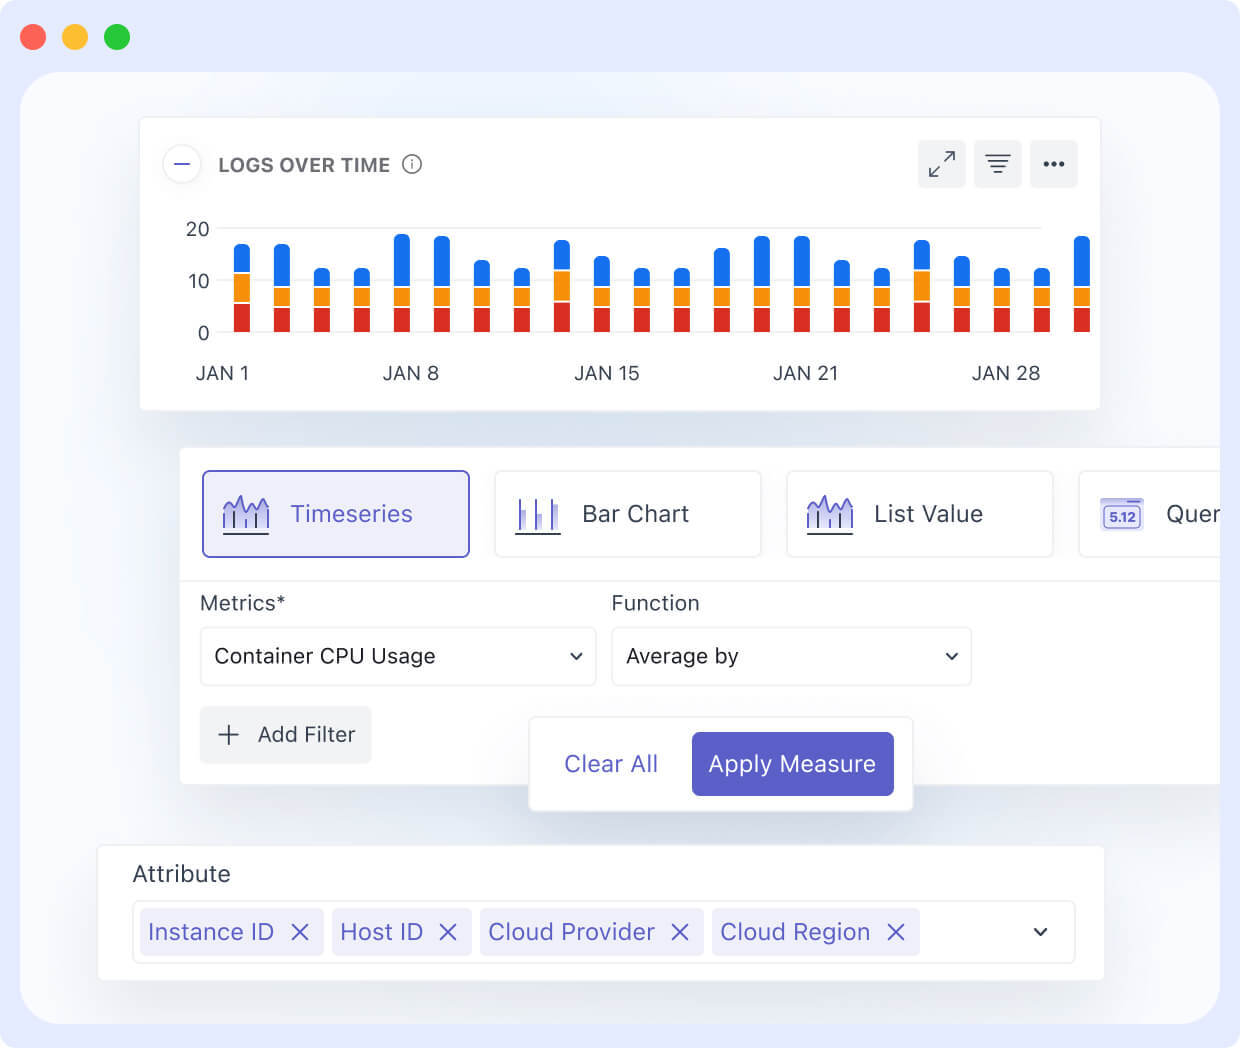
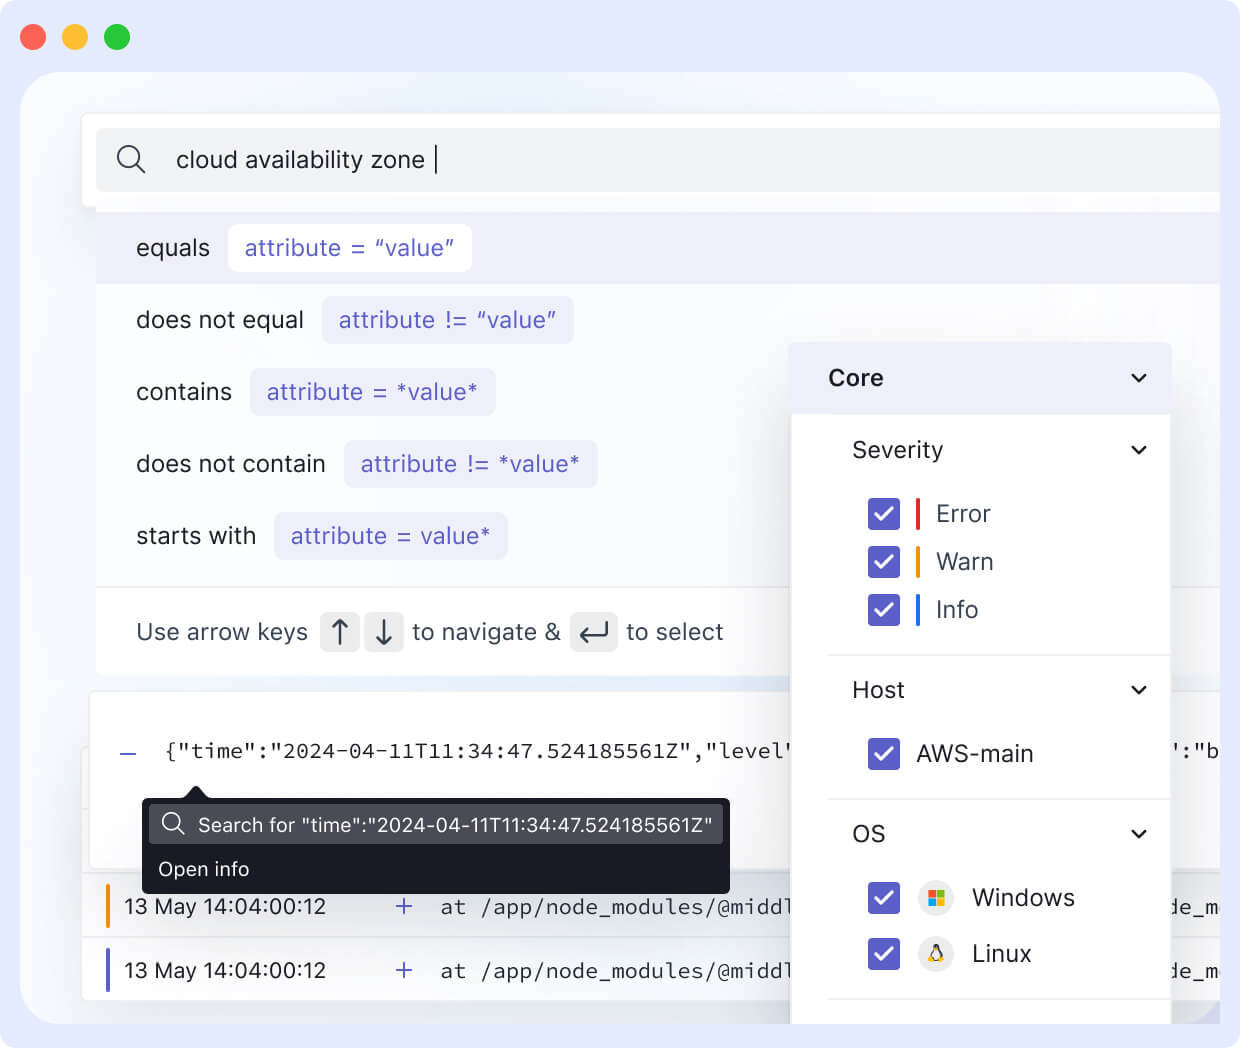
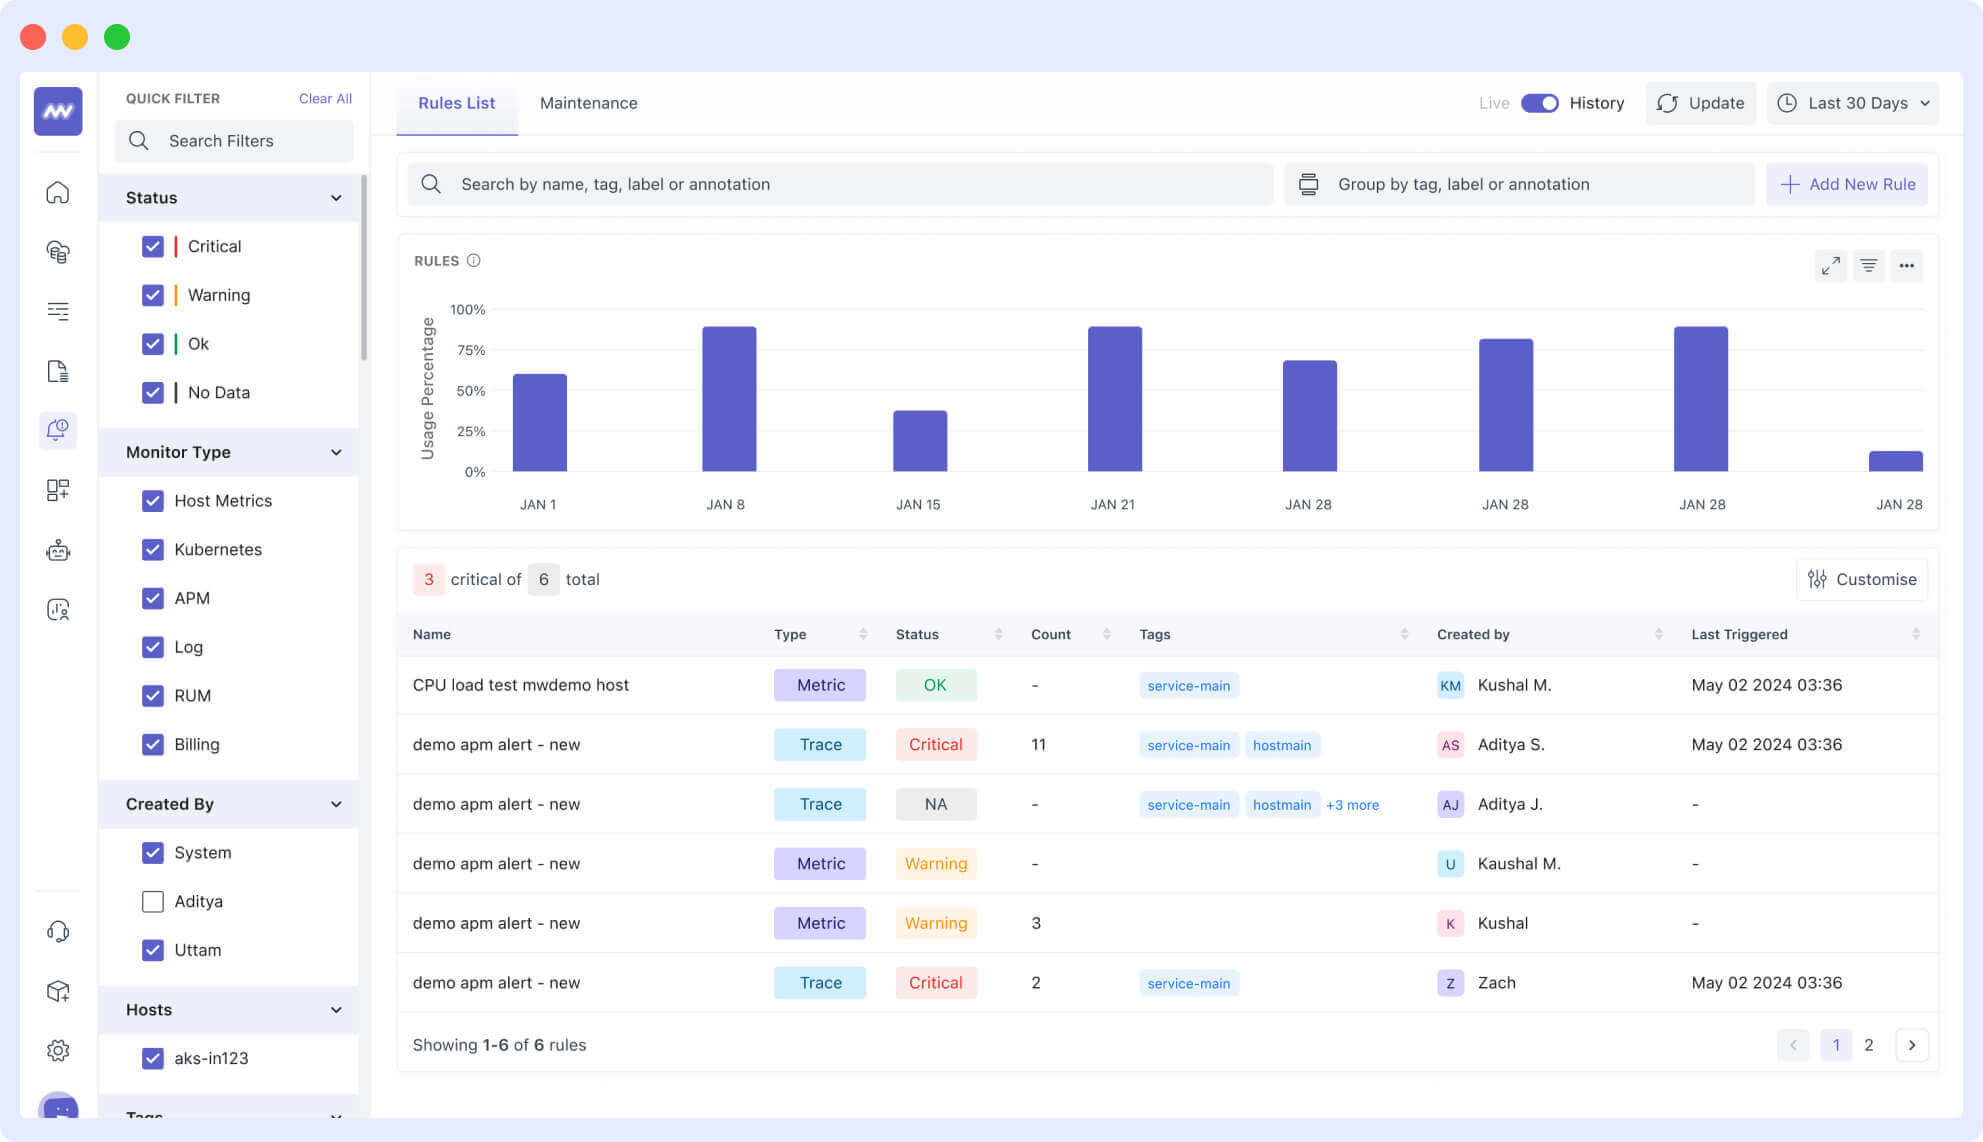
Middleware simplifies log management by offering real-time search, log correlation, and intelligent alerting.
- Real-time Log Search & Filtering: Easily search logs with regex, operator-based queries, and saved filters for quick issue resolution.
- Log Correlation & Analysis: Connect logs with metrics and traces to identify trends and pinpoint root causes faster.
- Proactive Alerts & Issue Resolution: Middleware’s intelligent alerting ensures critical log events trigger notifications, reducing downtime.
Organizations should focus on optimizing log retention, implementing security best practices, and refining log-based alerting strategies. As systems scale, having a robust logging and monitoring setup will be critical to maintaining performance, security, and operational efficiency.


