Log levels play a critical role in observability because they provide the essential context needed to monitor and troubleshoot complex systems effectively.
When managing large-scale applications, certain logs are more important than others because some represent normal operations while others show critical issues. Log levels act as filters that enable teams to identify logs that need urgent intervention.
The article explains the significance of log levels along with their different types and benefits through best practices for implementation. You will gain better system behavior management capabilities through the prioritization of log data.
What are Log Levels?
Log levels function as a system for classifying log messages according to their significance. Log messages follow a structured hierarchy that determines their degree of importance.
System administrators, along with developers and DevOps engineers, use levels to filter important data, which makes log monitoring and maintenance more straightforward.
The fundamental purpose of log levels is to streamline and standardize the data management process for large amounts of software-generated data. It enables teams to access necessary information when needed, which leads to quick responses and system stability.
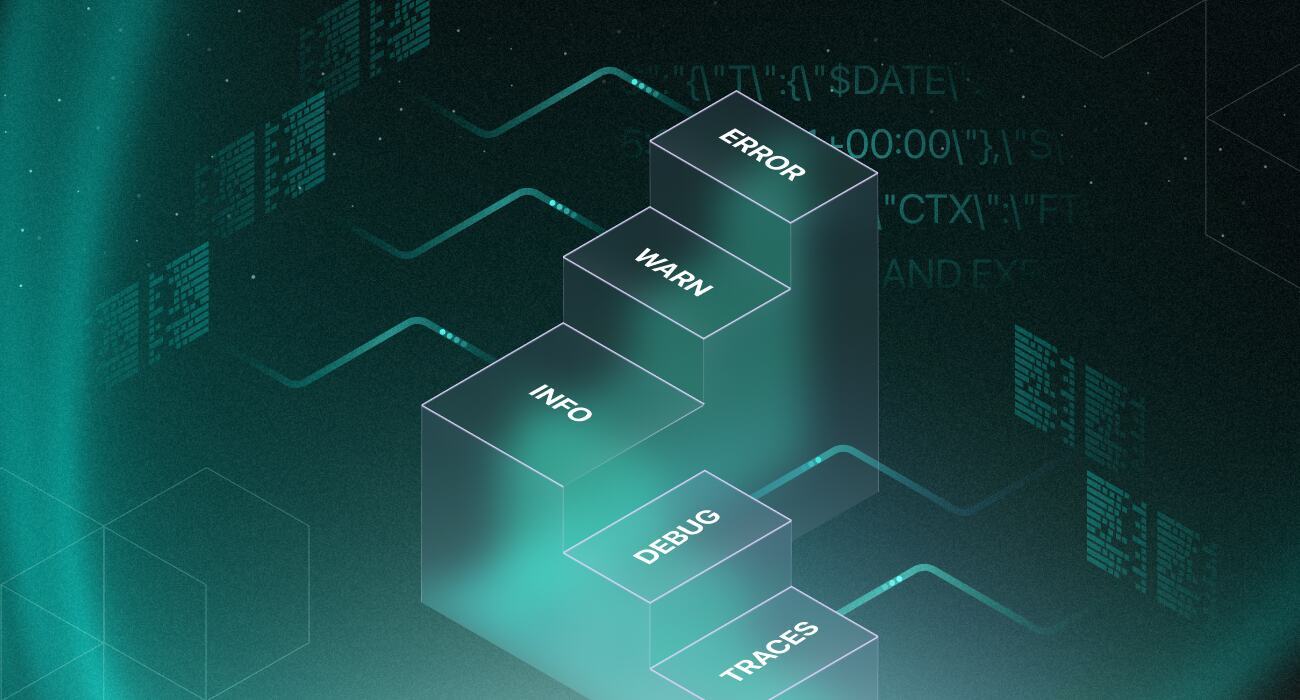
Common Log Levels
This section covers each log level in detail, from the least critical (TRACE) to the most critical (FATAL).
We’ll go over some practical examples of how to use these log levels with JavaScript and Winston, allowing you to apply them efficiently in your applications.
Configuration File
Before we get into the log levels, here’s the Winston configuration file that will serve as a reference as we move forward:
import winston, { error } from "winston";

const { createLogger, format, transports } = winston;
const { combine, timestamp, printf, colorize } = format;

const customLevels = {
  levels: {
    fatal: 0,
    error: 1,
    warn: 2,
    info: 3,
    debug: 4,
    trace: 5,
  },
  colors: {
    fatal: "red",
    error: "yellow",
    warn: "blue",
    info: "cyan",
    debug: "magenta",
    trace: “green”,
  },
};

winston.addColors(customLevels.colors);

const logger = createLogger({
  levels: customLevels.levels,
  level: "trace", // Default log level
  format: combine(
    colorize({ all: true }), // Apply colors to all logs
    timestamp(),
    printf(({ timestamp, level, message }) => {
      return `${timestamp} [${level}]: ${message}`;
    })
  ),
  transports: [
    new transports.Console(),
    new transports.File({ filename: "logs/error.log", level: "error" }),
    new transports.File({ filename: "logs/combined.log" }),
  ],
});

export default logger;
This configuration creates a logger with custom log levels, colors, and output formats. It logs to both the console and files in a log directory.
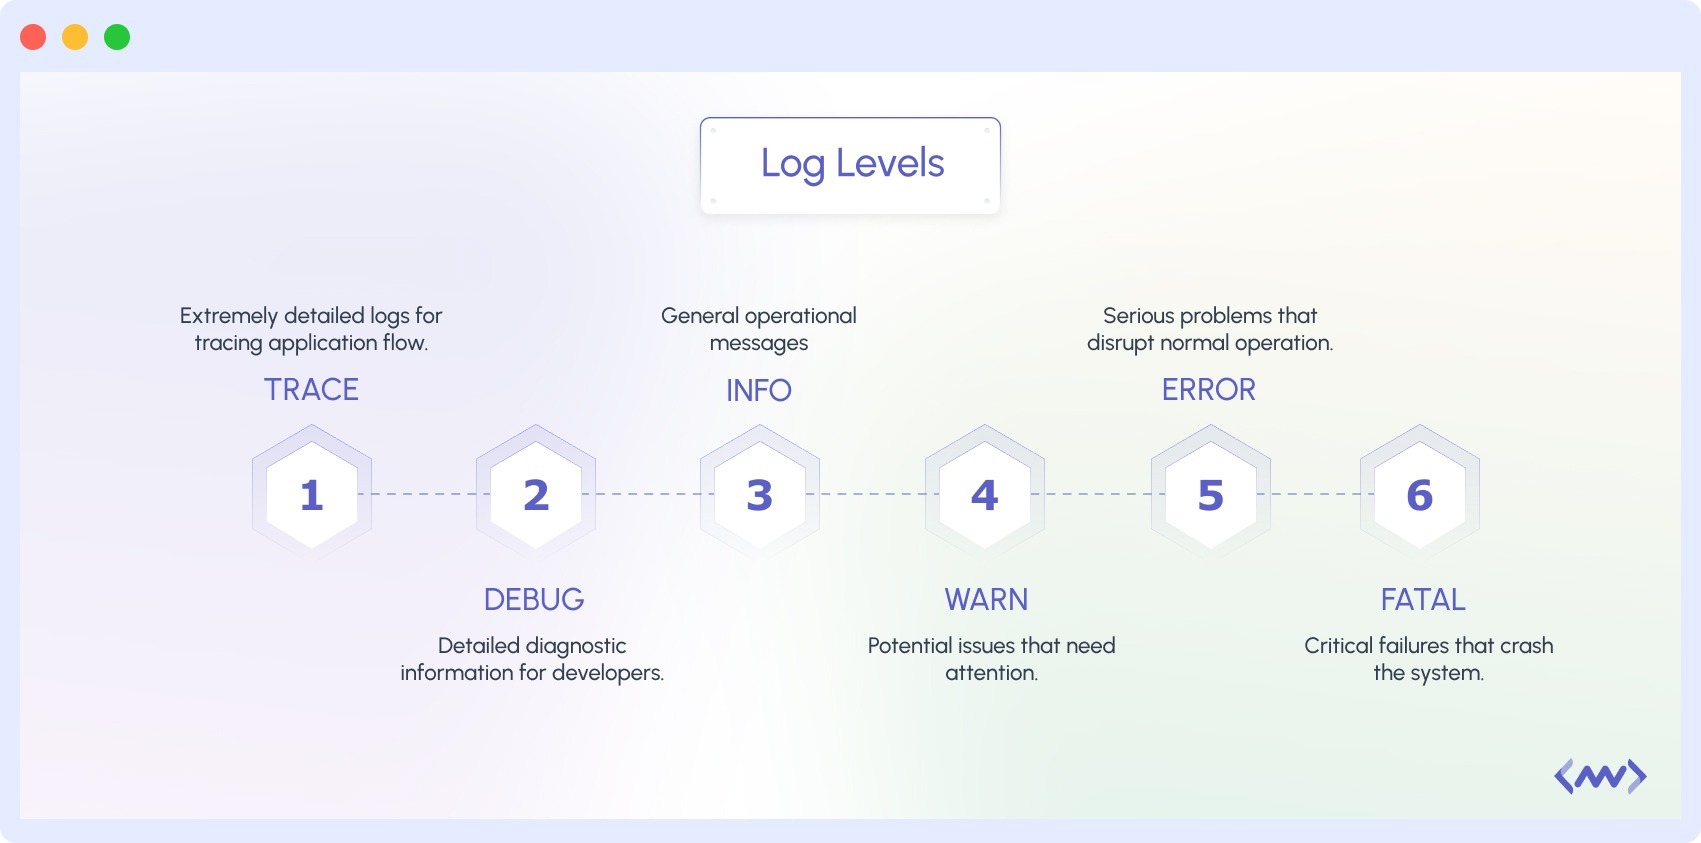
TRACE Level
TRACE is the most detailed log level. It is used for extremely granular debugging, and it captures every single step of an application’s execution, providing a very low-level view of what’s happening.
Example:
router.post("/", async (req, res) => {
  try {
    logger.trace("Request body: " + JSON.stringify(req.body))
    const newPost = new Post(req.body);
    await newPost.save();
    res.status(201).json(newPost);
  } catch (error) {
    res.status(500).json({ error: "Internal server error" });
  }
});
From the code above, we want to log the request body using the logger.trace() method to help us validate and debug.
Output:
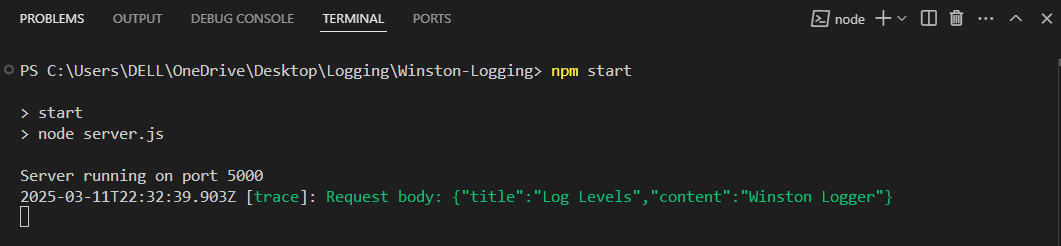
The content and title details were logged as expected.
DEBUG Level
The DEBUG log level records thorough diagnostic data about the system’s internal condition. Developers mainly use these logs to trace application flow throughout development and testing or when troubleshooting problems.
DEBUG logs should be used in development and not production environments. This is because it generates a large amount of data and reduces system performance.
Example:
router.get("/:id", async (req, res) => {
  try {
    const post = await Post.findById(req.params.id);
    logger.debug("Post ID: " + req.params.id);
    if (!post) {
      return res.status(404).json({ error: "Post not found" });
    }
    res.status(200).json(post);
  } catch (error) {
    res.status(500).json({ error: "Internal server error" });
  }
});
This code snippet defines an API endpoint for retrieving a blog post using its ID. The logger.debug() method is used to record the ID of the post being requested for debugging purposes.
Output:
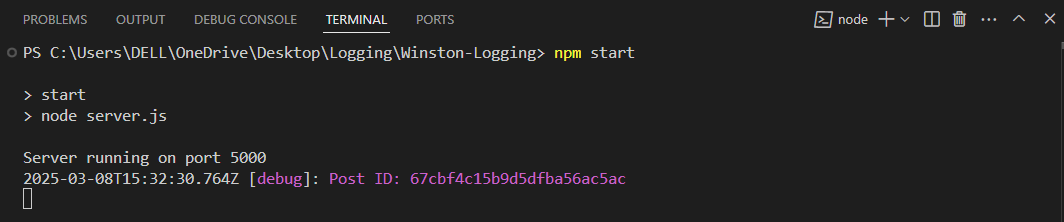
The output highlights that the debug logger correctly recorded the post ID. This can help developers track which posts were requested.
INFO Level
The INFO log level tracks general informational events during the system’s standard operation. The logs display a comprehensive summary of current operations, which demonstrate that all system functions are operating correctly. INFO logs focus on recording important occurrences within the system.
When a log level is configured to INFO, the logging system of an application might record these events:
- Post created successfully
- User logged in successfully
- Payment successful.
Example:
connect(process.env.MONGO_URL)
  .then(() => {
    app.listen(5000, () => logger.info("Server running on port 5000"));
  })
  .catch((error) =>
    console.log(error.message)
  );


router.post("/", async (req, res) => {
  try {
    const newPost = new Post(req.body);
    await newPost.save();
    logger.info("New post created");
    res.status(201).json(newPost);
  } catch (error) {
    res.status(500).json({ error: "Internal server error" });
  }
});
The info logger displays a message when the server has started and when a new post is successfully created. It helps track successful operations and provides a record of system activity.
Output:
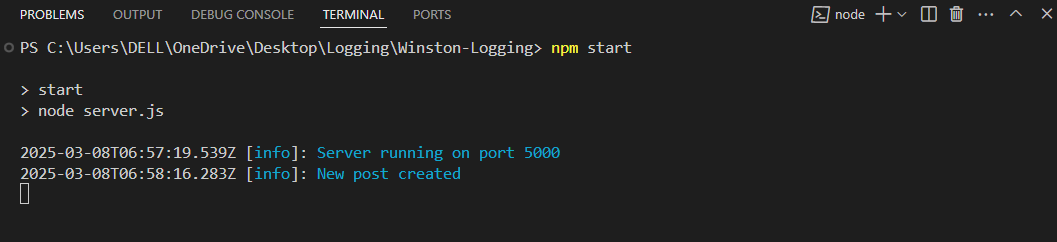
The above output displays two INFO level logs. The first one indicates that the server successfully started on port 5000, while the second one confirms that a new post was created successfully.
WARN Level
This log level represents potential problems or unexpected events that require attention but do not necessarily stop the system from running. They show that something odd has occurred, and while the system may recover or continue, there is a risk of future issues.
WARN log examples might include:
- Trying to access a resource that isn’t available
- An anonymous user attempting to access restricted data
router.get("/:id", async (req, res) => {
  try {
    const post = await Post.findById(req.params.id);
    if (!post) {
      logger.warn("Post not found: " + req.params.id);
      return res.status(404).json({ error: "Post not found" });
    }
    res.status(200).json(post);
  } catch (error) {
    res.status(500).json({ error: "Internal server error" });
  }
});
The code retrieves a blog post by its ID. If the post is not found, the logger.warn() statement logs a warning message.
Output:
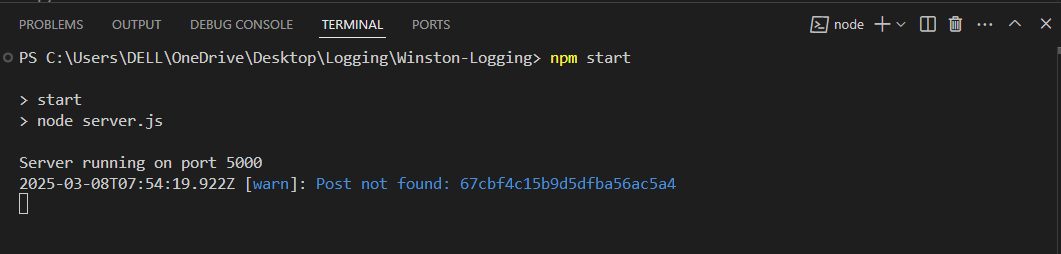
A post is being accessed with an ID, but it wasn’t found in the database. This situation is a warning, not an error, because the system can still operate even though the post is missing.
ERROR Level
The ERROR log level means something failed. An error occurred, and a specific task or function didn’t work. Error logs are created when tasks like payment transactions, data searches, or API calls do not succeed.
Example:
router.post("/", async (req, res) => {
  try {
    const newPost = new Post(req.body);
    await newPost.save();
    res.status(201).json(newPost);
  } catch (error) {
    logger.error("Error creating post: " + error.message);
    res.status(500).json({ error: "Internal server error" });
  }
});
If an error occurs while generating a new blog post, an error message is logged. The logger.error() line records the specific error that occurred.
Output:
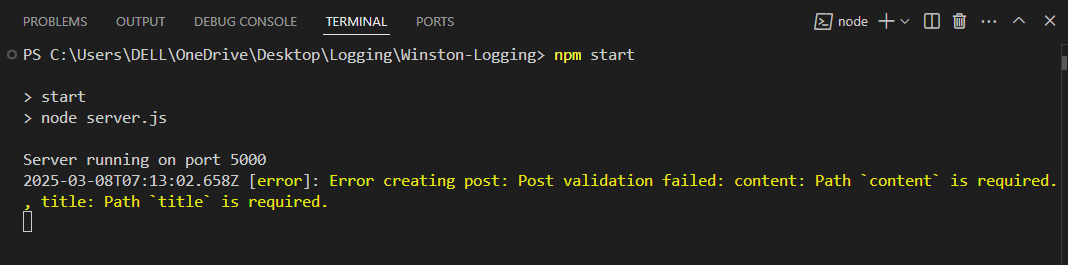
The post creation failed due to validation errors. Specifically, the “content” and “title” fields were missing from the request, which are required fields for a post.
FATAL Level
The FATAL log level represents the most severe error condition. It shows a significant failure, resulting in the immediate and irreversible termination of the system.
This log level also indicates that the system cannot recover and is no longer functional.
Example:
// Connect to MongoDB
connect(process.env.MONGO_URI)
  .then(() => {
    app.listen(5000, () => logger.info("Server running on port 5000"));
  })
  .catch((error) =>
    logger.fatal("Database connection error: " + error.message)
  );
The above code attempts to connect to a MongoDB database. If the connection is successful, it starts the server. If the connection fails, it logs a fatal error using logger.fatal(), indicating a critical issue that prevents the application from running.
Output:
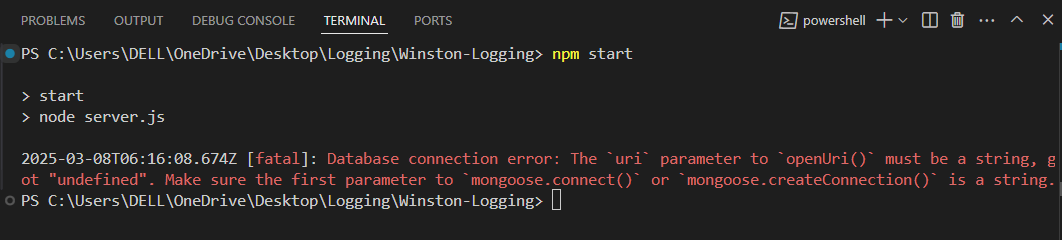
The database connection failed because the MongoDB URI was undefined. This is a fatal error because the application cannot function without a database connection.
Benefits of Log Levels in Observability
Log levels significantly enhance observability by providing clarity and structure to system data. Here are some of the benefits of log levels in observability:
Prioritization
You can determine which logs require attention first from log levels. Logs are separated into various categories to allow the team to concentrate on the most critical issues. For example, INFO logs can be examined later, whereas FATAL or ERROR logs require immediate attention.
Setting priorities in this manner keeps the team from being overburdened and enables them to concentrate on the most important problems.
Efficient Monitoring
Monitoring is greatly affected by a team’s ability to quickly spot anomalies and problematic issues. The ability to identify and filter log data enables effective observing, and log levels offer an effortless way to do just that.
Observability tools can be set to alert on certain log levels, such as ignoring logs on DEBUG and INFO while capturing WARN and ERROR to help recognize problems. Monitoring will help teams to automate activities in such a way that alerts are issued only when they are truly required.
Performance Optimization
Log levels provide insights into system behavior, which helps teams identify patterns or inefficiencies. For example, frequent WARN logs about high resource usage might indicate the need for optimization.
Teams can improve their logging methods by analyzing log levels to ensure that they are capturing the relevant information. This will enable more efficient resource allocation.
Good Developer Experience
Log levels greatly improve the experience of a developer with an easier means of debugging. The relevant logs (DEBUG or ERROR) can be focused on so that the issues can be easily found and fixed. This reduces the time and effort needed to diagnose problems, leading to a productive development process.
Additionally, well-structured logs with appropriate levels make collaboration among developers easier.
Best Practices for Using Log Levels
You also need to adopt best practices to ensure clarity and efficiency when dealing with log levels. Here are some best practices to consider:
Avoid Excessive Logging
Excessive logging can overwhelm your system with unnecessary data, especially at the DEBUG or INFO level. This can lead to:
- Noise: Too many logs make it hard to find meaningful information, and this reduces the effectiveness of your logging system.
- Performance Overhead: High volumes of logs can slow down your application and consume significant storage and processing resources.
Use DEBUG logs only for development or troubleshooting, and limit INFO logs in production to only critical events.
Consistency
This guarantees that all the log messages that you produce are easy to understand throughout your system. Log inconsistency will make it hard to properly analyze the logs and can be quite confusing.
To ensure consistency, it is recommended that you enforce uniform log format and severity across your system. Document your logging standards and make sure that all team members follow them.
Use Structured Logging
This involves writing log messages in an understandable format, like JSON. Logs are easier to find and filter if structured properly. There are tools for structured logging, like Winston for JavaScript and log4j for Java. To add extra context, you should include specific information in each log, such as timestamps, request IDs, and error codes.
Monitor Logs
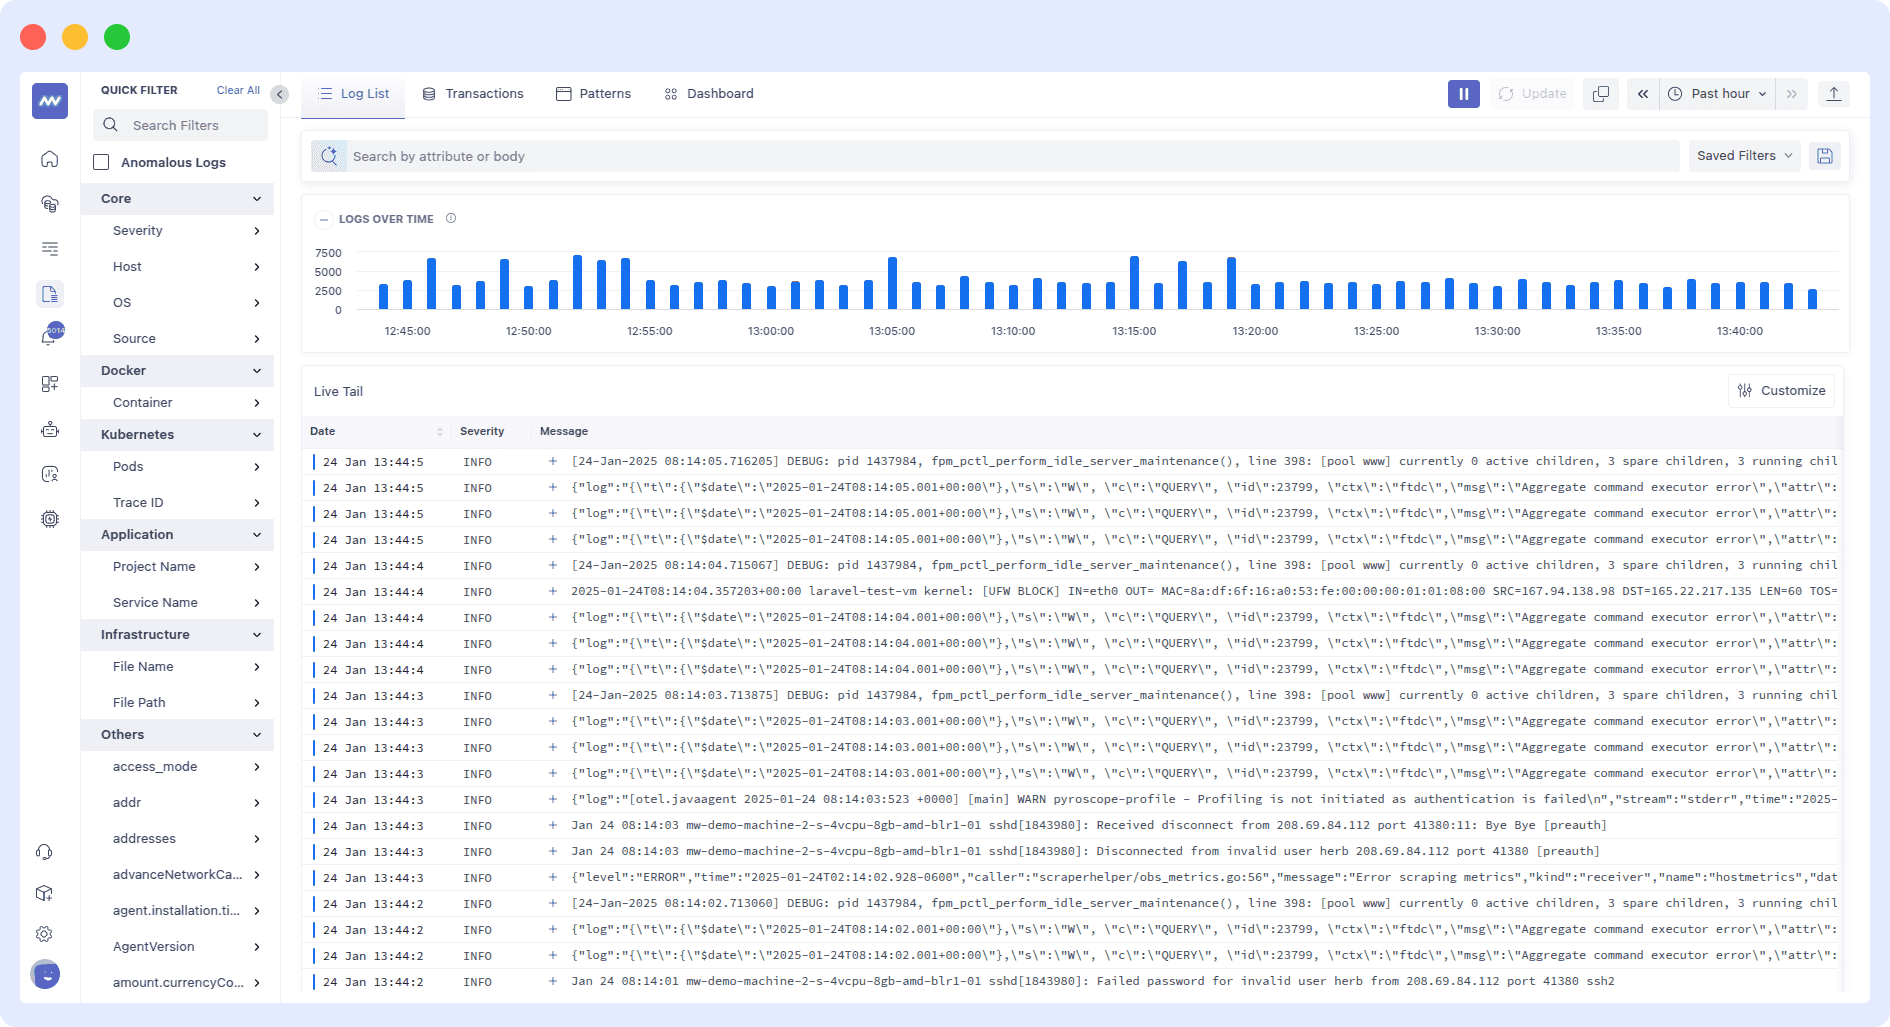
Logs are only valuable if they are regularly monitored. If thorough monitoring isn’t done, critical problems might not be identified until they escalate. Use observability tools like Middleware to gather and analyze logs.
How Middleware Enhances Log Level Management
Middleware is a full-stack observability platform that gathers data from different areas of your application, i.e., from both the frontend and backend, to provide a complete view. It streamlines log collection, analysis, and monitoring and allows you to structure your log data to achieve improved performance.
The middleware takes log management to a different level by providing unique features that allow you to effectively monitor logs and ensure smoother operations.
Here’s how Middleware monitors logs:
- Centralized Log Collection: Logs are gathered from multiple sources, including applications, servers, and databases, into one location. This reduces the need for you to manually review many separate log files.
- Filtering and Searching: Logs can easily be filtered based on their level or other criteria. If you have lots of data, the search log feature lets you quickly locate particular log entries.
- Real-time Alerting: It will notify you instantly when specific logs such as “ERROR” or “FATAL” appear. This quick alert allows you to immediately handle major issues, reducing possible damage.
- AI-Powered Analysis: Middleware analyzes log data using artificial intelligence. This feature can help you spot possible problems before they advance. AI also helps in predicting future problems by analyzing current trends.
- Visualization and Dashboards: With Middleware, it’s easier to spot patterns and issues that might not be clear from raw logs through dashboards and visualizations.
Conclusion
Log levels provide order and understanding to help with the large amount of data that systems produce. It helps teams identify where the most urgent problems are.
Through the use of log levels, observability tools like Middleware can automate monitoring and alerting on what is important to avoid large issues from going undetected.
FAQs
What are log levels?
Log levels indicate the severity of a log message. They help categorize logs based on importance and urgency, allowing developers and operators to monitor system health and troubleshoot issues efficiently.
Which log level severity indicates that there can be a potential problem?
WARNING log level indicates a potential issue that might not immediately impact the system but could lead to a problem if not addressed.
Which configuration option helps users set up a custom log file with different log levels?
Users can configure a custom log file using log exporters and processors in OpenTelemetry. By defining specific log level filters in the logging pipeline, users can control which log messages are recorded and where they are stored.
What is the FATAL log level?
The FATAL log level represents a critical error that causes the system or application to crash. It requires immediate attention as it signifies an unrecoverable failure.
What is the highest logging level in Events?
The highest logging level in events is FATAL, as it indicates a system failure that prevents normal operation.
Which logging level severe?
The most severe logging levels include:
Fatal – A critical failure that forces the system to shut down.
Error – A significant issue that requires attention but may not crash the system.


