
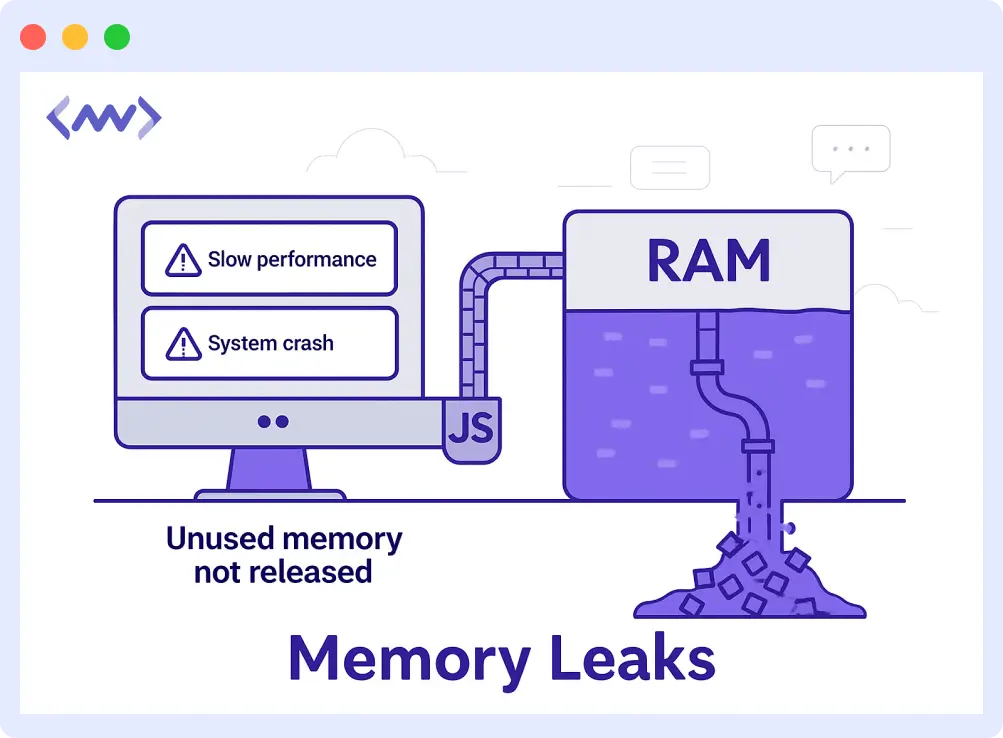
Imagine a scenario where you have limited resources, but a single program takes up more memory than it should, even if it’s not using it. That’s what a memory leak is all about.
You need to identify and prevent these leaks early, or else the program will slowly use up all available memory on your machine and affect the application’s performance. This can also crash the entire application, which is not what you want.
We’ll talk more about memory leaks in this article. We’ll learn what they are, list and explain some common causes, and also show how to find and avoid them.
What is a Memory Leak?
A memory leak happens when a program holds on to memory it no longer needs. This is similar to you going to a restaurant to eat, and when you finish, you refuse to stand up. No one else can sit there even though you’re done. That’s basically what a memory leak does with your computer’s memory.
The memory we’re talking about here is RAM (Random Access Memory). It’s the space your computer uses to handle things quickly while programs are running.
When a program runs, it asks the computer to give it some memory to work with. Once it’s done, it should give that memory back. But if it doesn’t, that memory stays tied up for no good reason.
Here’s a simple example in JavaScript:
let unusedArray = [1, 2, 3, 4, 5];
let unusedObject = {
  name: "Unused Object",
  value: 42,
  description: "This object is not used anywhere in the code."
}
Even though you’re not doing anything with unusedArray and unusedObject, they still take up space in memory. If your code does this over and over again, it can lead to slowdowns or even crash your app.
Impacts of Memory Leaks
Let’s break down some of the impacts of memory leaks:
- Increase in Resource Consumption: As a program continues to use more memory without freeing it, the computer will have less free memory to work with. To handle this, the computer may start using the hard drive as extra memory (this is called paging or swapping), which is much slower. This extra work also increases the load on the CPU.
- Increased Latency: When a single program holds on to memory space, the system will slowly run out of space to work with. It might start using a hard drive as backup memory, which is very slow compared to RAM. This will make your entire app unresponsive.
- System Crash: If memory leaks keep happening without being fixed, the system can eventually crash. This happens because the operating system can no longer handle the heavy memory demands with limited free memory.
Where Do Memory Leaks Commonly Occur?
Memory leaks can happen in different parts of your application, especially in these types of programs:
Frontend Web Applications
Memory leaks in frontend apps usually happen when JavaScript code holds things it no longer needs. Here are some examples of how memory leaks occur in frontend applications:
1. Forgotten DOM References
When you keep references to DOM elements in JavaScript longer than it should be, it can lead to memory leaks. Example:
let element = document.getElementById('myElement');Even though the element with the id “myElement” is no longer on the page, the variable “element” is still holding on to it in memory. To fix this, set the variable to “null.”
2. Unremoved Event Listeners
If you add an event listener to your code and fail to remove it after usage, it can also cause a memory leak.
function setupHandler() {
  const button = document.getElementById('myButton');
  const heavyObject = {
    data: new Array(10000).fill('Hello World')
  };

  const handler = () => {
    console.log(heavyObject.data);
  };

  button.addEventListener('click', handler);

  // Return cleanup function
  return () => button.removeEventListener('click', handler);
}

// Proper cleanup
let cleanup = setupHandler();
setInterval(() => {
  cleanup();
  cleanup = setupHandler();
}, 2000);
Always remove event listeners after usage. You can do that with the removeEventListener method.
3. Mismanaged Closures and Global Variables
Closures and global variables can also cause memory leaks if not managed properly. Just to recap, closures are functions that have access to variables outside their scope.
function outerFunction() {
  let largeArray = new Array(1000000).fill(0);

  return function innerFunction() {
    console.log('Array size:', largeArray.length);
  };
}

let myClosure = outerFunction();
// 'myClosure' now holds a reference to 'largeArray',
// potentially causing a memory leak if 'myClosure' is kept indefinitely.
Avoid using global variables unless necessary, and release captured variables in closures by setting them to null.
Backend Systems
Memory leaks in backend systems are very common because they handle the application’s logic and many users at once.
If you’re working with Java, it’s important to continuously monitor memory allocation, garbage collection, and heap usage. Here’s a helpful guide on Java performance monitoring to detect and resolve such bottlenecks early.
1. Object Caches Not Cleared
Sometimes, backend programs use caches to store data for quick access. If there are items you don’t use but fail to remove from these caches, they keep using the memory.
const cache = {};

function addToCache(key, value) {
  cache[key] = value;
}

// If you never remove old keys, cache keeps growing
To prevent this, remove unused items from the cache. You can also use cache libraries that support automatic cleanup or expiration.
2. Static references to heavy objects
Static variables or global objects stay in memory for the backend program throughout. If you store large objects or collections in static variables without clearing them, the program will never remove them from memory. So, you should avoid storing large or temporary data in static or global variables.
Mobile Applications
Mobile apps can have memory leaks when they keep objects for too long. For instance, if an app keeps references to screens like activities or fragments even when they don’t need them again, the system can’t free up that memory. Another common reason is working with big images or bitmaps. This can quickly fill up memory.
This can make the app run slower and consume more battery. Tools like Middleware and LeakCanary can help find and fix these leaks.

Third-Party Libraries
Third-party libraries are common places where memory leaks occur. They are difficult to spot because the problem is not directly in your code. For example, stateful services can hold onto data, which keeps memory always in use.
Similarly, inactive user sessions, queues, or threads that aren’t thoroughly cleaned up can consume memory over time. Another common problem is mismanaging buffers or data streams, where data is kept in memory but never cleared or processed fully.
Microservices and Cloud-Native Apps
Microservices and cloud-native apps, like those running inside Kubernetes Pods, can experience memory leaks in several ways. Memory leaks in microservices can cause the pod to run out of memory and crash.
A leak in one microservice can affect others that depend on it. It’s important to monitor memory usage closely and optimize resource handling to prevent these leaks, especially in complex environments like Kubernetes, where many services run together.
Common Causes of Memory Leaks
Memory leaks are not something that happens intentionally. Sometimes, they mistakenly occur due to how you write your code, how you design the system, or through third-party tools. Let’s look at some common causes:
Language-Specific Problems
Some programming languages accidentally create memory leaks. As mentioned earlier, in JavaScript, closures can keep references to DOM elements even when the elements are removed from the page. Another one is forgetting to remove event listeners.
window.addEventListener('resize', handleResize);Remove event listeners that are no longer needed from an element you add to an element so that the browser won’t keep it in memory and cause leaks.
System Design Issues
The way you design your system can also trigger memory leaks. If you don’t handle sessions or caches very well, old or unused data can pile up and remain there. For example, if a user logs out and you don’t remove sessions from memory, the memory stays in use. Again, when using asynchronous code (like promises, timers, or background tasks) and fail to clean up, they can also cause memory leaks.
Third-Party Libraries and Frameworks
If a third-party tool has a bug or doesn’t manage memory well, it can leak memory into your application. This is tricky because you might not notice the problem right away, and it could require updating or replacing the library.
How to Detect Memory Leaks
Memory leaks can be very tricky, but there are ways you can easily detect them.
1. Warning Signs
One way to notice memory leaks is by watching how your application behaves. If you notice the memory usage slowly increasing, the app getting slower, or the system doing frequent garbage collection, these are signs of possible memory leaks. The app might also crash if it runs out of memory.
2. Manual Detection (Code Review)
You can spot memory leaks by carefully reviewing your code. Look for places where;
- Variables are created but not used
- Event listeners are added but not removed
- Timers or intervals keep running in the background.
- Large objects or data are stored in global variables.
3. Using Built-in Tools
Most programming languages have built-in tools that can help detect leaks. JavaScript developers can use Chrome DevTools to take snapshots of memory usage and show what objects are not being released.
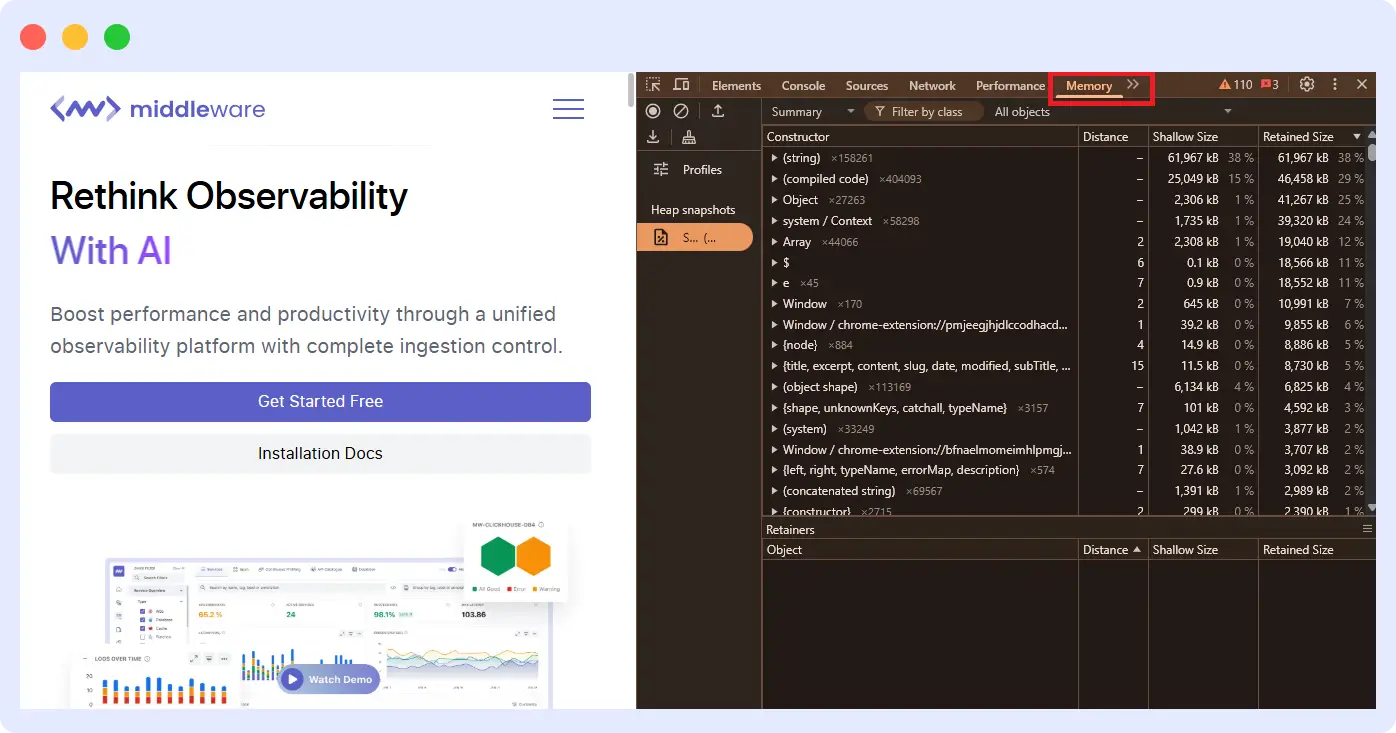
These tools help you see exactly where memory is being used and if something is leaking.
4. Monitoring Tools
There are also monitoring tools that watch your application’s memory use in real time and alert you if something looks wrong. A good example of such tools is Middleware. Middleware can track memory consumption and warn you about leaks or unusual patterns.
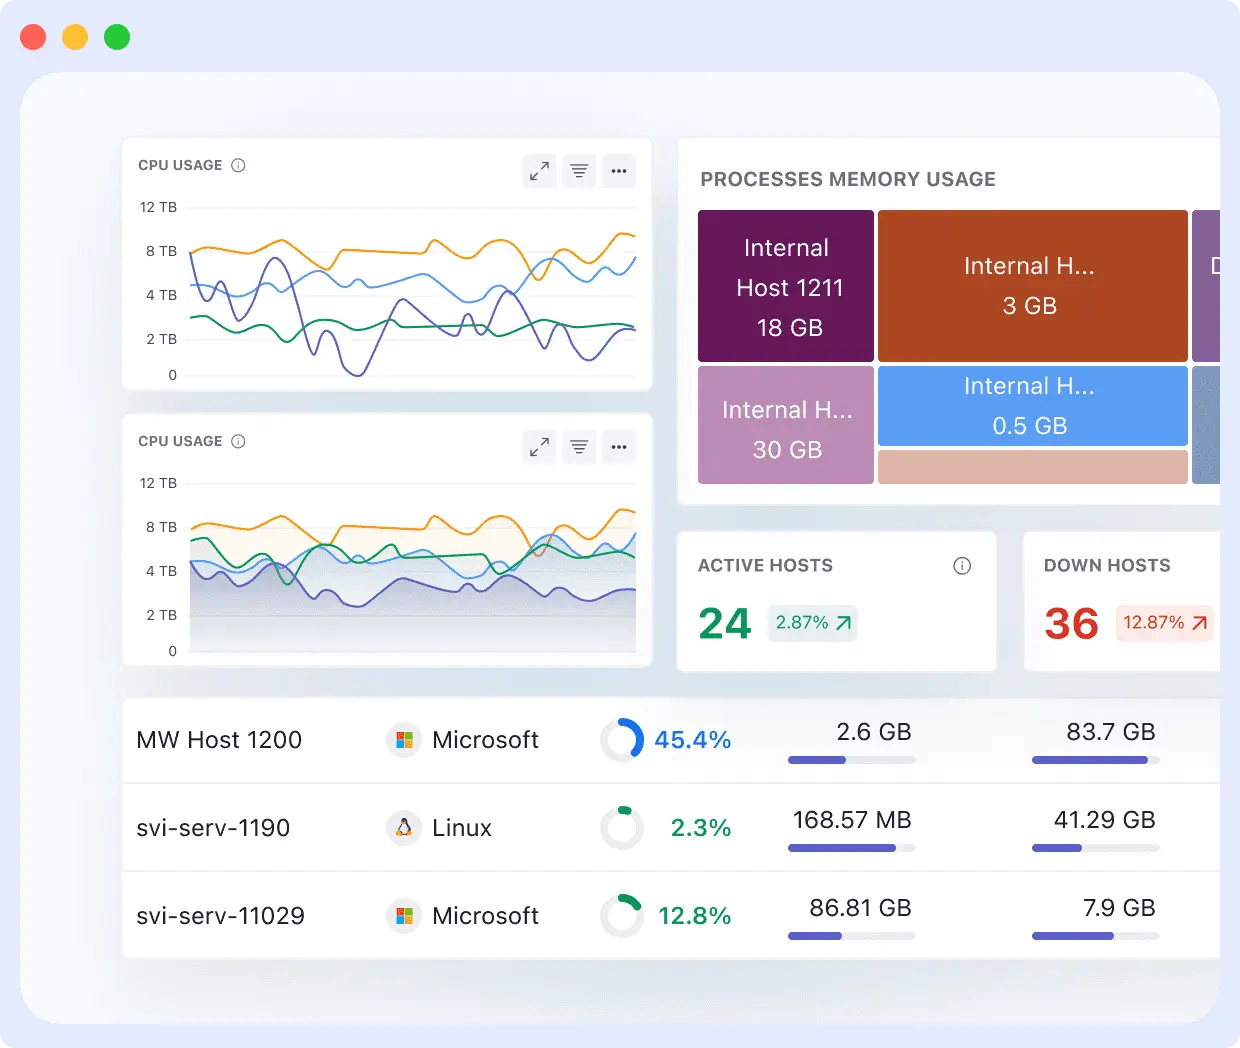
These tools are useful for catching leaks early, especially in production environments.
Monitor, detect, & resolve leaks smarter.
Request a demo or start a free trial of Middleware today.
Real-World Memory Leak Incidents
Memory leaks aren’t just theoretical, they’ve caused real disruptions in large-scale systems:
- Amazon EC2 Outage: A latent memory leak in EC2’s internal monitoring agent led to widespread failures across multiple availability zones. Services like Reddit, Pinterest, and Foursquare were affected due to uncontrolled memory consumption and lack of alerts.
- Google Docs Outage: A memory leak in lookup servers during a backend update caused cascading crashes. The entire Docs service was down for over an hour, highlighting how backend memory mismanagement can disrupt even globally distributed systems.
Preventing Memory Leaks
Memory leaks can cause significant damage to your application; however, there are different ways to prevent them before they cause damage.
1. Use Garbage Collection
Most programming languages (like JavaScript, Java, or Python) have garbage collection. It automatically frees memory that’s no longer being used. For example:
let user = { name: "Chosen" };
user = null; // This allows the garbage collector to clean it up
Once you set “user” to null, JavaScript removes it from memory. That’s how garbage collection works. It tracks variables and objects and frees the memory if nothing is using them.
2. Use Memory Profiling and Testing
Regularly check your code with memory profiling tools to catch leaks early.
Examples of tools:
- Chrome DevTools for Javascript
- VisualVM for Java
- Valgrind for C++
3. Write Clean and Maintainable Code
Write clean and maintainable code because it’ll be difficult to spot where memory has been held too long in messy code.
- Avoid global variables unless necessary
- Close resources properly (like files)
- Remove event listeners when they’re no longer needed
- Break down your code into smaller components.
4. Proper Resource Management
For languages without garbage collection (like C or C++), manually free memory. You should always release database connections, file handles, and timers.
How Middleware Helps in Managing Memory Leaks
Middleware offers an observability platform that helps to detect, analyze, and prevent memory leaks.
Here’s how:
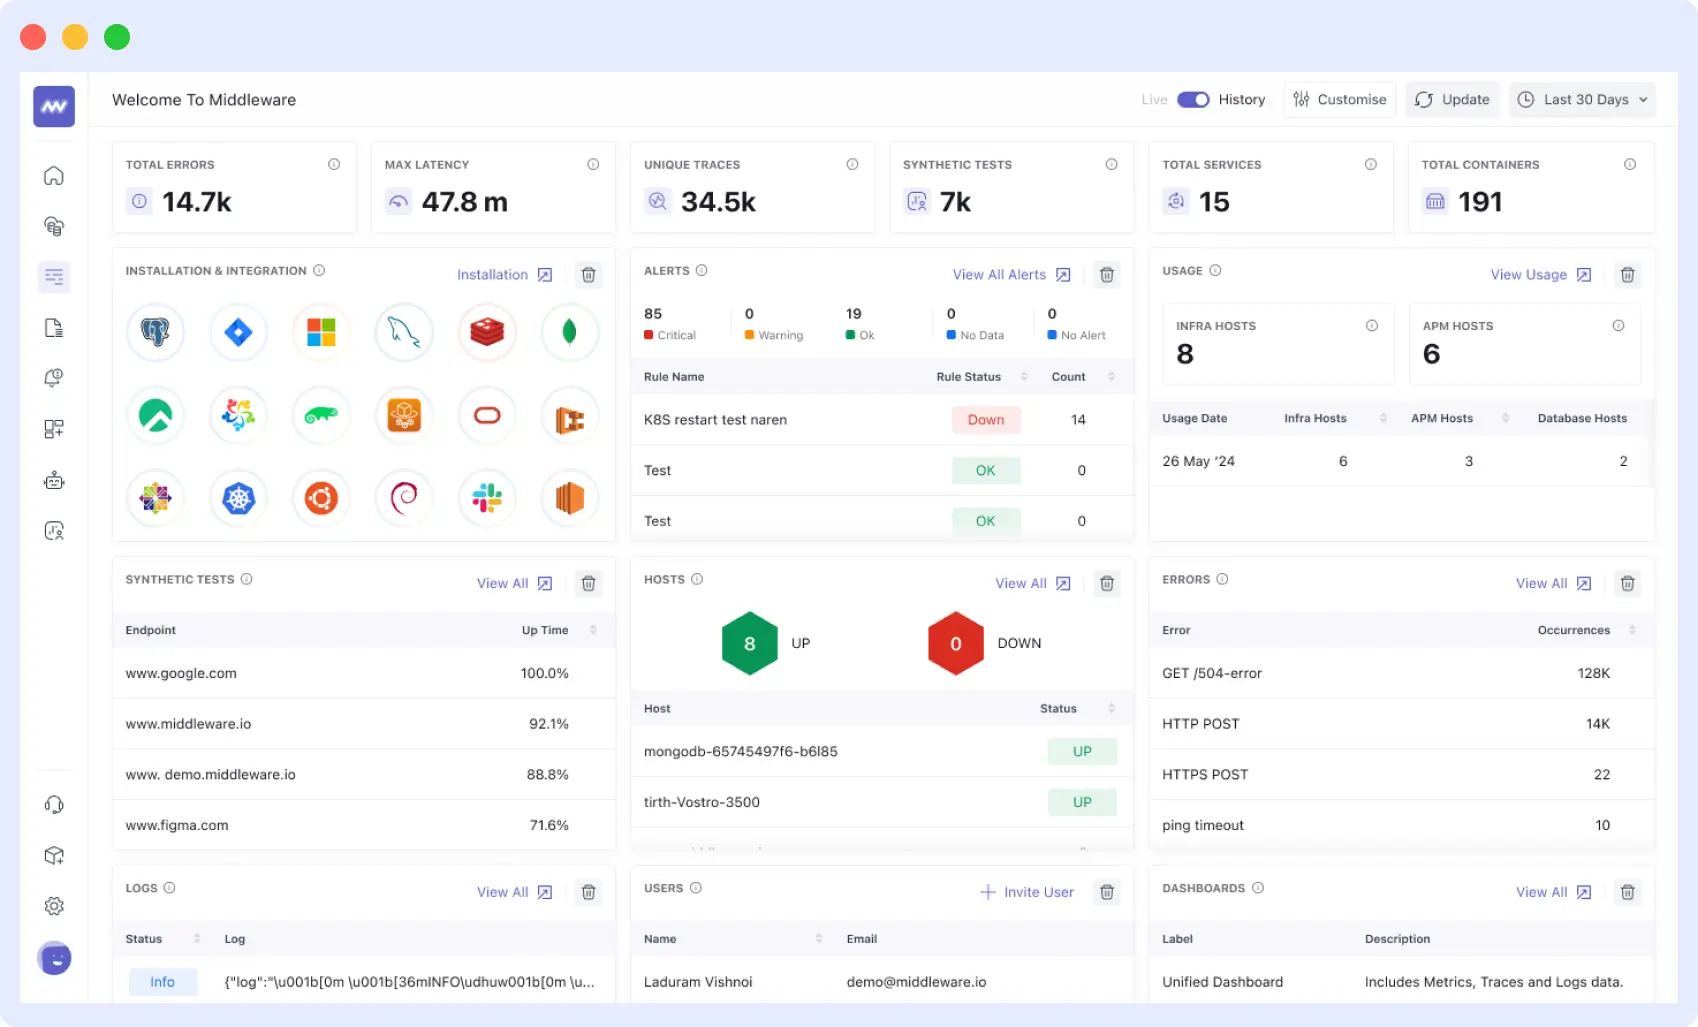
Real-time Monitoring and Alerts
Middleware monitors memory usage and other key performance metrics in real time. This means it tracks how much memory your applications and services are using at every moment. If it detects something unusual, it alerts you immediately.
You can customize these alerts however you want. With this, your team can respond quickly before the leak causes serious problems.
Middleware monitors memory usage and other key performance metrics in real time. You can even set up custom alerting rules in Middleware to catch anomalies the moment they appear.
Root Cause Analysis
Once Middleware detects a potential memory leak, it helps you track down the root cause. Its alert feature connects warnings directly to related information such as logs, traces, and metrics, making it easier to understand exactly where and why the memory leak is happening. This reduces the time spent guessing and speeds up fixing the issues before they impact users.
Proactive Prevention
Middleware also supports proactive prevention by storing historical performance data and analyzing trends. This lets you spot slow-growing memory leaks before they become critical.
Middleware uses anomaly detection and machine learning to identify irregular memory usage patterns and resource misallocation early on. This insight helps teams optimize resource management and tune their applications to avoid leaks in the first place.
Conclusion
In summary, memory leaks are something you shouldn’t overlook, as they can cause serious damage to your application. The good news is that there are ways you can detect and prevent them, which we’ve discussed in this article.
Use infrastructure monitoring tools like Middleware to track memory usage. It’ll help you identify where in your system is consuming the most memory. With this, you can be able to take actions to avoid memory leaks.
FAQs
What causes memory leaks?
Common causes include keeping unused objects in memory, not closing files or database connections, and issues with third-party tools.
How can I tell if my application has a memory leak?
Your app might become slower, use more memory, or even crash. Some tools, like Chrome DevTools, can help you spot these leaks too.
How do I fix a memory leak?
First, find the leak using tools or by reviewing your code. Then, update your code to release memory when it’s no longer needed.
Can memory leaks be prevented?
Yes! You can avoid memory leaks by writing clean code, managing resources very well, using garbage collection, and regularly testing your application.