In Kubernetes, everything runs inside pods. Instead of dealing with containers one by one, Kubernetes uses pods to group them together and manage them more easily.
That’s why monitoring pods is so important. You need to know if your apps are running smoothly and how much CPU or memory they’re using. That’s where Prometheus comes in to help.
Learn more about how Prometheus works and what makes it ideal for Kubernetes monitoring.
Prometheus works with Kubernetes to automatically find pods, gather metrics, and store that information over time. It offers a resource called Prometheus Pod Monitor that determines which pods to monitor. This article explains Prometheus Pod Monitor, along with how it works, when to use it, and some best practices for configuring it in your Kubernetes clusters.
What is Prometheus Pod Monitor?
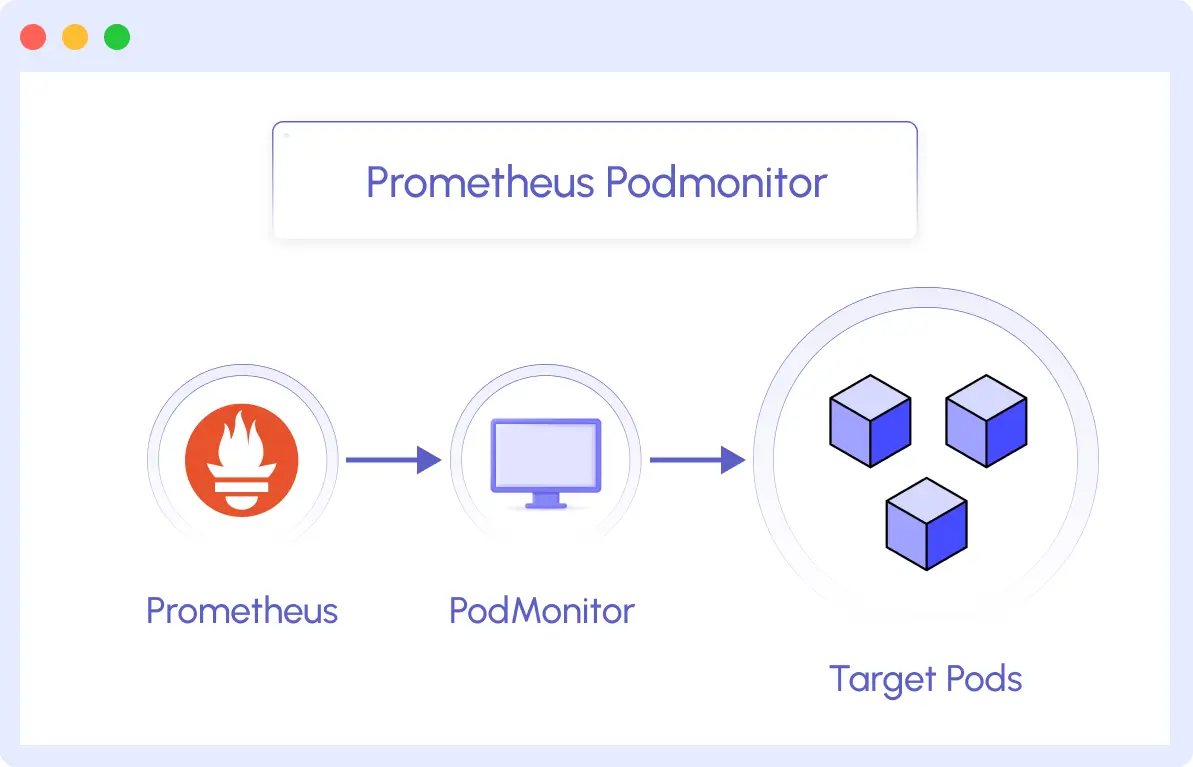
Pod Monitor is a custom resource from Prometheus Operator that runs in Kubernetes to discover and monitor pods automatically. Instead of manually configuring each pod or service for monitoring, Pod Monitor tells Prometheus which pods to collect metrics from (scrape), how to collect them, and which Prometheus labels to include (for filtering and organizing metrics).
To understand all the key K8s metrics that can be collected from your pods, check out our detailed guide on Kubernetes Metrics
Prometheus usually finds services and endpoints on its own in Kubernetes. But sometimes that’s not enough, especially when you need to monitor specific pods directly, without relying on a service. That’s exactly what Pod Monitor is for.
Benefits of PodMonitor in Kubernetes Monitoring
Using PodMonitor gives you more flexibility when monitoring applications in Kubernetes. Here are some benefits of PodMonitor:
1. Pod-level monitoring
With PodMonitor, you can monitor individual pods directly and not just services. This is useful when your app doesn’t expose a service or when you want to have a good look at what’s happening inside each pod.
2. Better flexibility with labels
You can use label selectors in Pod Monitor to pick out the specific pods you want to watch. You don’t have to write any code; all you have to do is label your pods correctly, and Pod Monitor will find them on its own.
3. Works well with dynamic environments
Pods change constantly, so Pod Monitor helps to track these changes automatically. As long as the pods match the labels you set, Prometheus Pod Monitor will start or stop scraping metrics as needed. No manual updates are required.
How Prometheus Pod Monitor Works
In Kubernetes, everything is dynamic. Pods can be created, destroyed, and rescheduled at any time. This makes monitoring a bit tricky. You can’t rely on static IPs or fixed endpoints; things change too often. That’s where Prometheus and Pod Monitor come together to make monitoring easier.
Here’s how it works:
1. Discovery: How Prometheus Finds the Right Pods
Prometheus relies on a Pod Monitor to identify which pods to monitor. The Pod Monitor resource is created inside your Kubernetes cluster. When you create one, it includes rules based on labels, and these labels help Prometheus identify the pods that match some criteria.
As new pods with the same label are created, Prometheus picks them up automatically. If a pod gets deleted, Prometheus stops scraping it. This is possible because Prometheus (through the Prometheus Operator) is tightly integrated with Kubernetes. It watches for changes in real time.
2. Scraping: How Prometheus Collects the Data
Once the pods are discovered, Prometheus needs to know how to actually get metrics from them. Applications usually expose metrics over HTTP, often on a path like /metrics, and on a specific port.
Pod Monitor specifies:
- The port name (like metrics-port) where the app exposes metrics
- The path
- The interval (how often Prometheus should scrape)
With that information, Prometheus starts sending HTTP requests to each pod on the specified path and port. The response is just plain text with metrics like CPU usage, request count, response times, etc. Prometheus reads that data and stores it in its time-series database.
For more information Middleware’s Prometheus integration, click here.
Setting up a Pod Monitor
You’ve seen what a Pod Monitor is and why it’s helpful. Now let’s look at how to set it up in your Kubernetes cluster.
Prerequisite
Before you start, make sure you have the following:
- A Kubernetes cluster is up and running.
- Prometheus Operator installed. You can install using kube-prometheus or Helm charts.
- Your application (or test app) must expose metrics on an HTTP endpoint, like /metrics
Step 1: Deploy a Sample application That Exposes Metrics
Let’s use a simple Node.js app. This app uses the prom-client library to expose metrics at /metrics on port 8000.
// app.js
const express = require('express');
const promClient = require('prom-client');

const app = express();
const port = 8000;

// Enable Prometheus metrics
const collectDefaultMetrics = promClient.collectDefaultMetrics;
collectDefaultMetrics({ timeout: 5000 }); // Scrape every 5s

// Custom metric example
const httpRequestsTotal = new promClient.Counter({
  name: 'node_http_requests_total',
  help: 'Total number of HTTP requests',
  labelNames: ['method', 'path'],
});

// Sample endpoint
app.get('/', (req, res) => {
  httpRequestsTotal.inc({ method: req.method, path: '/' });
  res.send('Hello, Prometheus PodMonitor!');
});

// Metrics endpoint (for Prometheus)
app.get('/metrics', async (req, res) => {
  res.set('Content-Type', promClient.register.contentType);
  res.end(await promClient.register.metrics());
});

app.listen(port, () => {
  console.log(`App listening on port ${port}`);
});- Create Docker Image
If you’re deploying to Kubernetes, you’ll want to create a Docker image:
FROM node:18-alpine
WORKDIR /app
COPY package.json .
RUN npm install
COPY . .
EXPOSE 8000
CMD ["node", "app.js"]
Step 2: Deploy the App to Kubernetes
Assuming you’ve built and pushed the Docker image (e.g., nodejs-metrics-app:latest), here’s how you can deploy to Kubernetes:
apiVersion: apps/v1
kind: Deployment
metadata:
name: nodejs-metrics-app
spec:
replicas: 1
selector:
matchLabels:
app: nodejs-metrics-app
template:
metadata:
labels:
app: nodejs-metrics-app
monitoring: enabled # Required for PodMonitor
spec:
containers:
- name: nodejs-metrics-app
image: nodejs-metrics-app:latest
ports:
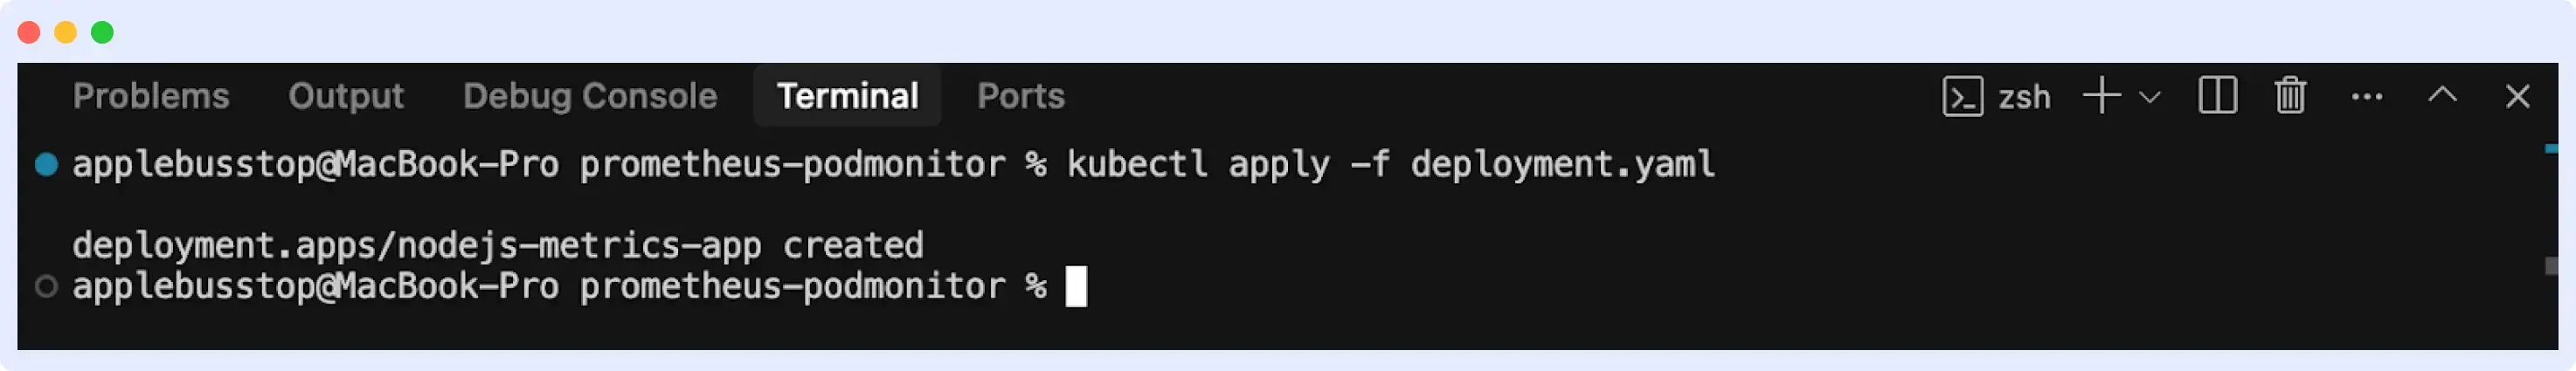
- containerPort: 8000Apply it:
kubectl apply -f deployment.yamlOutput:
Step 3: Define the PodMonitor (podmonitor.yaml)
Now define a PodMonitor so Prometheus knows which pods to scrape.
apiVersion: monitoring.coreos.com/v1
kind: PodMonitor
metadata:
  name: nodejs-app-monitor
  namespace: monitoring  # Same as Prometheus Operator
spec:
  selector:
    matchLabels:
      monitoring: prometheus  # Matches pod label
  podMetricsEndpoints:
  - port: 8000           # Matches Node.js app port
    path: "/metrics"      # Default Prometheus endpoint
    interval: 15s         # Scrape interval
Apply the PodMonitor:
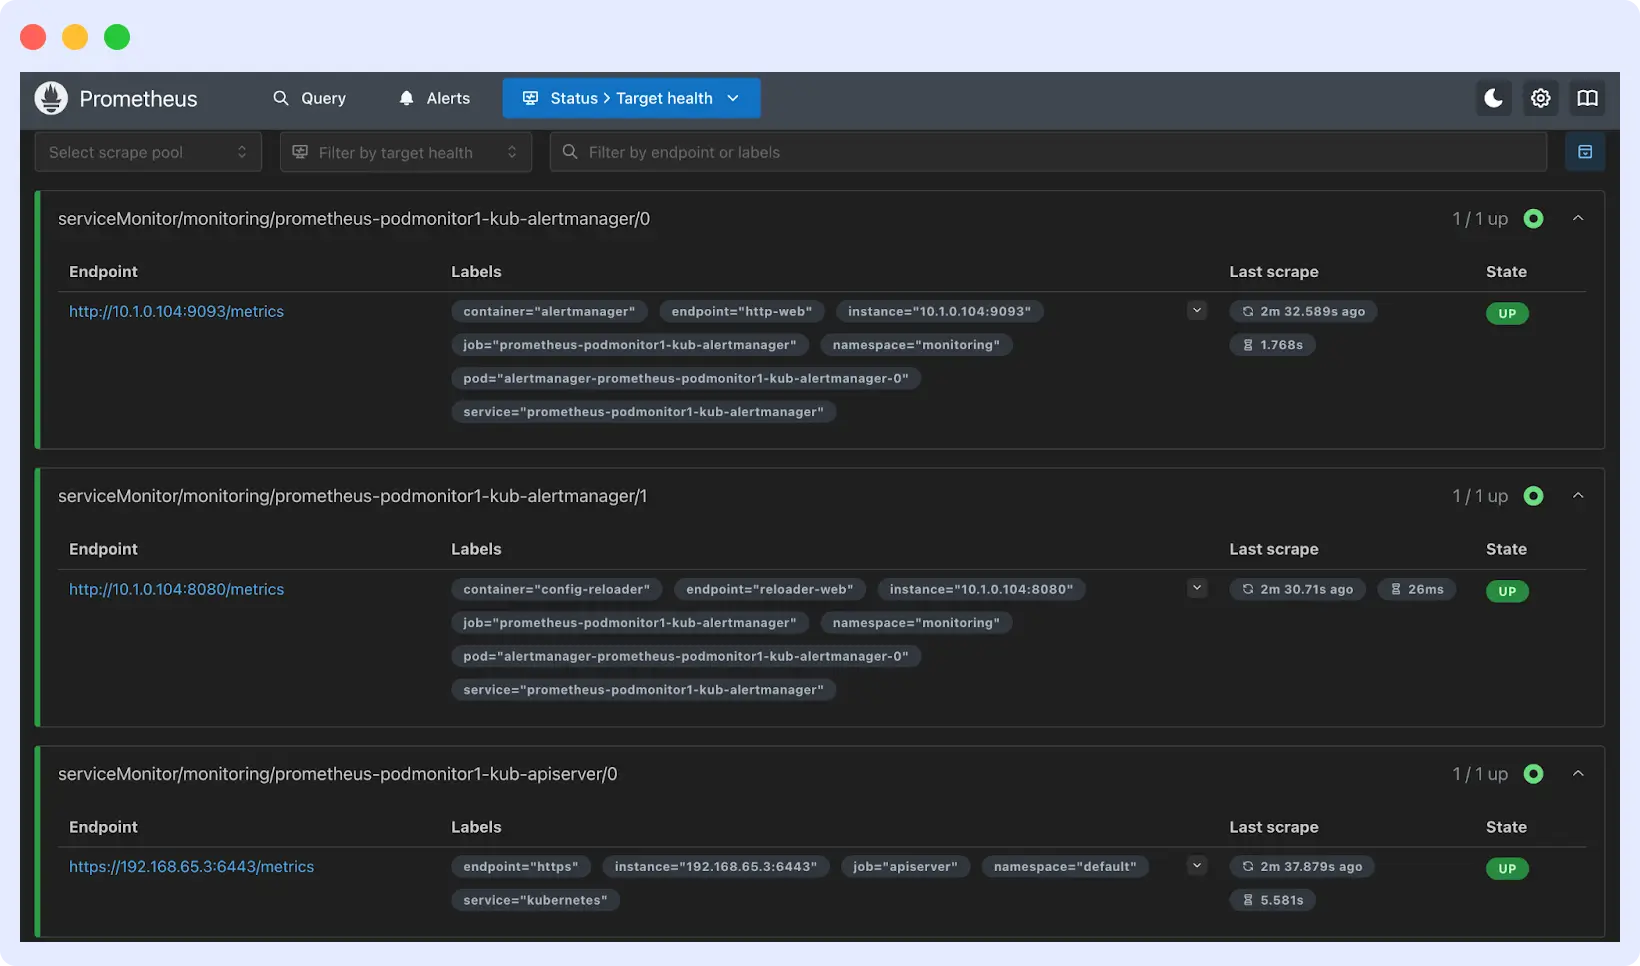
kubectl apply -f podmonitor.yamlStep 4: Verify Prometheus is Scraping the Pod
To verify if Prometheus is scraping the pod, you can go to the Prometheus web UI and visit the “Targets” tab. You should see your pods listed.
Visualizing Pod Metrics
It’s important to monitor your pod metrics. Once your app is running in Kubernetes, monitoring metrics are the best way to see how it’s really doing.
Here’s a step-by-step guide to visualizing Prometheus metrics effectively using dashboards and tools.
By tracking and visualizing them, you can spot issues early and understand how your app is performing in the real world.
Visualizing and Monitoring Pod Metrics with Middleware
Prometheus works great with tools like Grafana for viewing pod metrics, but they can be a bit tricky to manage, especially if you need long-term storage, alerts, or easy dashboard sharing.
See our comparison on Prometheus vs. Grafana to understand which tool fits your stack better.
This is where you need Middleware. Middleware integrates with Prometheus to simplify the process of monitoring Kubernetes workloads. It supports Prometheus remote write, which means you can forward all your metrics from Prometheus directly to Middleware’s platform.
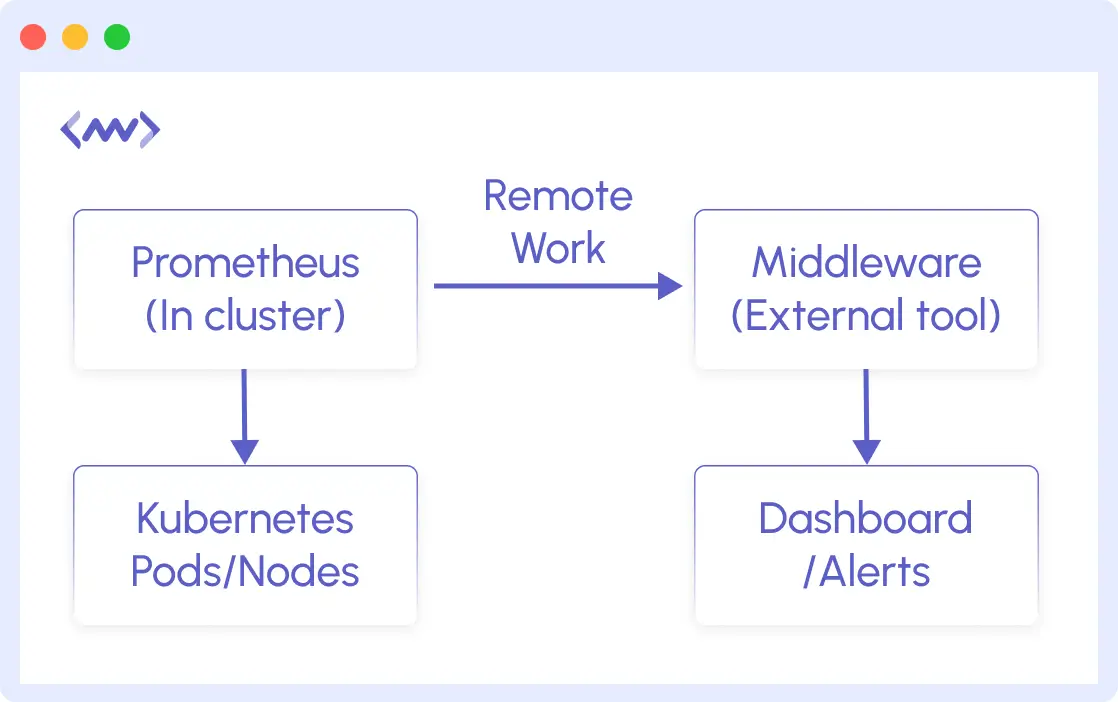
If you’re already scraping pod metrics with Prometheus and PodMonitor, you can start sending that data to Middleware with a simple configuration. It also has a good UI for visualization and alerting.
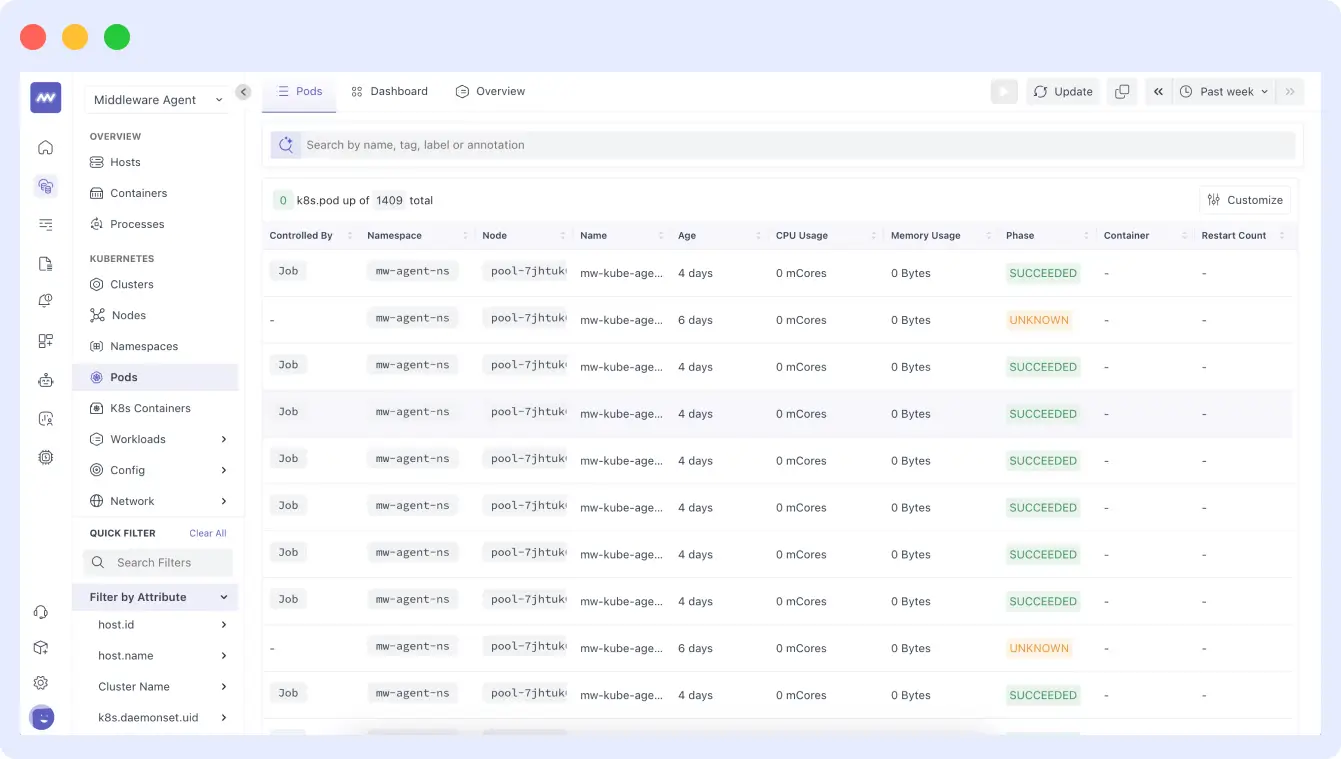
Middleware provides:
- Auto-discovery of Kubernetes Metrics: After connecting, Middleware can automatically detect your pods, containers, and services.
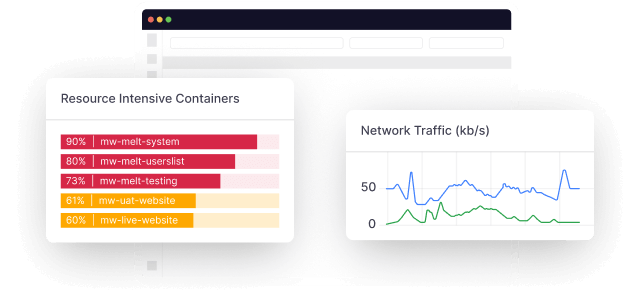
- Built-in Dashboard for Kubernetes: Middleware provides a dashboard for things like pod health, CPU/memory usage, and network activity.
- Simple Alerts: Set up alerts without writing PromQL (Prometheus Query Language) manually. You’ll get notified when a pod isn’t performing as expected.
- Custom Visualizations and Filters: You can create custom charts, filter by namespace or pod, and organize metrics the way your team prefers.
Use Cases for Prometheus PodMonitor
This section covers the use cases for Prometheus PodMonitor. Here are the common ones you should know:
Monitoring Pods That Don’t Have a Service
Many Kubernetes monitoring tools rely on Services to find and reach pods. But what if your application doesn’t expose a Service? That’s a problem for regular Prometheus scraping. PodMonitor solves that problem.
You can target pods directly using labels, even if there’s no Service in front of them. This is useful for apps that don’t expose a network service
Scraping Metrics from Sidecar Containers
Some applications use sidecars; that is, an extra container running alongside the main app in the same pod. These sidecars often handle things like logging, caching, or exporting metrics.
With Pod Monitor, you can scrape metrics directly from the sidecar, even if the main container doesn’t expose anything. Since Prometheus scrapes at the pod level, it doesn’t care which container the metrics come from, as long as you specify the right port and path.
Multi-Path Metrics Collection from a Single Pod
Sometimes, a single pod might expose different kinds of metrics at different paths or ports. For example, one container might serve application metrics on /metrics, and another might serve health metrics on /health.
Pod Monitor allows multiple endpoints per pod, so you can collect from each one separately. This gives you full flexibility to scrape everything you need, even if it comes from different parts of the pod.
Best Practices for Using Prometheus PodMonitor
Setting up PodMonitor is very straightforward, but you need to follow some best practices for everything to work well. Here are the top best practices to follow:
1. Use Clear and Consistent Labels on Pods
PodMonitor selects pods based on labels. If your labels are not clear or inconsistent, you might miss important pods or accidentally scrape the wrong ones. Avoid this by defining a clear label across your workloads.
For example, use something like:
labels:
  app: frontend-app
  component: user-interface  # Clarifies the app's role
  monitoring: prometheus     # Explicitly ties to Prometheus
  env: prod                 # For filtering by environment
  scrape: high-priority     # Indicates monitoring urgency (optional)
With this, PodMonitor can easily find the right pods, especially in large clusters with many teams or workloads.
2. Secure Your Metrics Endpoints
By default, most endpoints are exposed. That might be okay in development, but in production, anyone with access to your cluster network could scrape sensitive data from them. If your metrics include things like request URLs, user info, or internal resource usage, you should:
- Limit access to trusted IPs or namespaces
- Use authentication or TLS if needed
- Avoid exposing metrics externally unless it is required
PodMonitor itself doesn’t handle security, but you can secure the endpoint it targets.
3. Keep Your Metrics Endpoints Lightweight
Prometheus scrapes your pods on a regular schedule, maybe every 15 to 30 seconds. If your endpoint is slow, that can slow down your app and overload your pods. To avoid that, make sure your app’s metrics endpoint:
- Only includes useful metrics
- Doesn’t do too much work each time it’s scraped
- Reuses data if possible instead of recalculating everything.
Conclusion
So far, we’ve talked about the major roles Prometheus PodMonitor plays in Kubernetes monitoring. We’ve also discussed why monitoring pods is important. The cool thing is you don’t need extra services when monitoring with PodMonitor; you can monitor the pods directly.
If you’re just getting started with Kubernetes monitoring, PodMonitor is a great way to begin. And if you’re already using it, try Middleware for an easy-to-use dashboard and smart alerts.
FAQs
What is PodMonitor?
PodMonitor is a tool from the Prometheus Operator that helps you monitor Kubernetes pods by finding them through labels or namespaces. It makes it easy to collect metrics without extra setup.
How can I configure a PodMonitor to Scrape Metrics from Kubernetes Pods?
First, you define a PodMonitor YAML by specifying the pods to monitor using label selectors, ports, and scrape intervals.
Apply the configuration using kubectl apply -f podminotor.yaml
Finally, verify by checking the Prometheus UI (/targets) to confirm pods are being scraped.
What is the Difference Between PodMonitor and ServiceMonitor in Prometheus?
PodMonitor scrapes metrics directly from pods, while ServiceMonitor scrapes metrics via Kubernetes Services.
Can I use PodMonitor without Prometheus Operator?
No, PodMonitor is a custom resource provided by the Prometheus Operator. So, you’ll need the operator to use PodMonitor.
What are the Best Practices for using PodMonitor in Production Environments?
Use meaningful labels to target pods
Limit scrape intervals to avoid overloading Prometheus
Secure metrics endpoints with TLS or authentication
Monitor PodMonitor itself to ensure metrics are being collected.


