System monitoring is no longer a luxury, it’s a necessity. With infrastructure spread across platforms and constant changes, understanding your tech stack is critical. Whether you’re using Prometheus, Grafana, or Middleware, the right monitoring can mean the difference between smooth operations and costly downtime. But with so many options, how do you choose the right one?
When it comes to observability, Prometheus vs Grafana vs Middleware are top contenders. Each offers unique strengths and trade-offs, especially when considering the hidden costs of open-source tools. Comparing them will help you make a smarter, cost-effective decision for your organization.
What to Look for in a Monitoring Solution
Before we jump into specific tools, let’s think about common aspects of monitoring solutions. While it varies based on your use case, there are certainly some common ground.
Data Collection Capabilities
- Metrics collection: How well does it gather numerical data points over time?
- Log management: Can it collect and make sense of text-based logs from different sources?
- Distributed tracing: Does it follow requests as they move through distributed systems?
Visualization and Analysis
- Dashboard capabilities: Are the visualization options intuitive and flexible?
- Query language: Is the query language powerful yet accessible for data analysis?
- Alerting functionality: How sophisticated are the alerting mechanisms?
- Cross-data correlation: Can it connect dots across metrics, logs, and traces?
Operational Considerations
- Ease of deployment: How quickly can you get it up and running?
- Maintenance requirements: How much ongoing work does it need?
- Scalability: How does it handle growing data volumes and infrastructure?
Business Factors
- Total cost of ownership: What are you really paying, directly and indirectly?
- Time to value: How quickly can you start getting useful insights?
- Integration capabilities: How well does it play with your existing tech stack?
Prometheus vs Grafana vs Middleware: Comparison
Now let’s look at each of the three main contenders.
Prometheus
Prometheus came out of SoundCloud back in 2012 and has since grown into one of the most widely used open-source monitoring tools out there. It eventually became a graduated project under the Cloud Native Computing Foundation (CNCF).
New to Prometheus? Learn how it works and why it’s critical for observability in our beginner-friendly guide.
At its heart, Prometheus is basically a time-series database built to collect and store numerical metrics from your infrastructure and apps. It uses a pull-based approach, where the server grabs metrics from instrumented targets at regular intervals.
Key Features
- Dimensional data model letting you identify metrics by key-value pairs called labels
- Powerful query language (PromQL) for flexible data analysis and alerting
- Service discovery to automatically detect and monitor new instances
- Built-in alerting with Alertmanager for routing notifications
- Self-contained architecture without distributed storage or complex clustering
🔍Want to know how Prometheus works? Discover how Prometheus collects, stores, and queries metrics efficiently.
Strengths
- Prometheus really shines in dynamic, container-based environments. Its service discovery can automatically spot and monitor new instances as they spin up, making it perfect for Kubernetes and similar platforms.
- The system is built for reliability, with each server working independently. There’s no distributed storage or complex clustering to manage, which means fewer moving parts that could break.
- This self-contained design also makes horizontal scaling relatively straightforward.
- Companies running microservices architectures get particular benefits from Prometheus. Its multidimensional data model and powerful query capabilities make it possible to monitor complex service interactions.
For a detailed exploration of Prometheus metrics and best practices, read our article on Collecting, Analyzing & Visualizing Prometheus Metrics.
Limitations
Despite its strengths, Prometheus has its drawbacks.
- The learning curve can be pretty steep, especially for teams new to modern monitoring systems.
- PromQL, while powerful, takes time to master, and setting up effective alerting rules requires both system knowledge and operational experience.
- Prometheus also struggles with long-term storage.
- By design, it focuses on recent data and isn’t great for long-term historical analysis. While solutions like Thanos and Cortex exist to help with this limitation, they add complexity to the overall setup.
- Visualization is another weak spot for Prometheus alone. Its built-in expression browser works but is pretty basic, lacking the polished dashboards that teams expect nowadays. This weakness is exactly why Prometheus is often paired with Grafana.
Pricing
Prometheus is free and open-source under the Apache 2.0 License. But as we’ll see later, the hidden costs of implementation and maintenance can add up quickly.
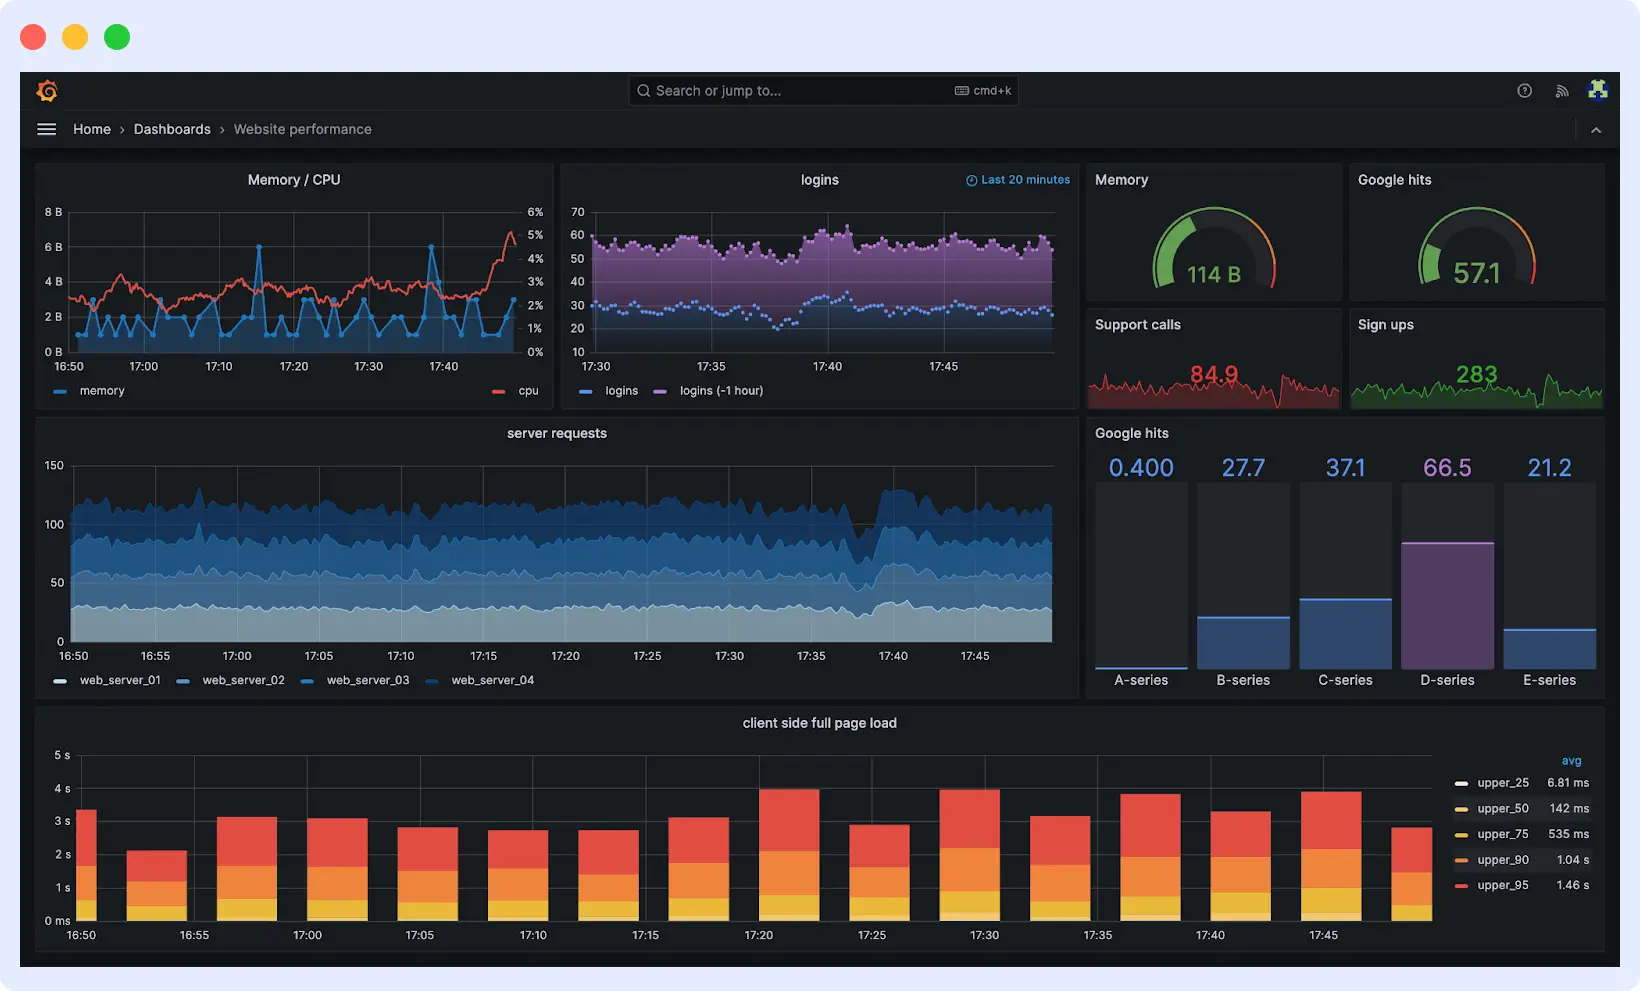
Grafana
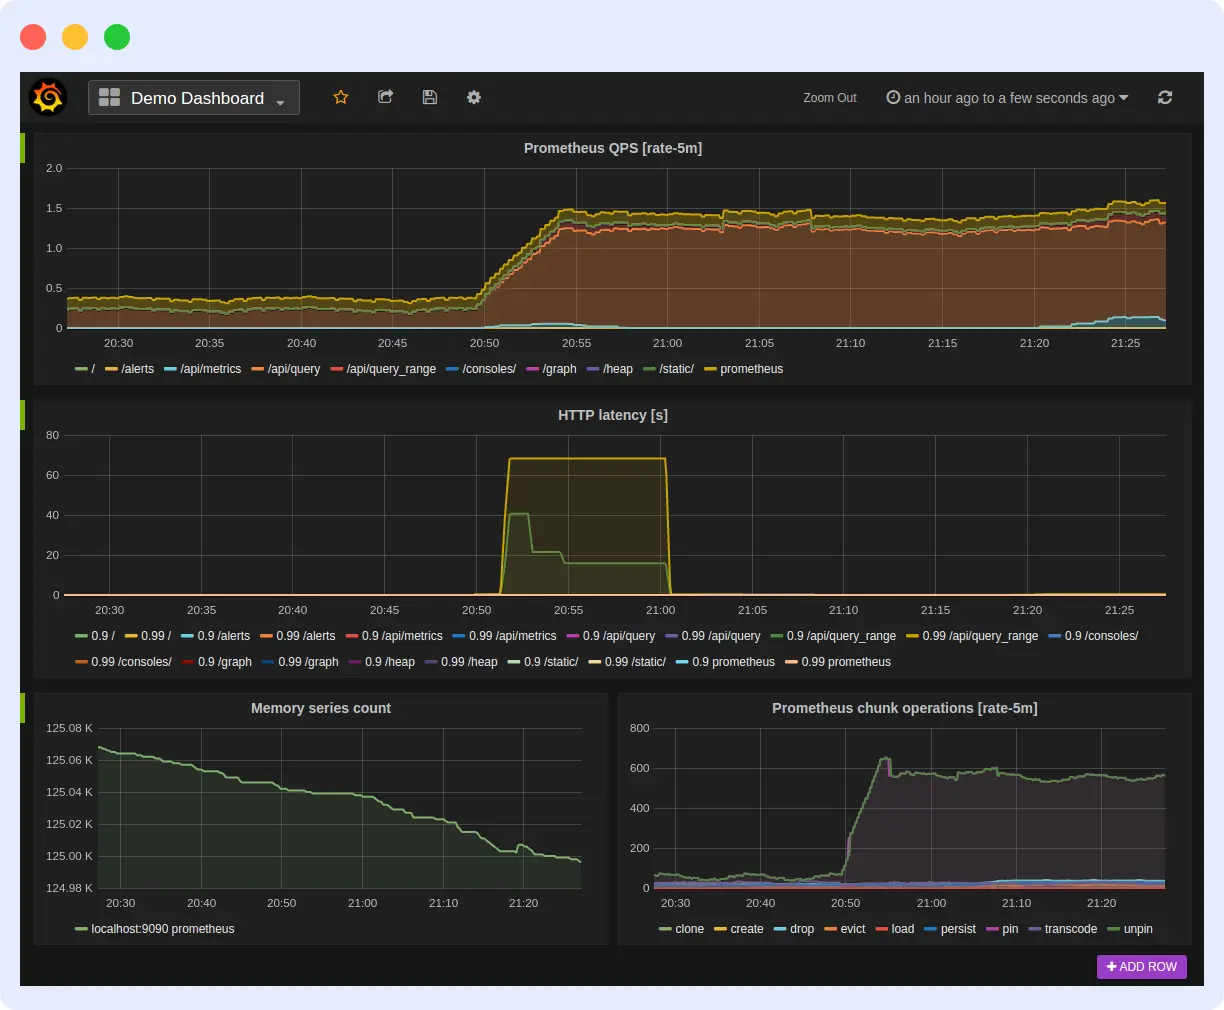
If Prometheus is the mind of your monitoring environment, gathering and processing metrics, then Grafana is the face – taking complex data and making it beautiful, actionable insights. Openly developed as an open-source project, Grafana has emerged as the de facto standard for visualization across the monitoring universe, with more than 20 million users globally.
Grafana doesn’t collect data itself; instead, it hooks up to various data sources (including Prometheus) and gives you a powerful platform for creating dashboards, visualizations, and alerts.
Key Features
- Beautiful, interactive dashboards that bring data to life
- Multi-source data integration connecting to pretty much any data source
- Rich visualization options including heatmaps, histograms, pie charts, and more
- Collaboration features for sharing and annotating dashboards
- Dynamic variables allowing interactive data exploration
- Alerting capabilities with visual threshold indicators
Strengths
- Grafana shines in cases where data visualization and accessibility are needed. It offers a user-friendly interface for both technical and non-technical decision makers.
- For organizations with diverse technology stacks, Grafana’s ability to unify data from multiple sources is invaluable. Instead of jumping between different monitoring tools, teams can create comprehensive dashboards that provide a single view for all their metrics.
- Grafana also works particularly well for creating executive dashboards and historical trend analysis. Its rich visualization options make it easy to spot patterns and identify anomalies.
Limitations
Despite its visualization prowess, Grafana has important limitations.
- Most significantly, it’s not a data collection tool – it relies entirely on external data sources to function. Without something like Prometheus behind it, Grafana is basically an empty canvas.
- Managing a large number of dashboards can also become challenging over time.
- Without proper governance, organizations often end up with dashboard sprawl – hundreds of dashboards with overlapping purposes.
- While Grafana’s open-source version has plenty of features, some advanced capabilities require a paid subscription to Grafana Enterprise or Grafana Cloud.
See Prometheus vs Grafana: Which Tool Suits Your Monitoring Needs?
Pricing
| Edition | Cost | Key Features |
| Open Source | Free | Basic dashboarding, visualization, and alerting |
| Grafana Cloud | Starts at $49/month | Hosted Grafana with metrics, logs, and traces |
| Grafana Enterprise | Custom pricing | Advanced authentication, reporting, and plugins |
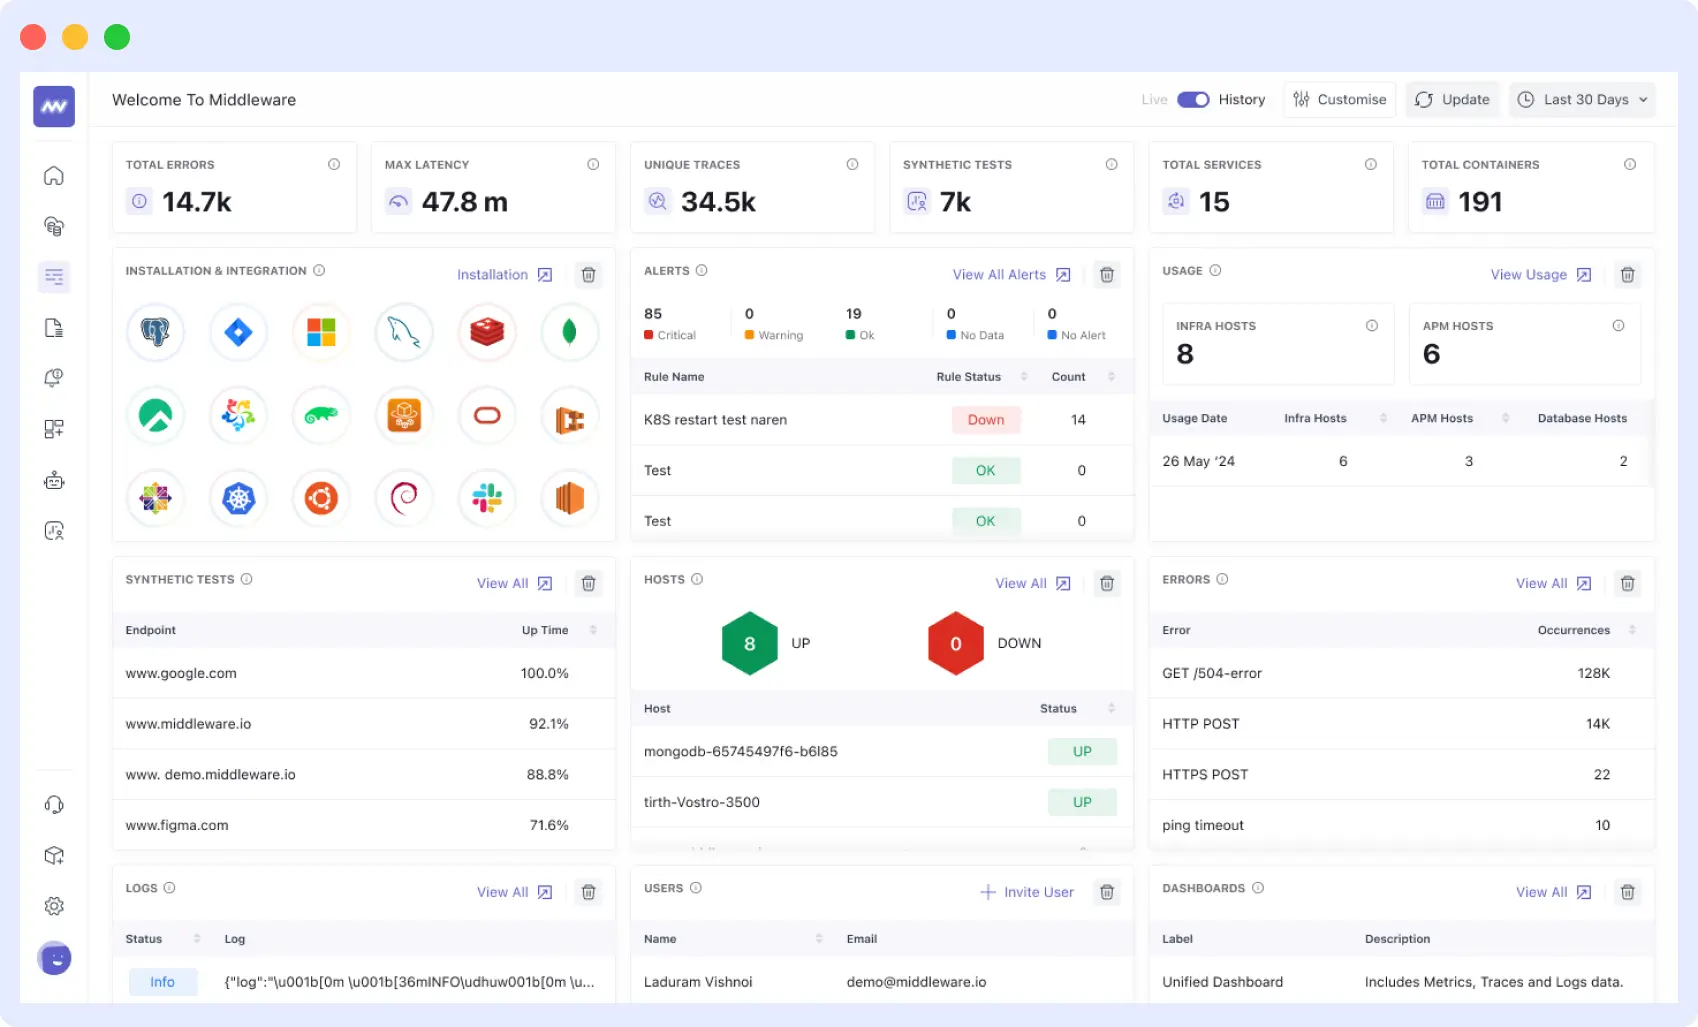
Middleware
While Prometheus and Grafana have become the standard open-source monitoring stack, Middleware offers a compelling alternative – a unified observability platform designed to address many of the limitations and hidden costs associated with DIY open-source solutions.
Middleware brings together metrics, logs, and traces in a single, integrated solution. Unlike the piecemeal approach required with open-source tools, Middleware provides a comprehensive experience out of the box.
Key Features
- Unified telemetry data collection across metrics, logs, and traces
- Complete data ingestion control through feature flags and filters
- Real-time monitoring with continuous data collection
- Automated workflows for streamlined operations
- Comprehensive coverage across your entire tech stack, including metrics monitoring, log analysis, distributed tracing, and infrastructure monitoring
Strengths
Middleware solves many of the pain points that are inherent to using Prometheus and Grafana.
- While open-source solutions involve high levels of setup and configuration, Middleware has an easy onboarding process that has teams operational in minutes, not weeks.
- As opposed to working with various tools for various observability signals, Middleware offers an integrated platform that gathers and correlates all the telemetry data, leaving no integration problems behind.
- Prometheus and Grafana need constant maintenance and updates, whereas Middleware is delivered as a managed service where the provider takes care of all the backend infrastructure.
- The single platform strategy allows for strong correlation between metrics, logs, and traces, which simplifies root cause detection and facilitates quicker issue resolution than is possible with monitoring tools operating in silos. This results in an estimated 20% reduction in time to resolution versus traditional methods.
Limitations
As a proprietary solution, Middleware doesn’t offer the same level of customization as open-source alternatives.
- Organizations with highly specialized monitoring needs might find certain edge cases challenging to address.
- The subscription-based pricing model means ongoing costs that scale with usage, unlike the zero licensing costs of open-source options. However, as we’ll explore in the comparison section, the total cost of ownership often favors Middleware when accounting for all factors.
- There’s also the consideration of vendor lock-in. While Middleware provides comprehensive functionality, organizations become dependent on a single provider for their observability needs.
Pricing
Middleware offers a transparent pricing model based on data ingestion and retention:
| Plan | Starting Price | Key Features |
| Free Tier | $0 | Basic monitoring for small workloads |
| Pay As you Go | $0.3 GB of metrics, logs, traces | Full-featured observability for growing teams |
| Enterprise | Custom pricing | Advanced features, dedicated support, and SLAs |
The Hidden Costs of Open-Source Solutions
When evaluating monitoring options, you’ve got to look beyond the price tag. Open-source solutions like Prometheus and Grafana appear free at first glance, but the total cost of ownership includes several hidden expenses.
Engineering Resources
The largest cost of doing this is in the form of engineering time. Getting a production-ready Prometheus and Grafana environment up and running involves esoteric knowledge and a lot of effort. It’s not just getting it installed initially – it’s about configuring scrape targets correctly, setting up alerting rules, building good dashboards, and having the whole thing be reliable.
Even for experienced teams, this process typically takes weeks or months of dedicated engineering time. Engineers must learn concepts like PromQL, service discovery, and time-series database management – all while handling their existing responsibilities.
Infrastructure Costs
While the software may be free, the infrastructure to run it certainly isn’t. Prometheus and Grafana require servers or cloud resources to operate, and these costs scale with the size of your environment and the volume of metrics being collected.
For high-availability setups – essential for mission-critical monitoring – these costs multiply further. Running redundant Prometheus instances, implementing long-term storage solutions, and ensuring backup systems are in place all add to the infrastructure bill.
Integration Challenges
Another often-overlooked cost comes from integrating multiple tools into a cohesive monitoring solution. While Prometheus and Grafana work well together for metrics, they don’t address logs or traces. Organizations typically need additional tools like Loki for logs and Jaeger or Tempo for distributed tracing.
Every new tool brings with it its own configuration, upkeep, and integration issues. The ability to ensure consistent correlation of data across these platforms is complicated, and the engineers’ mental load grows with every new tool that they must learn.
Comparison: Which Solution Is Right for You?
Now that we’ve examined each solution individually, let’s compare them across key dimensions to help you make an informed decision.
Feature Comparison : Prometheus vs Grafana vs Middleware
| Feature | Prometheus | Grafana | Middleware |
| Primary Function | Metrics collection & storage | Visualization | Full-stack observability |
| Metrics Collection | Excellent | N/A (requires data source) | Very Good |
| Visualization | Basic | Excellent | Very Good |
| Log Management | Not included | Limited (requires Loki) | Excellent |
| Distributed Tracing | Not included | Limited (requires Tempo) | Excellent |
| Alerting | Very Good | Very Good | Very Good |
| Ease of Setup | Limited | Moderate | Excellent |
| Maintenance | Complex | Moderate | Minimal (managed) |
| Scalability | Good (requires effort) | N/A (depends on data source) | Excellent (automatic) |
Choosing the Prometheus vs Grafana vs Middleware for Your Use Case
With a clear understanding of each solution’s strengths and limitations, let’s explore which option might be best for different organizational contexts.
Choose Prometheus + Grafana If:
- You’ve got strong engineering resources with monitoring expertise
- You need highly specialized customization beyond standard offerings
- You’re in a cost-sensitive environment with sufficient technical talent
- You’re deeply committed to open-source philosophy
- You have strict data locality requirements
Choose Middleware If:
- You want to focus on business outcomes rather than monitoring infrastructure
- You need faster time-to-value without lengthy setup
- You’re a growing organization anticipating scaling challenges
- You require unified visibility across metrics, logs, and traces
- You have limited DevOps or SRE resources
- You prefer predictable costs for financial planning
For Different Organization Types
For Developer-Centric Organizations: If your developers already know Prometheus well, the open-source path may align with your existing workflows. But consider the ongoing maintenance burden.
- For Operations-Focused Teams: If your priority is operational efficiency and reducing mean time to resolution, Middleware’s unified approach eliminates context-switching during critical incidents.
- For Growing Organizations: As you scale, the hidden costs of managing Prometheus and Grafana grow significantly. Middleware’s managed approach becomes increasingly valuable as complexity increases.
- For Resource-Constrained Teams: Smaller teams with limited DevOps resources will likely find more value in Middleware’s approach, freeing up scarce engineering time for core business initiatives.
Conclusion
The journey through monitoring and observability solutions reveals a clear distinction between the traditional open-source approach of Prometheus and Grafana and the integrated platform offered by Middleware.
For most organizations, the decision ultimately comes down to a question of focus. If your core business revolves around technology itself, and you have the expertise and resources to manage complex systems, the flexibility of Prometheus and Grafana might be worth the additional overhead. If, however, you view technology as an enabler for your primary business objectives, Middleware’s streamlined approach likely offers the better value proposition.
The true cost of monitoring isn’t measured in dollars alone – it’s measured in the time and focus diverted from your core mission. Choose wisely.