In distributed applications with complex, resource-intensive microservices—each of which generates a mountain of telemetry data—collecting and managing telemetry with your application can be cumbersome and inefficient. It may also lead to CPU consumption and high latency.
OpenTelemetry Collector plays an important role here. It helps you collect, process, and instrument all complex telemetry data.
Read on to learn about the OpenTelemetry Collector, how it works, its benefits, and its deployment methods.
What is OpenTelemetry?
OpenTelemetry (OTel) is an open-source project that provides a set of APIs, libraries, SDKs, and tools for instrumenting applications and generating, collecting and exporting telemetry data (like metrics, traces and logs) to backend systems. These backend systems can include metrics, logging systems, and tracing tools.
OTel spawned out of the OpenTracing and OpenCensus merge with an aim to provide universal observability instrumentation for software apps while creating a unified, vendor-neutral standard for telemetry gathering, processing and collection.
What is the OpenTelemetry Collector, and how does it work?
The OpenTelemetry Collector processes telemetry data from instrumented applications, acting as a vendor-agnostic hub within OTel. It eliminates the necessity for multiple agents, supporting various open-source formats and exporting data to diverse backends within the ecosystem.
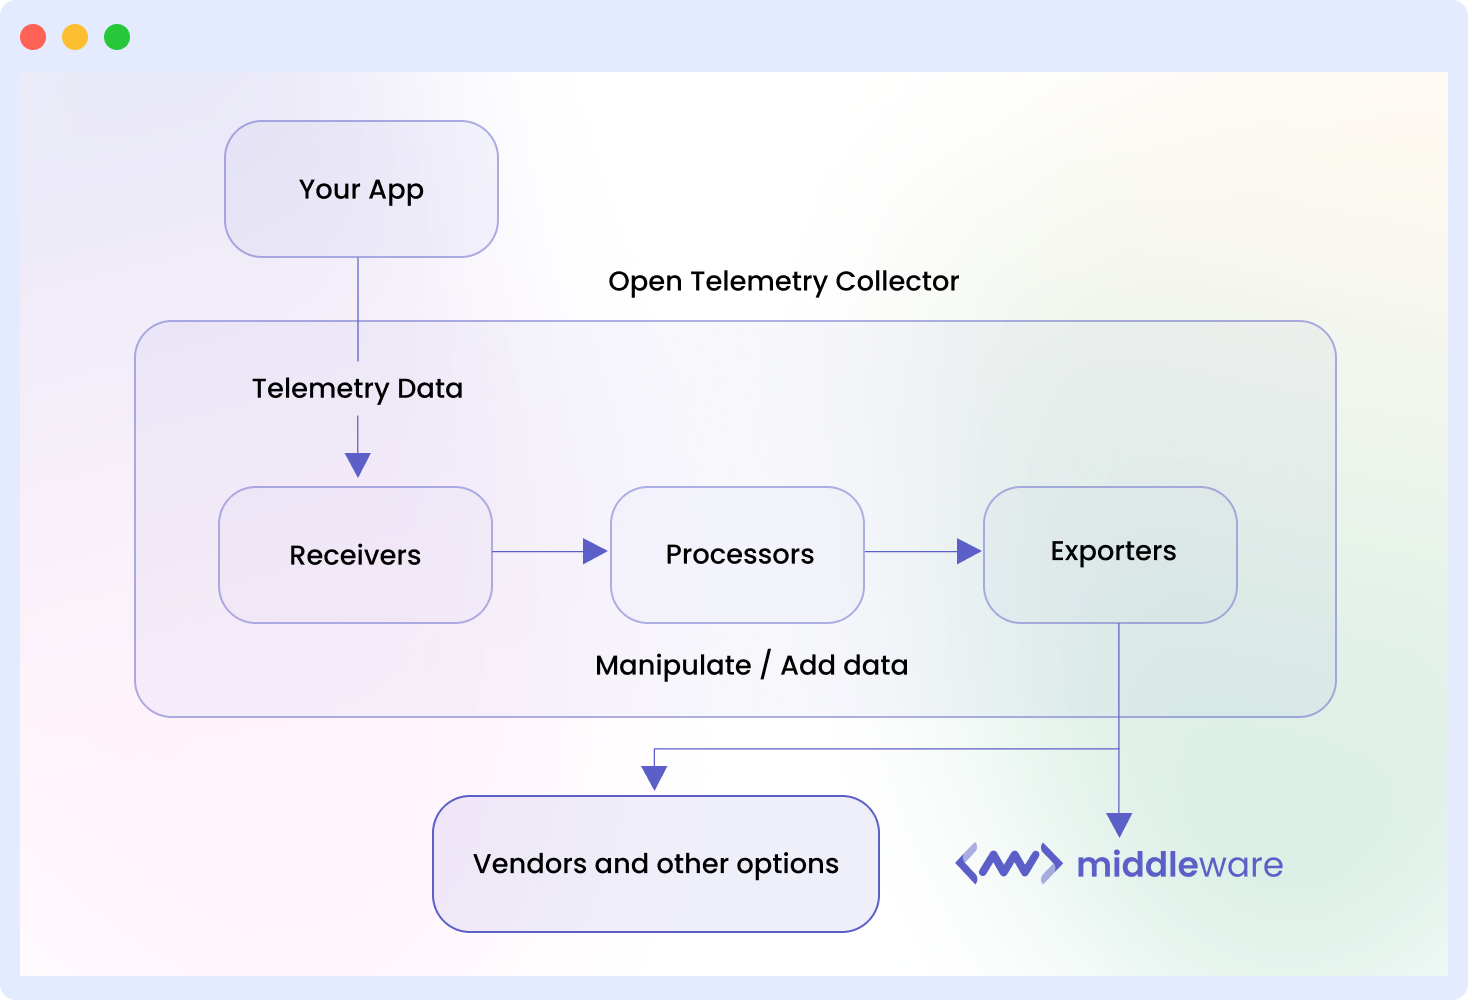
The Otel Collector receives telemetry data from various sources, processes and exports them through one or more pipelines. Each pipeline contains receivers, processors, exporters, and connectors. The Collector filters, aggregates and transforms within the pipeline.
Let’s take a look at the collector’s architecture to see how it works:
Instrumenting applications
Instrumentation is the first step. Instrumented apps are software applications integrated with the OpenTelemetry instrumentation library to generate telemetry data. SDEs can instrument their app manually or automatically.
Manual instrumentation involves adding observability code to the app and then using the OTel SDK to initialize the OTel Collector and the API to instrument the app code. Automatic instrumentation consists in attaching a language-specific agent to the application. The OTel agent used depends on the app’s programming language.
Receivers
This is the first component of the OTel Collector. To be valid, a collector pipeline must have at least one configured receiver. Receivers are responsible for ingesting telemetry data from various sources into the OTel Collector.
They accept telemetry in preconfigured formats, translate it into formats that the OTel Collector can understand, and then send it to processors.
The OpenTelemetry Collector supports over 40 types of receivers, including the OTLP Receiver, which collects telemetry data using the OpenTelemetry Protocol (OTLP), Zipkin, Jaeger, and Prometheus.
Processors
Processors are optional OpenTelemetry Collector Pipeline components used to perform specific tasks on telemetry data.
Where available, telemetry is sent from the receivers to processors. A processor can aggregate metrics, enrich trace data, or apply custom filtering rules.
Processors can be chained together to create a processing pipeline and are used to remove users’ PII from the collected data to enable regulatory compliance.
The OTel Collector supports several processors, three of which are:
- The batch processor for batching telemetry before sending them out.
- The resource detection processor for collecting and identifying the instrumented app’s resource information.
- The attribute processor for adding/modifying span, log or metric attributes for easy contextualization.
Exporters
Processed telemetry data is sent to exporters, which transmits them to desired backends on a pull or push basis.
SDEs can configure different exporters for various backends. Each exporter converts telemetry from the OTLP format to the preconfigured backend-compatible format.
The OpenTelemetry Collector supports various exporter plugins and allows SDEs to customize their data based on your needs and requirements.
Connectors
Connectors function as bridges between components of the telemetry pipelines, allowing each element to communicate with the next.
It serves as an exporter and receiver, consuming bogus telemetry from instrumented apps and summarizing it to identify app behavior issues faster. They can also consume telemetry in one format (e.g., traces from exporters) and produce it in a different format (e.g., converted to metrics for receivers) as required.
It may also be used to control telemetry routing or replicate telemetry across different pipelines.
Simply put, once apps are instrumented using tools and frameworks from the instrumentation libraries, they generate telemetry data. The OTel Collector then receives this data (via the receiver), performs any necessary transformations or filtering (with the processor), and exports it to various backends.
The connector links each stage and converts data from one telemetry type to another where necessary.
Why use OpenTelemetry Collector?
Here are four important reasons to use the OpenTelemetry Collector in your observability environment.
Simplified instrumentation
The OpenTelemetry Collector allows you to separate the instrumentation logic from your applications. This simplifies observability and eliminates the complexity of configuring individual instrumentation points.
Once you instrument your applications with the OpenTelemetry SDK, the Collector handles data collection, transformation, and exporting. This allows you to focus on analyzing and gaining insights from the collected data without worrying about the intricacies of data collection and export processes.
Vendor-agnostic
The OpenTelemetry Collector supports various data formats and backends, enabling you to switch between observability platforms or tools without modifying your applications’ instrumentation. This interoperability and compatibility feature makes it easier to integrate with your existing systems or change platforms in the future.
Performance optimization
The Collector optimizes the telemetry data by filtering or aggregating it before exporting it, thereby reducing telemetry traffic, making it easier to identify and resolve performance issues and improving the overall performance of your monitoring infrastructure.
Flexibility and extensibility
The OpenTelemetry Collector offers a pluggable architecture that allows you to customize and extend its functionalities, such as adding or developing your own exporters, processors, or plugins as required. This flexibility makes it easy for you to adapt the Collector to different use cases.
When to use the OpenTelemetry Collector?
OpenTelemetry Collector can be used in various scenarios. Listed below are some examples:
Distributed applications
In a distributed application, the OTel Collector can be used as a centralized component to collect telemetry data from all microservices and export telemetry data to the desired backends.
Multi-language environments
When working with applications that use different programming languages, the OpenTelemetry Collector is a consistent instrumentation approach. It can be used to standardize telemetry data collection across various languages to enable seamless observability across the entire application stack.
Legacy systems
If legacy systems lack telemetry capability, the OpenTelemetry Collector can retroactively add observability without requiring significant modifications to the existing codebase.
Advanced data processing and filtering
If you need to perform data aggregation, filtering, masking or transformation, the Collector’s flexible processing capabilities allow you to tailor the telemetry data to your specific needs.
Vendor-neutral instrumentation
If you are building an application that needs to work with different observability platforms or tools, using the OTel Collector ensures vendor neutrality.
Real World Example
At the recent Open Source Summit North America, Chris Featherstone and Shubhanshu Surana stated that they use OTel Collector to track massive amounts of observability data their company collects, including metrics—330 million unique series a day, span data of 3.6 terabytes a day, and log data of over 1 petabyte a day.
Adobe implemented OpenTelemetry Collector in 2020, starting with trace ingestion and expanding to include metrics in 2021, with plans for log data integration.
Instrumentation played a pivotal role in Adobe’s strategy, with a focus on auto-instrumentation, primarily in Java, using OpenTelemetry libraries. The team used custom extensions and processors, managing configurations through GitOps.
The dynamic nature of the OTel collector, which extends data to multiple destinations, earned it the moniker “Swiss Army knife of observability” in Adobe’s toolkit.
Adobe boosted operational efficiency through configuration management using Git, alongside the adoption of OpenTelemetry Operator Helm charts for infrastructure use cases.
Auto-instrumentation using OpenTelemetry Operator significantly streamlined the process, allowing engineers to instrument services automatically and marking a notable enhancement in developer productivity.
Furthermore, Adobe implemented data management and enrichment processes to handle the vast amounts of observability data. Reduction and custom processors in the OpenTelemetry Collector facilitated the enrichment and elimination of sensitive information.
Adobe employed a unique service registry to prevent service name collisions, ensuring each service’s unique identification in the tracing backend.
In terms of data distribution, the OTel Collector proved instrumental in sending data to multiple export destinations, simplifying the process for engineering teams accustomed to different processes and libraries.
Looking forward, Adobe outlined several key initiatives. Firstly, a focus on improving data quality involves eliminating unnecessary data and implementing rules to limit spans at the edge.
Secondly, rate limiting spans at the edge aim to manage the substantial data volume efficiently. Adobe envisions the shift towards trace-first troubleshooting to accelerate issue resolution within its intricate service ecosystem.
As Adobe explores further integration, including OpenTelemetry logging libraries with core application libraries, running OTel collectors as sidecars, and building trace sampling extensions at the edge, the OpenTelemetry Collector remains a crucial component in their evolving observability practices.
OpenTelemetry Collector deployment methods
The OpenTelemetry Collector can be deployed using any of the following three methods.
Standalone deployment
In a standalone deployment, the OpenTelemetry Collector is deployed as a separate process consisting of one or more instances of the Collector.
Distribute the load among all available collector instances using a load balancer to ensure reliable telemetry collection in standalone deployments. Standalone deployment allows SDEs to allocate dedicated resources specifically for the Collector.
It also allows for the independent management of the collector, making it easier to update or scale as per requirement. However, this method prevents the Collector from having full visibility into the state of the system. Standalone Collectors can be run on any host or in a containerized environment, such as Docker or Kubernetes.
Deploy the Collector as a standalone process by using the Docker image or binary distribution provided on the official OpenTelemetry website. To configure the collector by using a YAML configuration file, run the following command:
Sidecar deployment
In a sidecar deployment, the OpenTelemetry Collector is deployed alongside your application as a separate container or process.
Each microservice in your app will have a specific Collector instance, and a local host connects all instances. The collector collects telemetry data directly from the application and exports it to the desired backends.
An advantage of this method is the Collector’s improved visibility into the state of the system.
With a sidecar deployment, SDEs can encapsulate the telemetry collection logic within the Collector, reducing the complexity of their application code.
It also provides isolation between the telemetry collection and the application, making it easier to add or remove instrumentation without modifying the application itself.
Configure the sidecar deployment using the following code:
`yaml
version: '3.8'

services:
  my-app:
    image: my-app-image:latest
    ports:
      - 8080:8080
  otel-collector:
    image: otel/opentelemetry-collector
    volumes:
      - ./config.yaml:/etc/otel/config.yaml
    depends_on:
      - my-app
Agent deployment
The OpenTelemetry Collector is embedded within an existing monitoring agent or agent framework in an agent deployment. This deployment method provides a unified solution for monitoring and telemetry data collection.
The agent utilizes existing infrastructure and monitoring tools to collect and export telemetry data. This approach consolidates data collection and reduces the complexity of managing separate components for monitoring and telemetry collection.
Configure the collector by extending the agent’s configuration file or utilizing specific configuration properties provided by the agent framework.
Here’s a sample configuration file for the agent with an embedded OpenTelemetry Collector.
 yaml
agent:
  collectors:
    telemetry:
      otel:
        config:
          receivers:
            otlp:
              protocols:
                grpc:
          exporters:
            jaeger:
              endpoint: http://jaeger:14268/api/traces
          processors:
            batch:
              timeout: 1s
Here is a sample application code for an agent deployment with an embedded OpenTelemetry Collector using Python:
`python
from opentelemetry import trace
from opentelemetry.exporter.otlp.trace_exporter import OTLPSpanExporter
from opentelemetry.sdk.trace import TracerProvider
from opentelemetry.sdk.trace.export import BatchSpanProcessor

# Initialize the agent with an embedded OpenTelemetry Collector
agent_config = {
    # Specify the agent configuration
    "config": ""
}

agent.init_agent(agent_config)

# Configure the OpenTelemetry SDK
provider = TracerProvider()
trace.set_tracer_provider(provider)

# Configure the OTLP exporter
exporter = OTLPSpanExporter(endpoint="http://localhost:4317")
span_processor = BatchSpanProcessor(exporter)
provider.add_span_processor(span_processor)

# Your application code here
Ensure your `config.yaml` file is properly configured and adjust paths, image names, and ports based on your specific setup.
Agent deployments are secure, flexible and efficient for telemetry collection. Agents can be configured to operate within set boundaries to avoid security breaches.
They can be configured to work with other tools or customized as required. Since they do not run on multiple collector instances and are lightweight, they consume very minimal system resources.
Connecting OpenTelemetry Collector with Middleware
Middleware is an AI-powered monitoring and observability platform that allows developers to visualize and analyze collected telemetry data.
Connecting OTel Collector with Middleware
- To connect the OpenTelemetry Collector with Middleware, create an account or log in to Middleware.
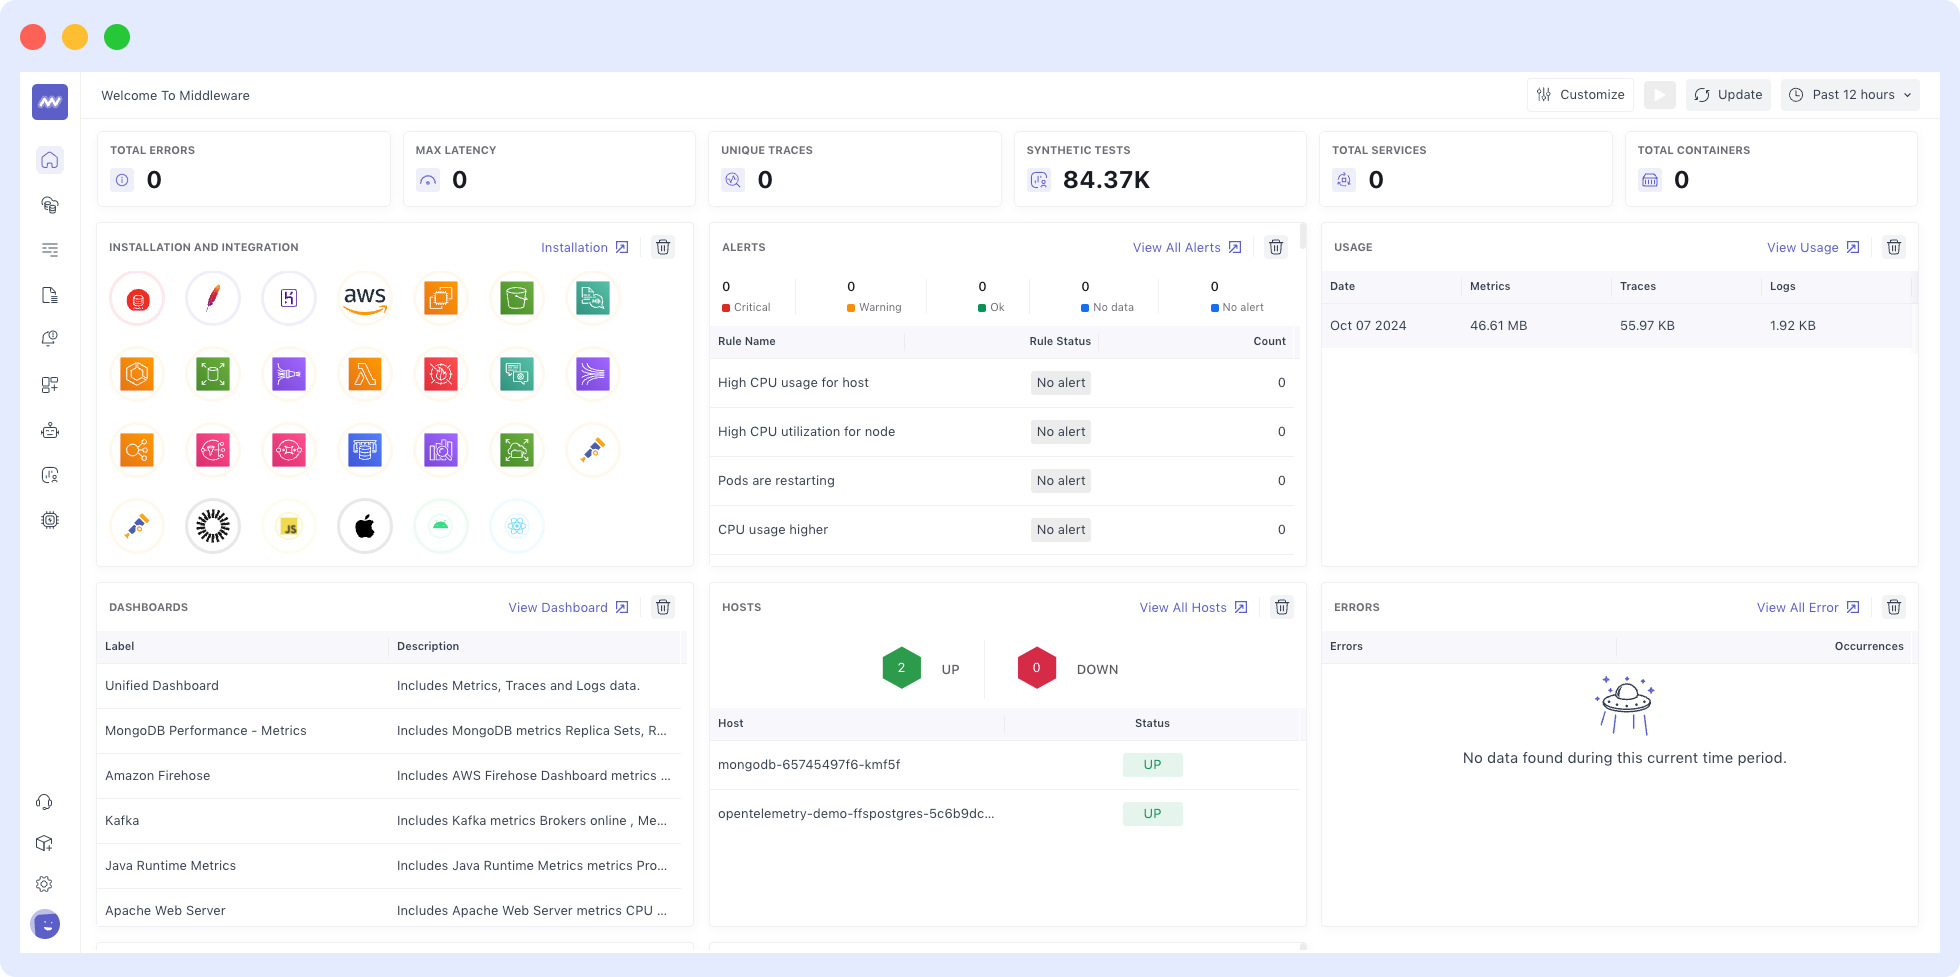
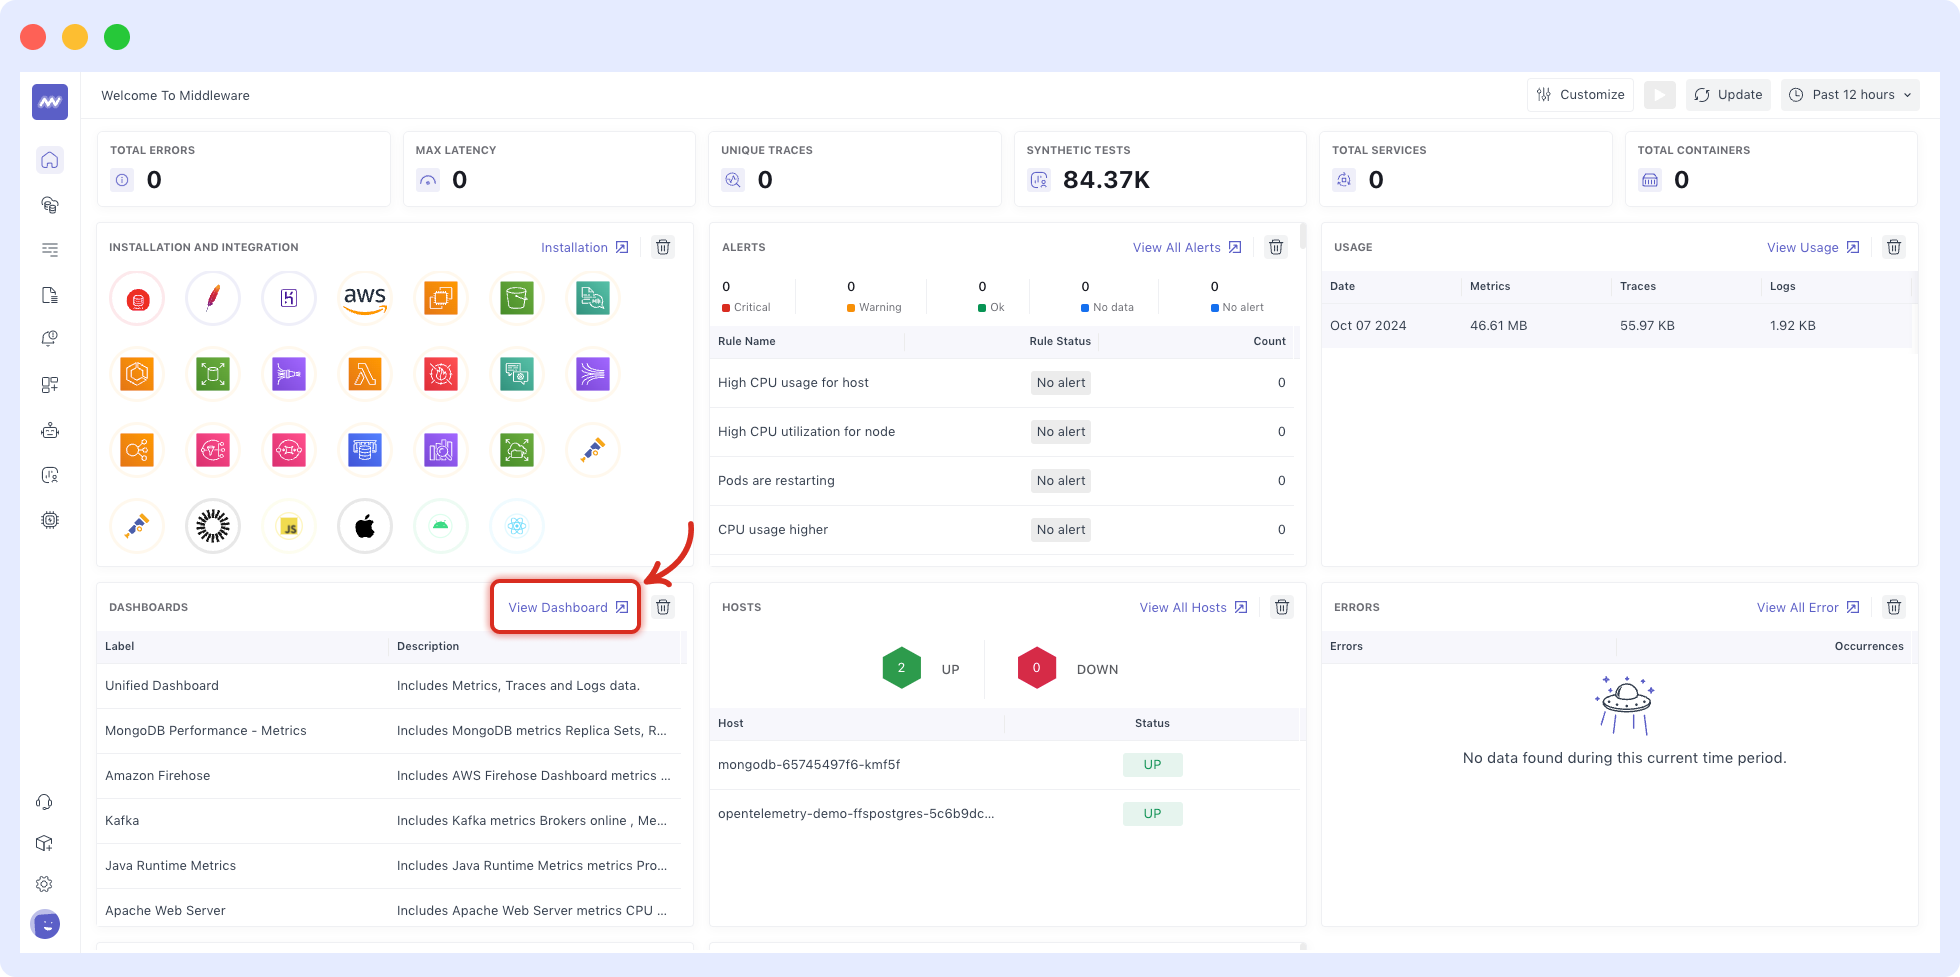
You will start on the unified view dashboard once you have logged in:
2. Navigate to the installation page in the bottom left corner to Install the Middleware agent (MW Agent) on your host infrastructure and begin to explore your data.
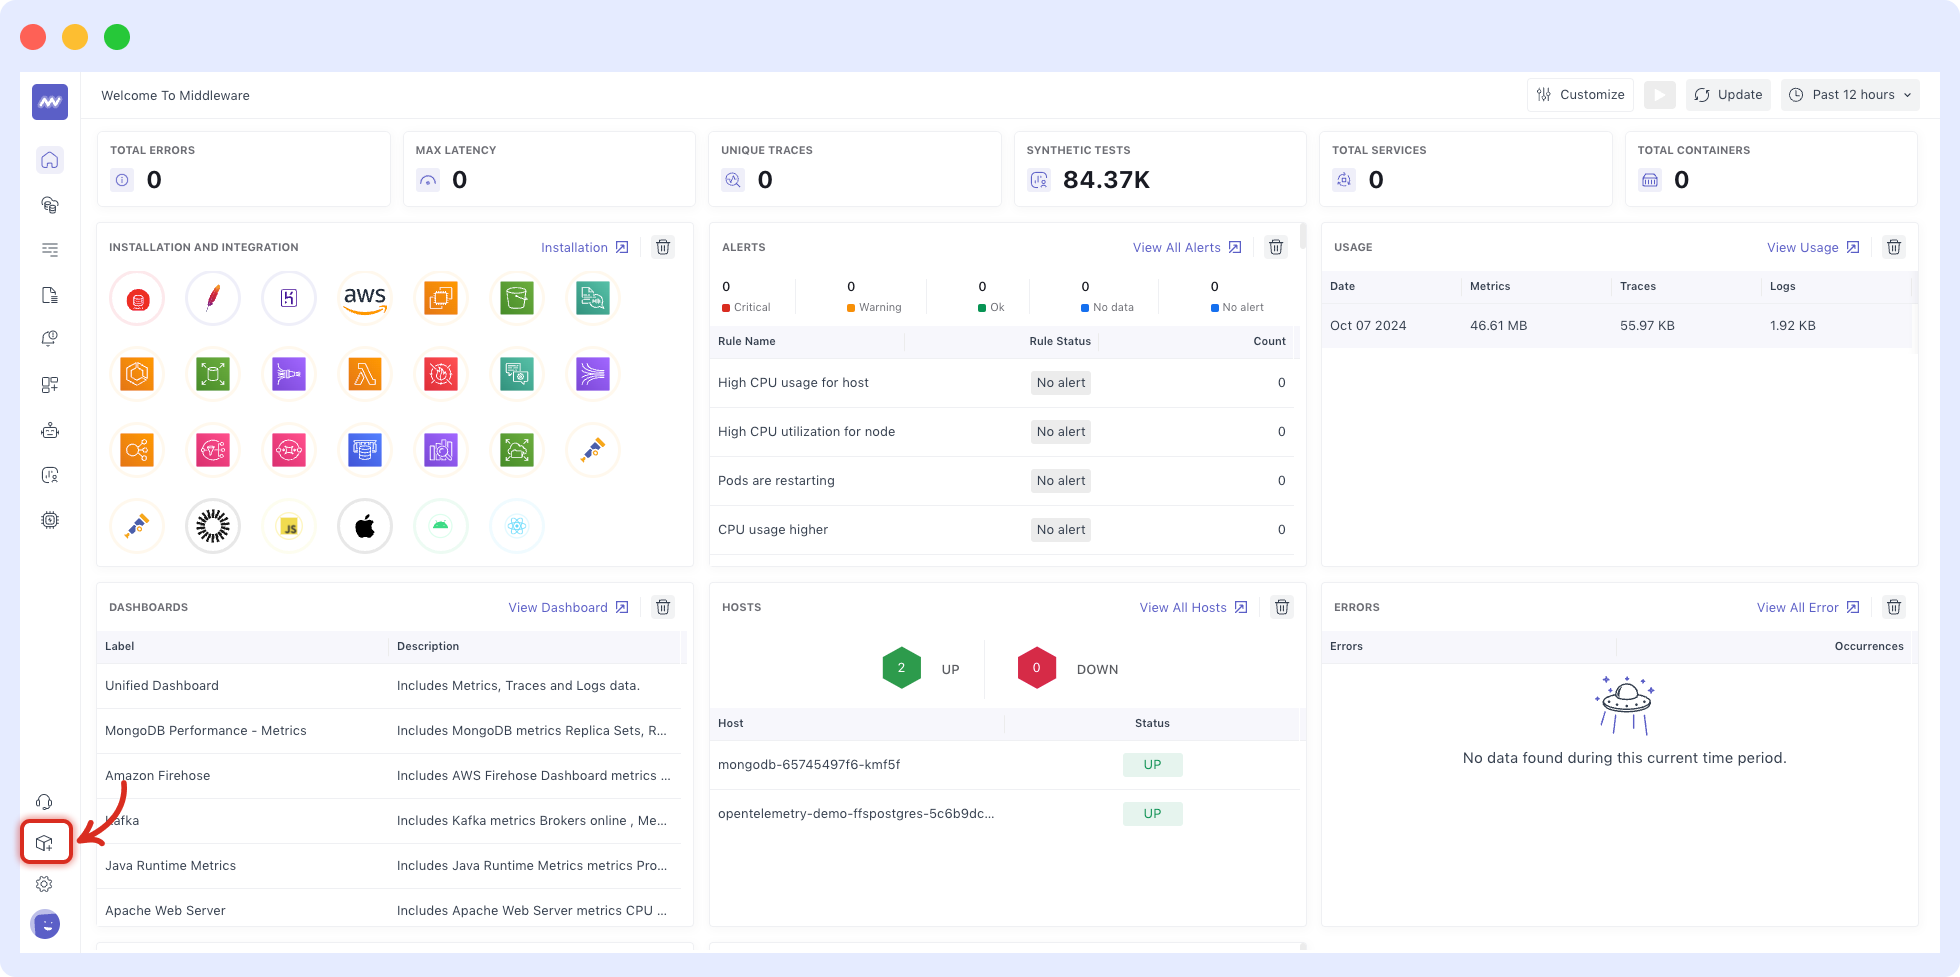
The MW Agent is a lightweight software that runs on your host infrastructure, collecting and sending events and metrics to Middleware. It collects real-time data at the system and process levels to provide detailed insights into host performance and behavior.
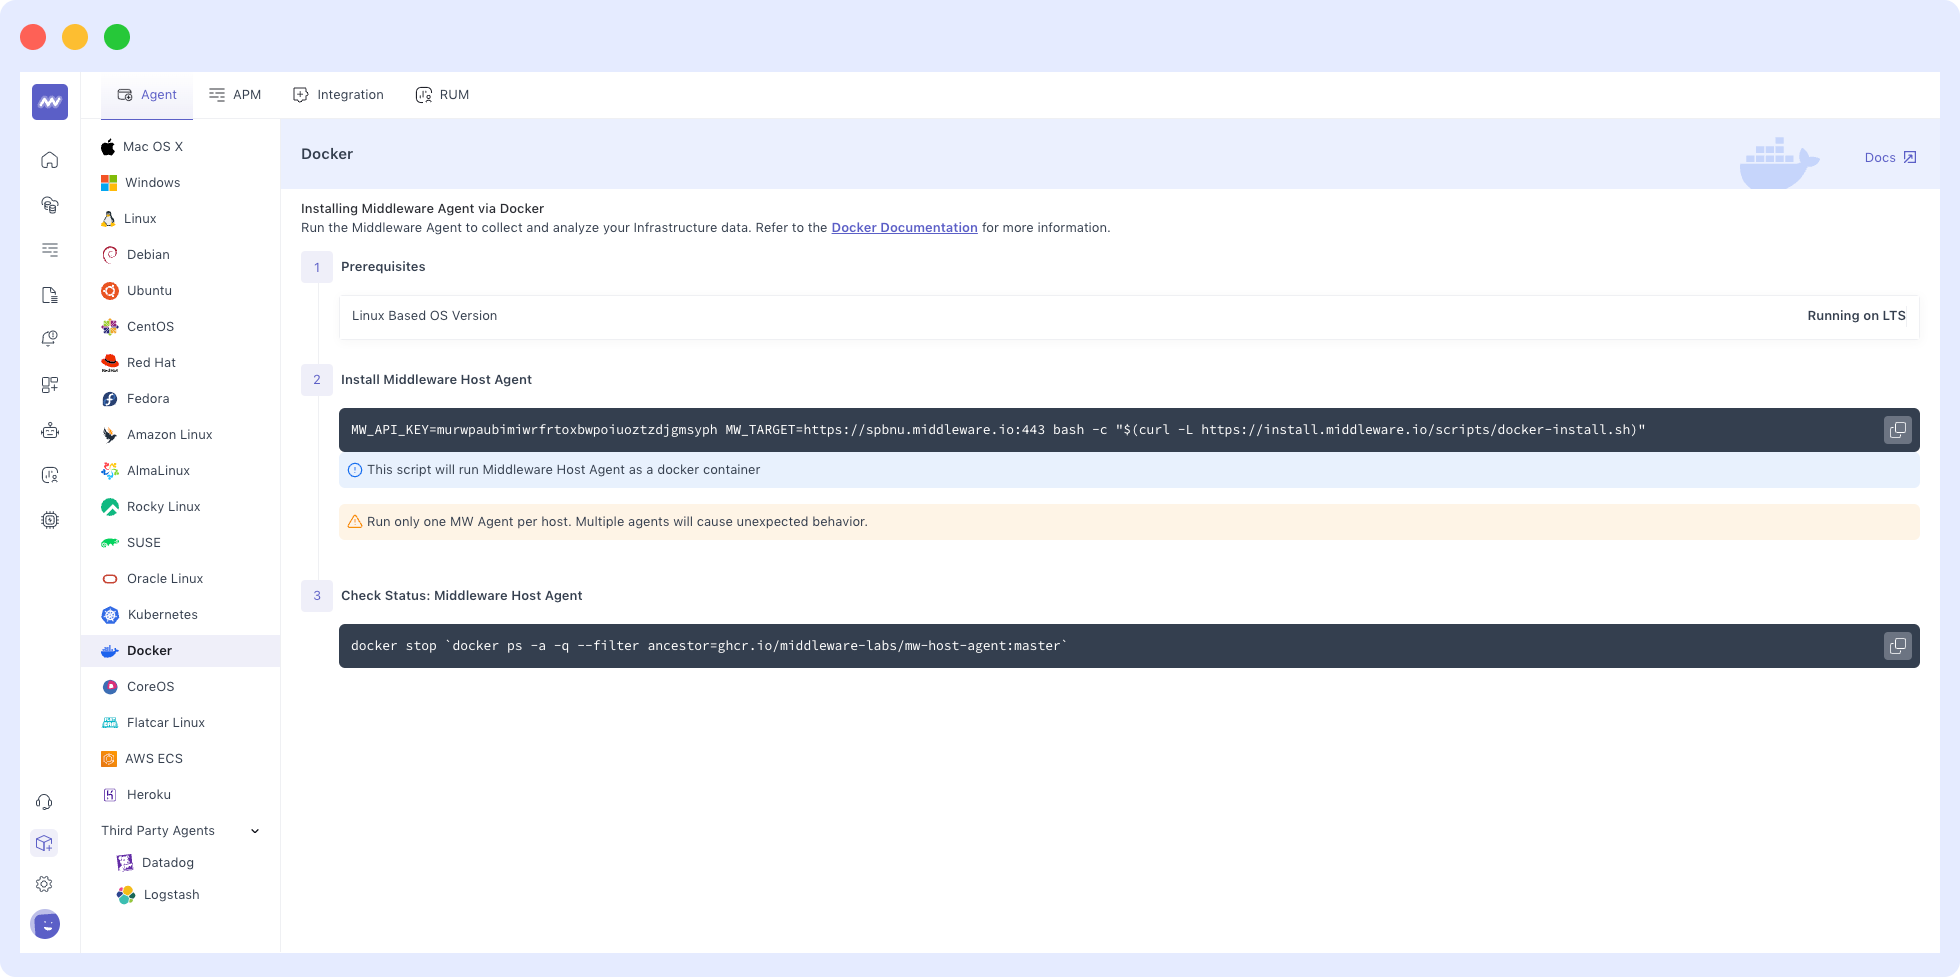
3. Copy and run the installation command. If you’re using docker, run the command example below. Copying the command directly from the installation page ensures your API key and UID are accurately inputted.
Check our documentation for installation commands for other environments such as Windows, Linux, etc.
MW_API_KEY= MW_TARGET=https://.middleware.io:443 bash -c "$(curl -L https://install.middleware.io/scripts/docker-install.sh)"
4. Verify the status of the MW Agent with the following command.
A successful installation returns the status ‘Up’ or ‘Exited’. If the installation is unsuccessful, the status will be blank.
Configuring Middleware’s OTel Data Injection API
- Configure custom metrics using OpenTelemetry and the Middleware data ingestion API.
The OpenTelemetry Ingestion API has two endpoints: metrics and logs. For both endpoints, the resource type attribute groups the ingested data under the specified label on Middleware dashboards and reports.
- The Metrics endpoint lets you send custom metrics to the Middleware backend. To send custom metrics to Middleware, POST to the following endpoint.
POST https://<UID>.middleware.io/v1/metrics- Navigate to OpenTelemetry Metrics to view the following example of a curl request sending a custom metric, swap-usage, to Middleware.
 curl -X POST  "https://demo.middleware.io/v1/metrics" \
-H "Accept: application.json" \
-H "Content-type: application.json" \
-d @ << EOF
{
    "resource_metrics": [
        {
            "resource": {
                "attributes": [
                    {
                        "key": "mw.account_key",
                        "value": {
                            "string_value": "xxxxxxxxxx"
                        }
                    },
                    {
                        "key": "mw.resource_type",
                        "value": {
                            "string_value": "custom"
                        }
                    }
                ]
            },
            "scope_metrics": [
                {
                    "metrics": [
                        {
                            "name": "swap-usage",
                            "description": "SWAP Usage",
                            "unit": "bytes",
                            "gauge": {
                                "data_points": [
                                    {
                                        "attributes": [
                                            {
                                                "key": "device",
                                                "value": {
                                                    "string_value": "nvme0n1p4"
                                                }
                                            }
                                        ],
                                        "start_time_unix_nano": 1673435153000000000,
                                        "time_unix_nano": 1673435153000000000,
                                        "asInt": 400500678
                                    }
                                ]
                            }
                        }
                    ]
                }
            ]
        }
    ]
}
EOF
4. There are two components for metrics: metadata and datapoint. The metadata fields are attributes that define the metric and determine how it will appear in Middleware. The datapoint fields are defined within the data attribute. The datapoint fields are consistent across all data attribute types and can be Gauges, Sums, Histograms or Summaries.
5. The Logs endpoint lets you send custom logs to the Middleware backend. To send custom logs to Middleware, POST to the following endpoint.
POST https://<UID>.middleware.io:443/v1/logs6. Navigate to OpenTelemetry Logs to view the following example of a curl request sending custom logs to Middleware.
`
curl -X POST  "https://demo.middleware.io:443/v1/logs" \
-H "Accept: application/json" \
-H "Content-type: application/json" \
-d @- << EOF
{
   "resource_logs": [
      {
         "resource": {
            "attributes": [
               {
                  "key": "mw.account_key",
                  "value": {
                     "string_value": "xxxxxxxxxx"
                  }
               },
               {
                  "key": "mw.resource_type",
                  "value": {
                     "string_value": "custom"
                  }
               },
               {
                  "key": "service_name",
                  "value": {
                     "string_value": "nginx-123"
                  }
               }
            ]
         },
         "scope_logs": [
            {
               "log_records": [
                  {
                     "severity_text": "WARN",
                     "body": {
                        "string_value": "upstream server not accepting request"
                     },
                     "severity_number": "11",
                     "attributes": [
                        {
                           "key": "server",
                           "value": {
                              "string_value": "nginx"
                           }
                        }
                     ],
                     "time_unix_nano": "1694030143000"
                  }
               ]
            }
         ]
      }
   ]
}
EOF
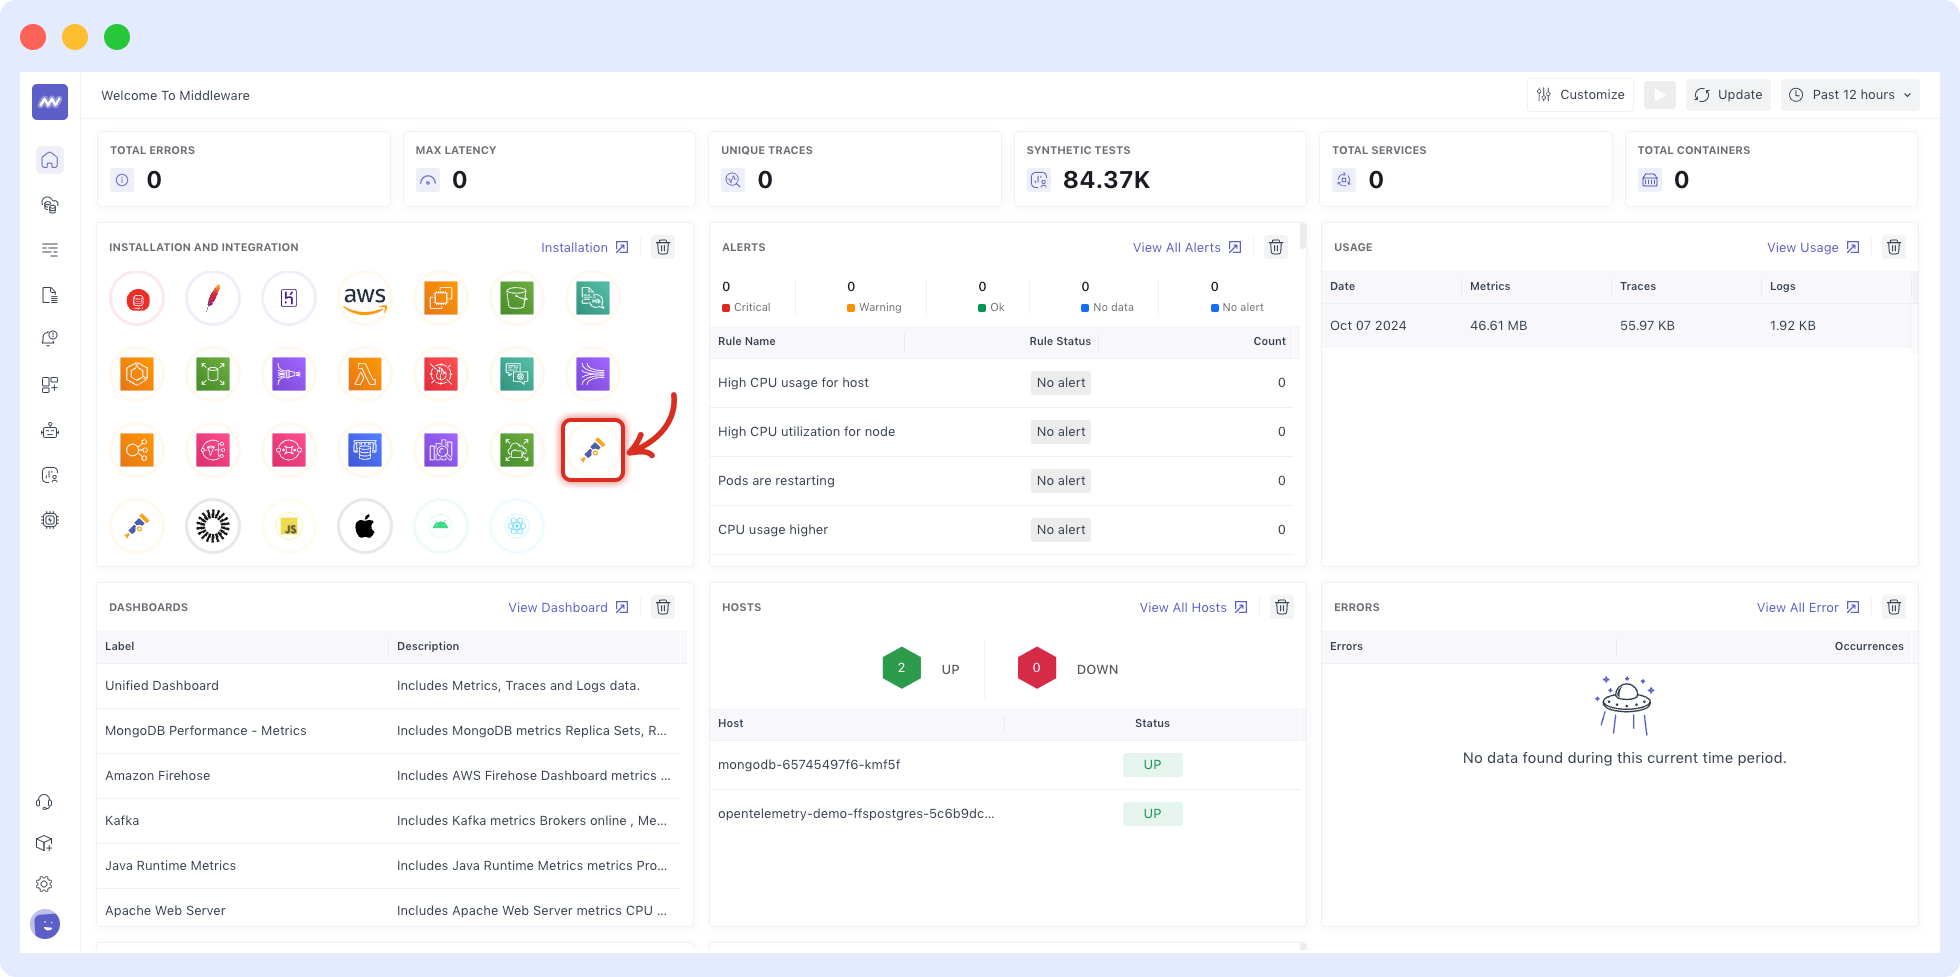
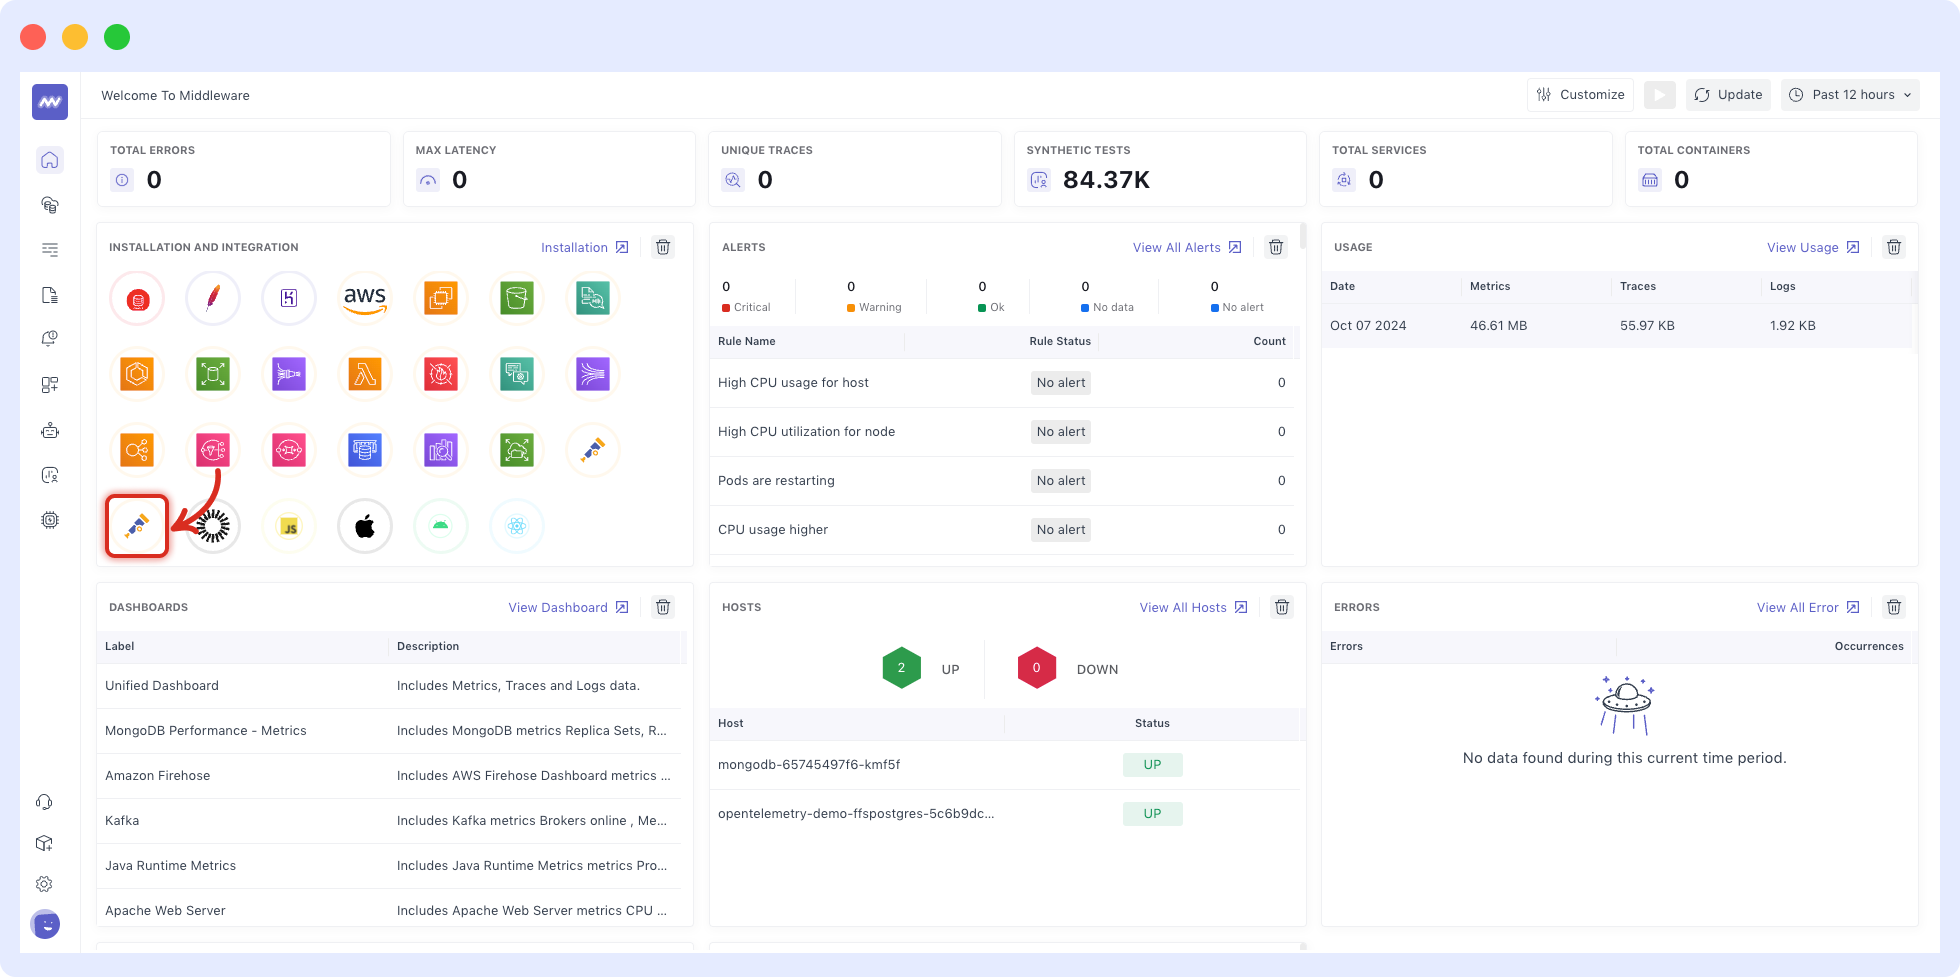
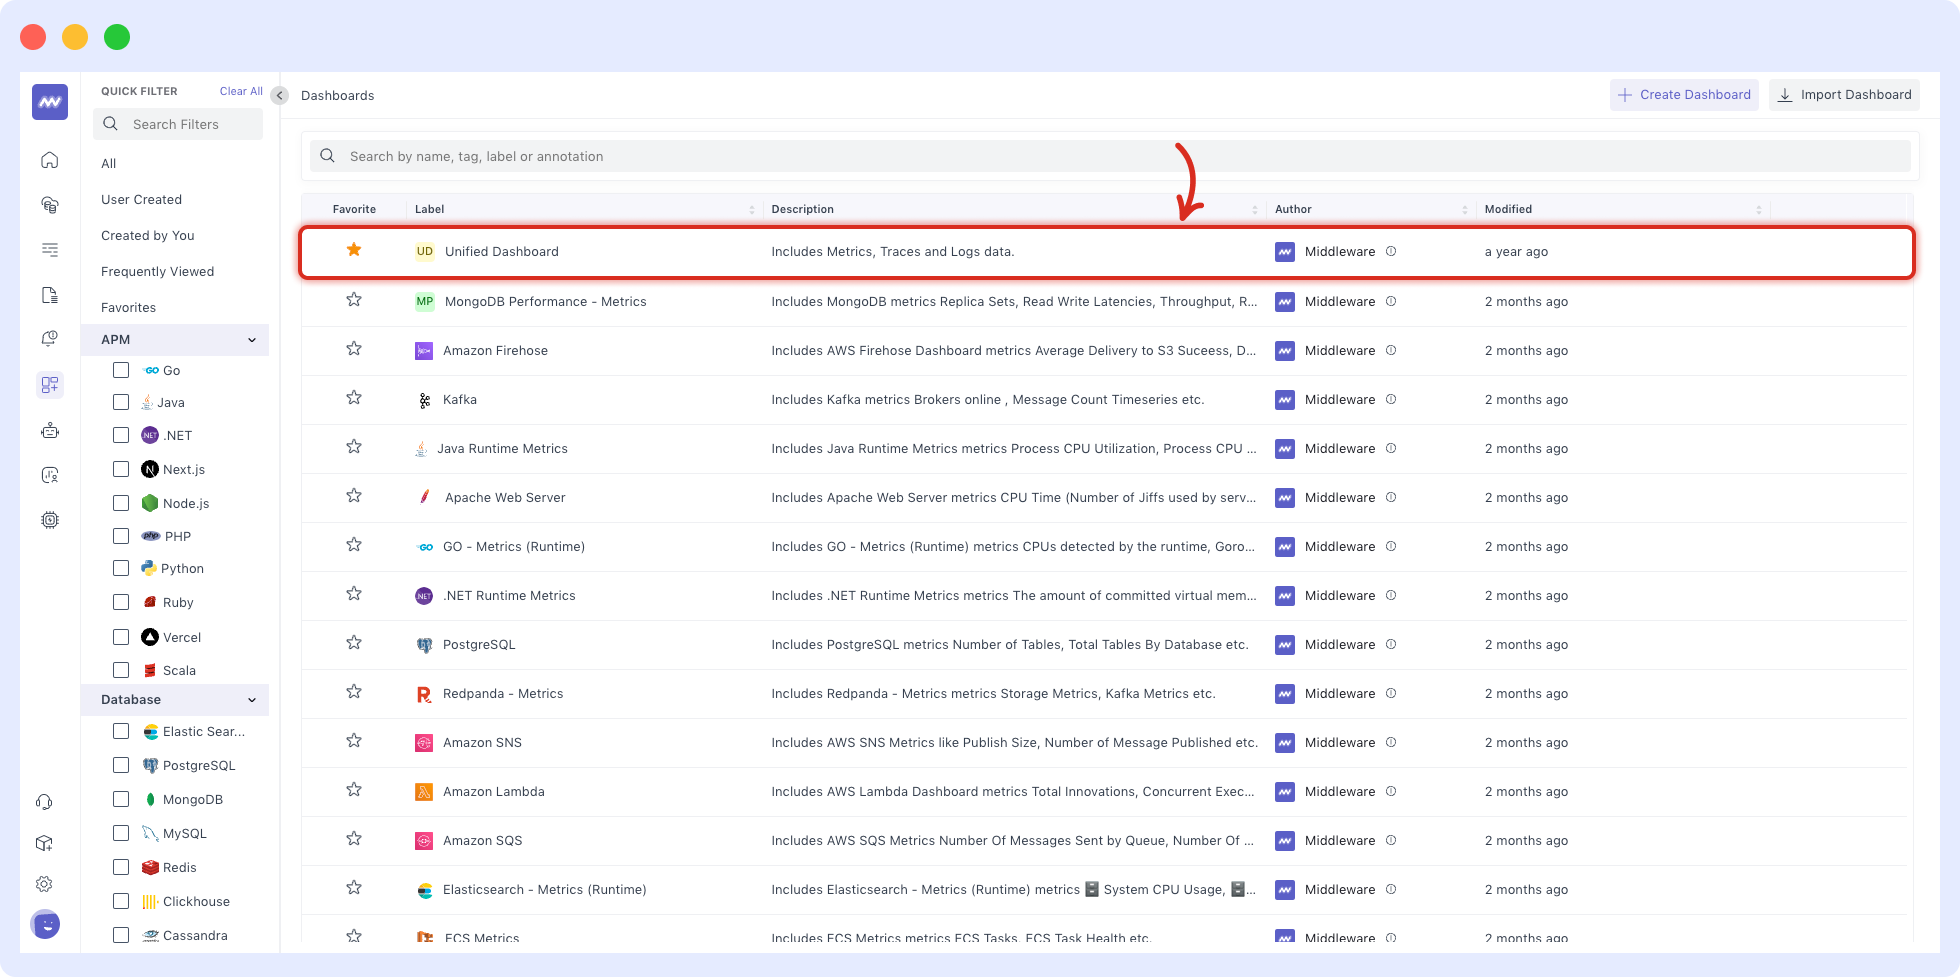
7. Navigate to the Middleware app’s homepage and scroll to “view dashboard.” Click on it to ensure metrics, traces, and logs are appearing in the Unified Dashboard.
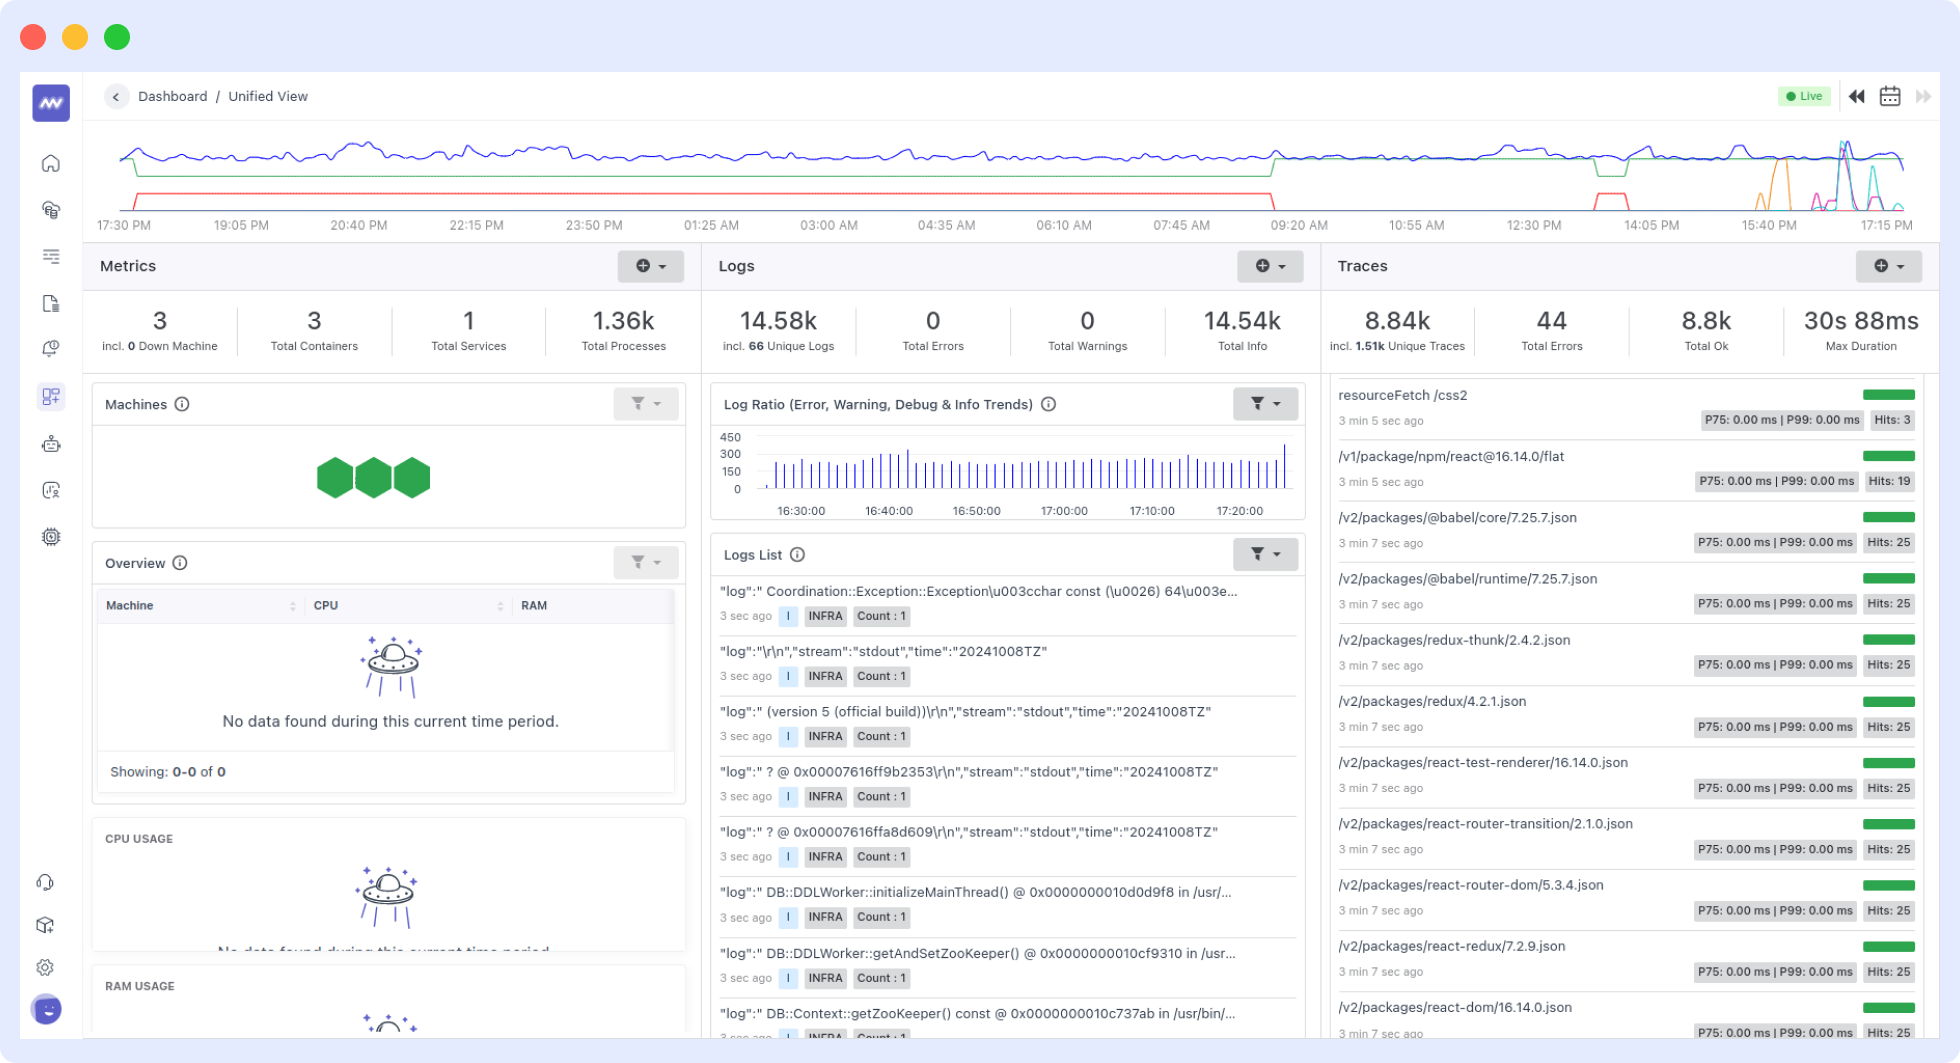
8. Click on Unified Dashboard:
9. You’ll see your metrics, logs, and traces on the Middleware Unified Dashboard with end-to-end visibility.
For more about Middleware configuration, check our documentation.
Final thoughts on OpenTelemetry Collector
The OTel Collector simplifies and harmonizes the SDE’s observability responsibilities. Middleware further improves the Collector’s efficiency with its unified end-to-end view of telemetry data in a single user-friendly dashboard.
The AI-based platform allows you to customize telemetry gathering and visualization, ensuring that the telemetry you collect serves your specific use case.
Middleware regularly updates its agent with new, exciting features for improved observability into app performance. Try Middleware for free!
FAQ
1. What is an OTel Collector?
The OpenTelemetry Collector allows you to collect, process and export telemetry data in a unified way. It is a highly flexible and scalable intermediary between your apps and observability backends.
What is the use of the OpenTelemetry Collector?
The OpenTelemetry Collector simplifies the instrumentation process by providing a standardized and vendor-neutral way of collecting telemetry data from various sources.
Instead of having to manage multiple agents or instrumentation code within each application, you can deploy a single collector that handles these tasks for all your applications.
What is the difference between the Collector and Agent in OTel?
The OTel Collector acts as a dedicated intermediary between your applications and the observability backends. It receives telemetry data and transforms and exports it to one or more destinations.
On the other hand, an agent is a monitoring tool in which the Collector is usually embedded. Agents typically offer unified solutions for both monitoring and telemetry data collection.


