The best engineering teams have discovered something unexpected: the fastest way to fix problems is to prevent them from happening in the first place.
Modern observability has outgrown traditional monitoring. While many teams still wait for alerts to fire, top organizations now utilize AI-powered platforms to identify root causes and resolve issues hours before users are even aware of them. This shift from reactive response to proactive prevention is reshaping how reliability teams work and helping great products and organizations avoid costly downtime or complete shutdowns.
We covered how to identify root causes efficiently in our previous post. Now, let’s look at how Middleware helps you go one step further: automatically resolving root causes before users notice anything is wrong.
What Is Proactive Root Cause Resolution?
Root cause resolution is all about identifying and fixing issues before they disrupt users or impact operations. It works like predictive maintenance for your applications; rather than waiting for something to break, you detect early warning signs and take action proactively.
Traditional monitoring only alerts you after a failure occurs. Proactive root cause resolution, however, leverages modern intelligence to show you why something is likely to break in the first place. This becomes possible when you combine essential observability data logs, performance metrics, traces, and deployment information with AI-driven insights.
Why Fixing Issues Early Matters for Your Business
Performance issues and downtime frustrate users and directly impact revenue, as over half of mobile users abandon sites that take more than three seconds to load. Every minute of slow performance damages trust and drives users to competitors.
Restoring services isn’t enough if the root cause remains unresolved. Without fixing the real issue, teams end up in a cycle of repeated outages. Early detection breaks this cycle. It gives teams time to address minor problems before they escalate into system-wide failures.
Organizations that adopt proactive monitoring report up to 70% fewer major incidents and faster recovery. Prevention not only reduces downtime, but it also frees engineers to focus on building and improving, rather than constantly responding to issues.
What Makes Root Cause Resolution Difficult
Finding and fixing the real cause of an issue isn’t always straightforward. Modern systems are complex, comprising an infinite number of moving components and dependencies. Once something breaks down, it may take hours to identify the root of the issue.
Fragmented tools: Logs live in one platform, metrics in another, traces in a third, and deployment records somewhere else. Engineers waste hours switching between tools, each with its own distinct dashboards and query methods.
👉Read how engineering teams are replacing multiple tools with Middleware — and gaining unified visibility, faster troubleshooting, and lower costs.
Manual investigation takes too long: Teams often spend hours connecting dots between a latency spike in one service or errors in deployment. This manual detective work delays resolution and increases the risk of missing key relationships.
Alert fatigue from excessive noise: When every minor threshold breach triggers an alert, engineers must filter through numerous notifications. Important alerts blend with trivial ones, and real issues go unnoticed.
🚨Turn Alerts into Actionable Insights
Stop alert fatigue. Middleware helps your team act on the right alerts at the right time with clear runbooks and full incident context.
Slow detection: Fixed thresholds can only be triggered when the performance has fallen to a certain level. There may be subtle degradation, causing an outage that is often difficult to notice until it occurs.
Missing context during incidents: Alerts often show what happened, such as a rise in response times, but not why it occurred or who is affected. Without historical data or connected insights, every investigation starts from zero.
👉 Start your journey to intelligent monitoring — see how Middleware transforms your first 4 weeks.
Root cause resolution is challenging, not because teams lack skill, but because traditional tools make it difficult to connect cause and effect fast enough to stay ahead of user impact.
How Middleware Resolves Root Causes Before Users Are Affected
While many monitoring tools help you react to issues after they occur or identify the root cause and leave the resolution to you, Middleware takes a different approach.
It utilizes artificial intelligence and automation to identify and resolve root causes before users encounter issues. Here’s how each capability contributes to prevention:
Unified Observability: See Everything in One Place
Middleware consolidates logs, performance metrics, distributed traces, deployment history, and real-user monitoring into a single, unified dashboard. This eliminates the constant tool-switching that slows investigations and fragments context.
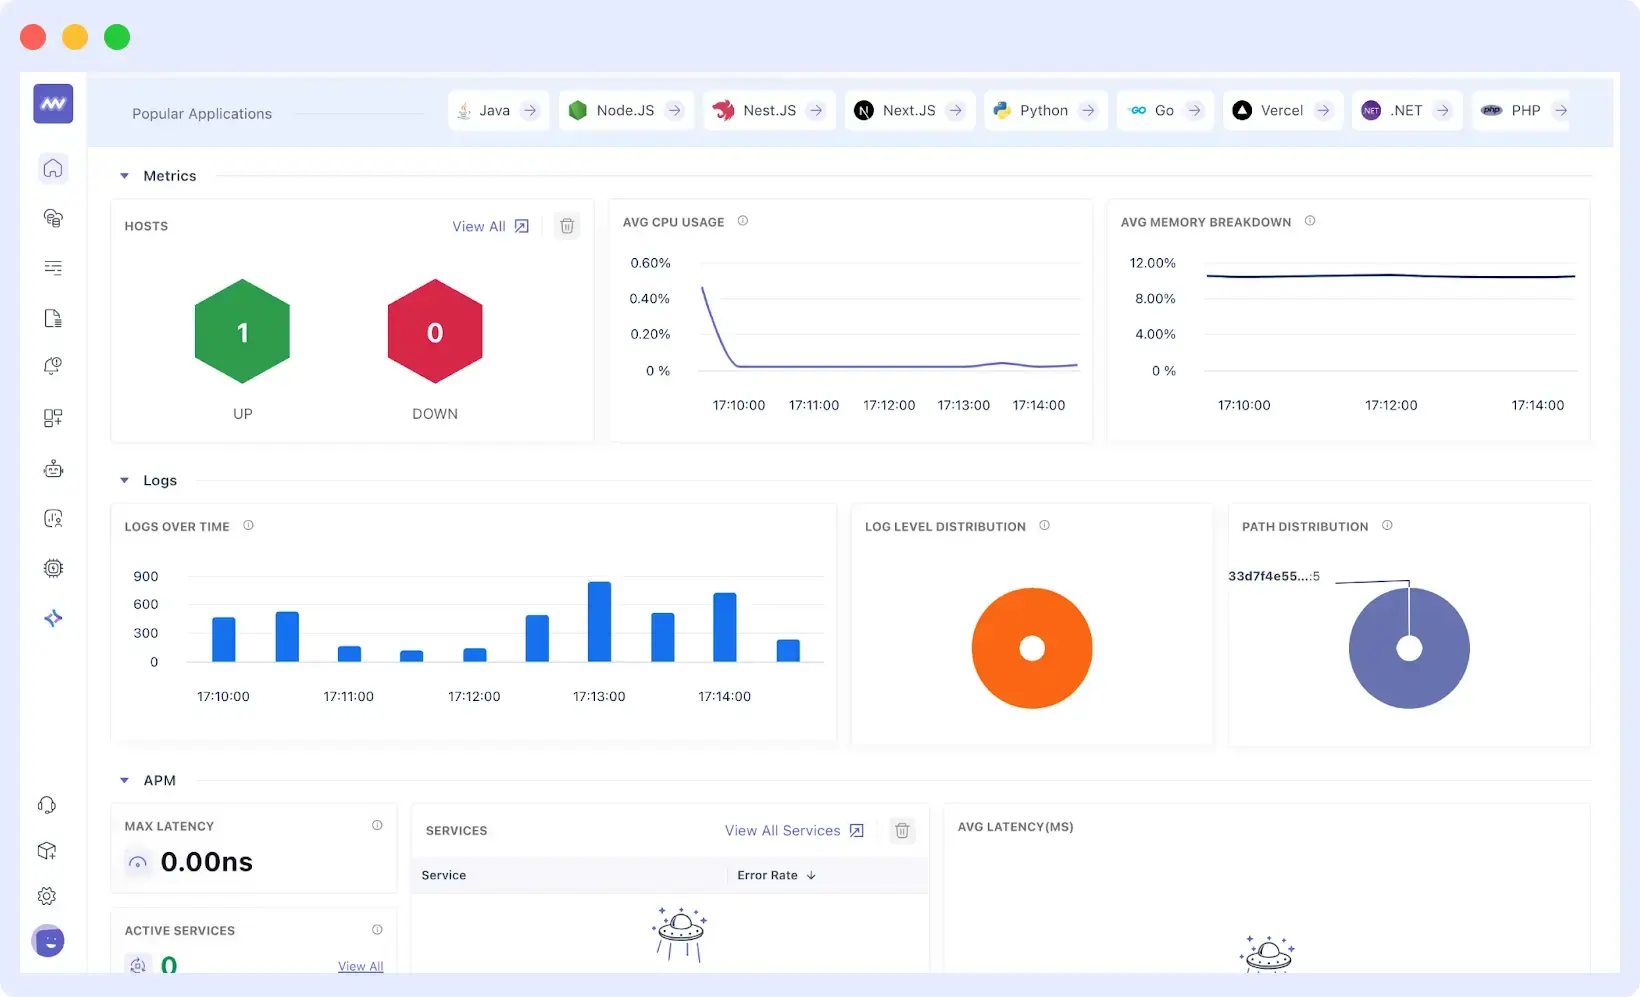
The platform automatically connects related signals across your entire stack, from frontend JavaScript errors to backend database queries and infrastructure performance. You can follow a failed user transaction through every layer of your system without having to leave any interface.
For instance, when investigating slow checkout times, you can instantly view frontend performance data, API latency, database query durations, and recent deployments that may have introduced the issue. This full-stack visibility helps teams identify root causes in minutes instead of hours.
In addition to accelerated troubleshooting, this method saves teams a significant amount of time, money, and energy. Teams operate out of a single source of truth, eliminating the need to pay for and manage the integration of various monitoring tools.
Engineers use less time to coordinate different tools and more time to enhance the reliability and performance of the product. All these compounds ultimately reduce the costs of incident response, decrease downtime, and enable businesses to run more efficiently.
Results: Teams find root causes in minutes instead of hours by seeing logs, metrics, traces, and deployments in one view. This eliminates wasted time switching between tools and reduces investigation costs.
Intelligent Alerting and Ownership
One of the most critical aspects of fixing root cause problems fast and efficiently is intelligent alerting. Teams should be informed as soon as something begins to go wrong, allowing them to address issues quickly.
Middleware enables teams to go beyond the noisy, repetitive alerting. It will deliver contextual and actionable notifications to the relevant teams, based on service ownership, on-call schedules, and the severity of the issue, without overwhelming everyone with unnecessary notifications.
The rules of the custom alerts can be created based on the specifics you are interested in monitoring, including Real User Monitoring (RUM) metrics, APM traces, or infrastructure performance.
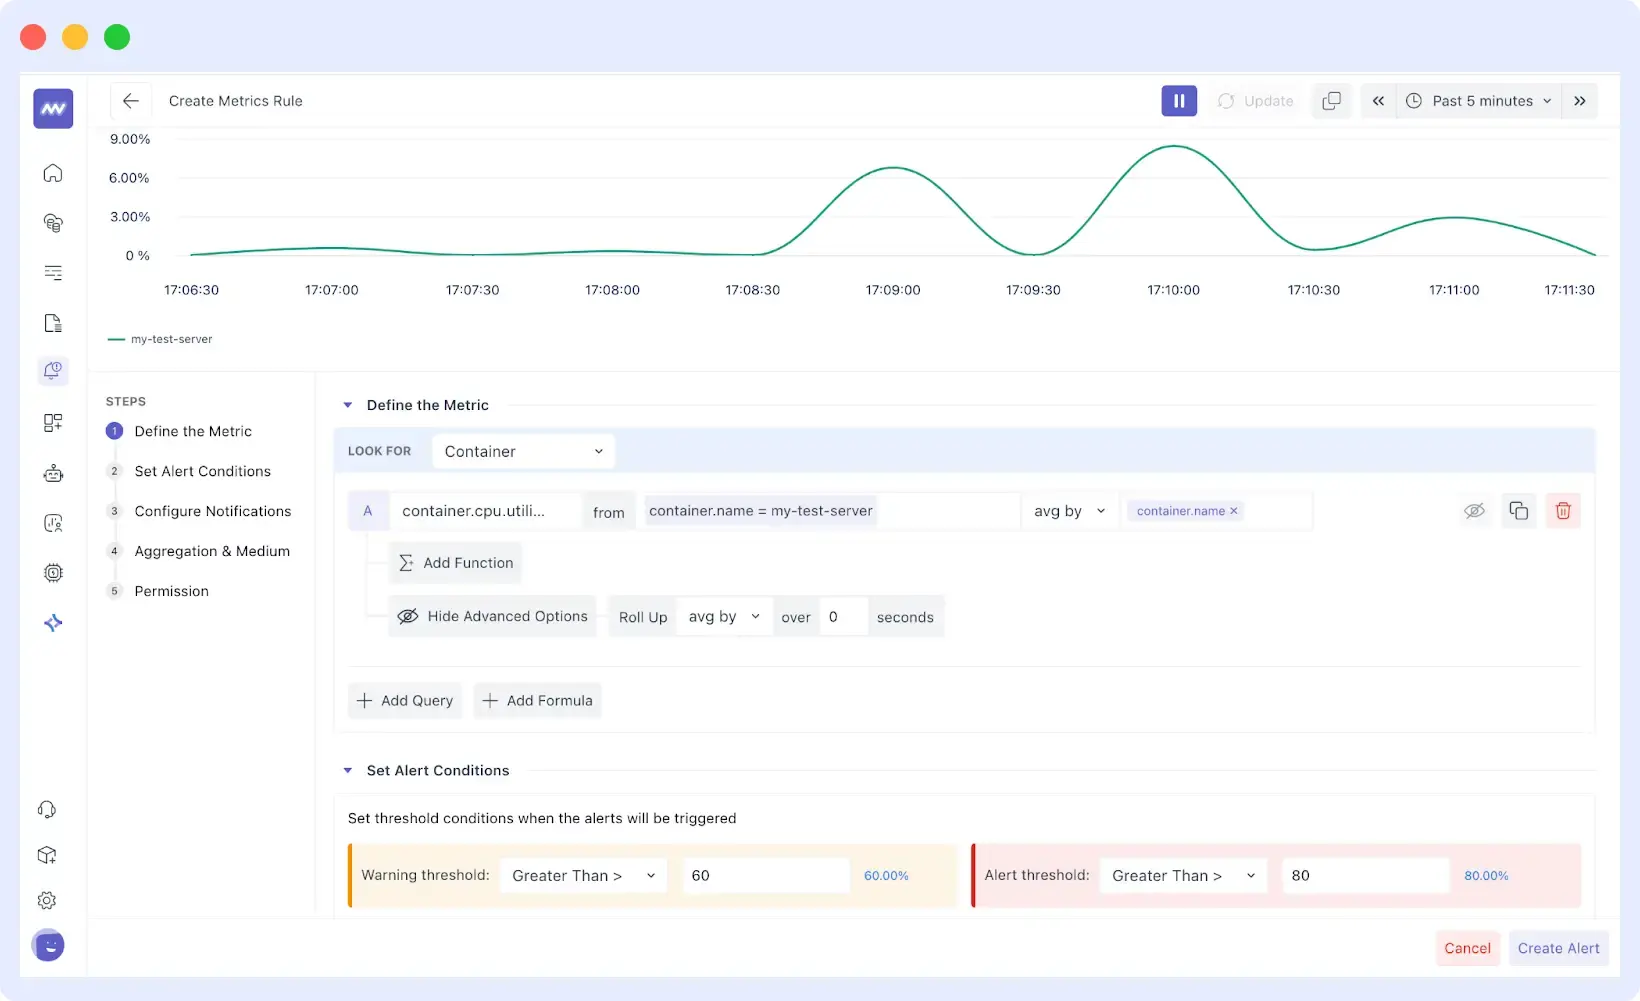
After setting your alert conditions and thresholds, Middleware gives you flexibility in how and where to receive notifications. Teams can choose to be alerted through email, PagerDuty, Microsoft Teams, Slack, or other integrated channels.
Permissions can also be managed so that only authorized users can create, edit, or view alerts tied to specific systems or services.
Middleware also includes a library of prebuilt alert rules for common metrics and anomalies, helping teams get started quickly without having to define every condition manually.
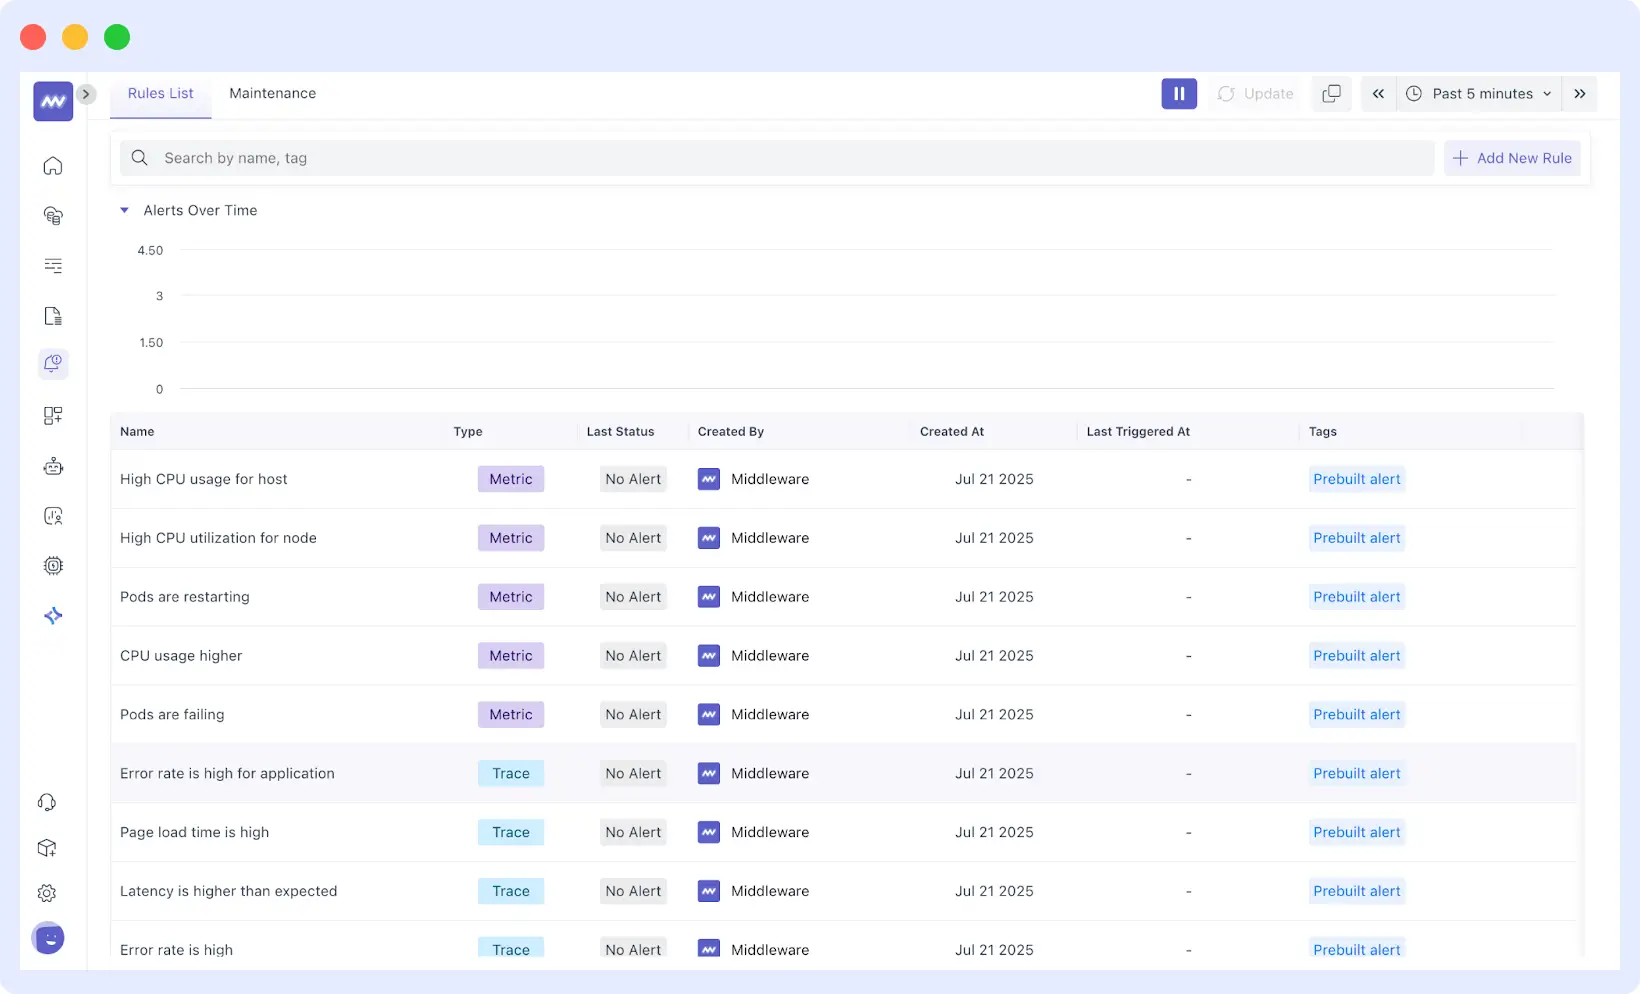
This combination of intelligent correlation, routing, and context prevents alert fatigue, reduces confusion, and speeds up resolution.
Results: Right alerts reach the right teams with complete context, preventing alert fatigue and confusion. Noise is reduced through intelligent correlation, while critical issues receive immediate attention.
Real User Monitoring (RUM) and Synthetic Checks
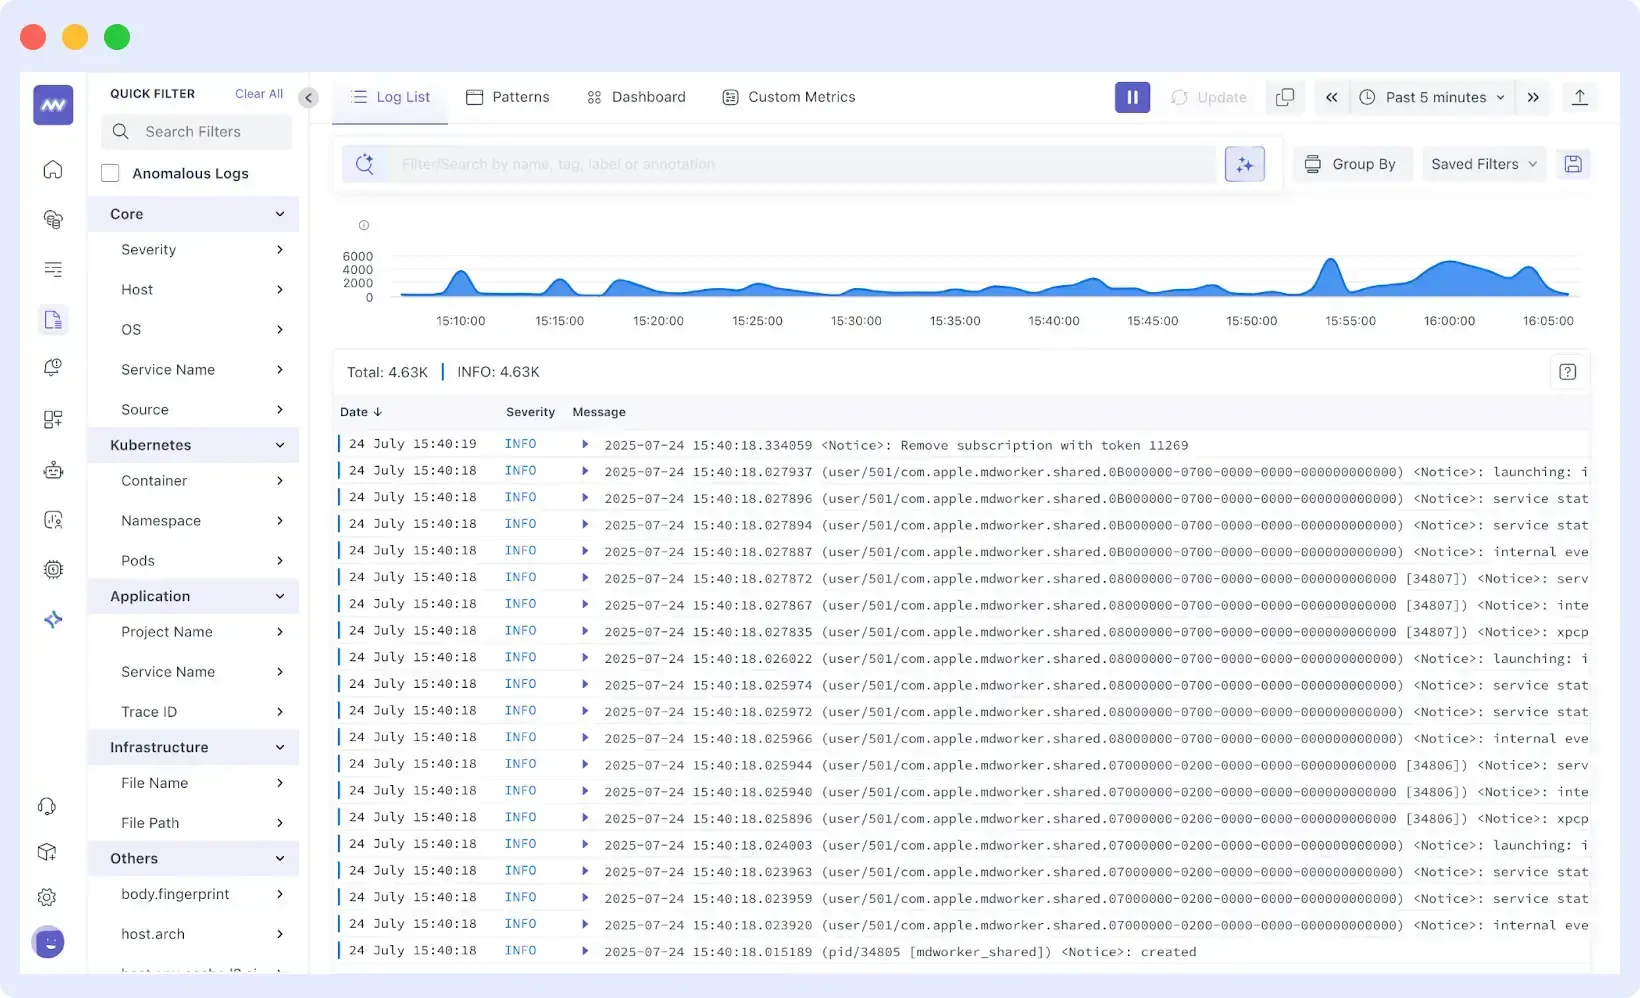
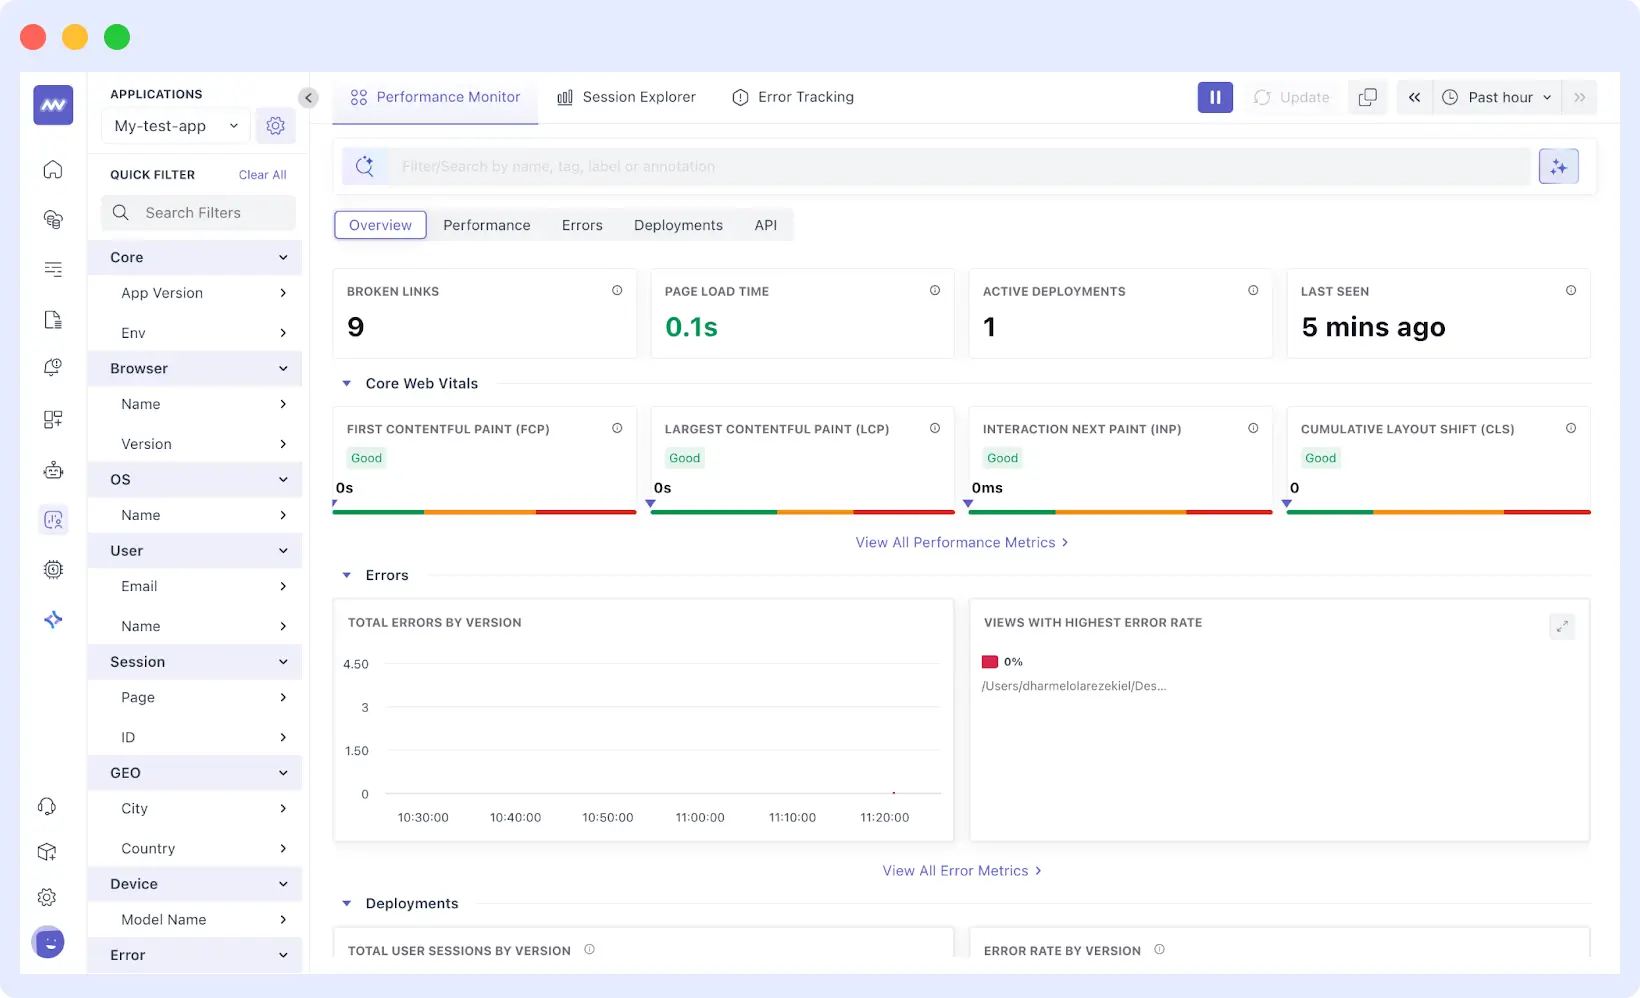
Server-side metrics show backend health, but they don’t capture what users actually experience. Middleware’s RUM tracks real user interactions, page load times, clicks, errors, and complete user journeys in browsers and mobile apps.
What makes RUM valuable for root cause analysis is the connection it creates between frontend and backend. When an issue occurs, you can see the user’s session alongside the related backend traces and logs. This shows you what the user did, where the failure happened, and what was occurring on your servers at that time.
Session replay adds another layer. You receive time-stamped recordings of user interactions, along with correlated backend traces. This helps identify and reproduce issues that only appear under specific conditions or user workflows.
You can filter RUM data by geography, device type, or browser. This quickly narrows down whether an issue affects all users or just specific segments such as mobile users, certain regions, or particular browser versions. When you deploy updates, RUM displays performance changes across these segments, making it clear whether a release introduces problems.
✨Learn how to monitor web app user journeys with browser tests using Middleware.
Synthetic checks run automated tests on critical paths, such as login, checkout, and search. These tests run continuously from multiple locations, catching failures before real users encounter them. If an API starts failing at off-peak hours, synthetic monitoring detects it immediately.
Synthetic checks also provide network timing data and response metrics by location. This helps determine whether issues stem from backend performance, regional infrastructure problems, or network latency in specific areas.
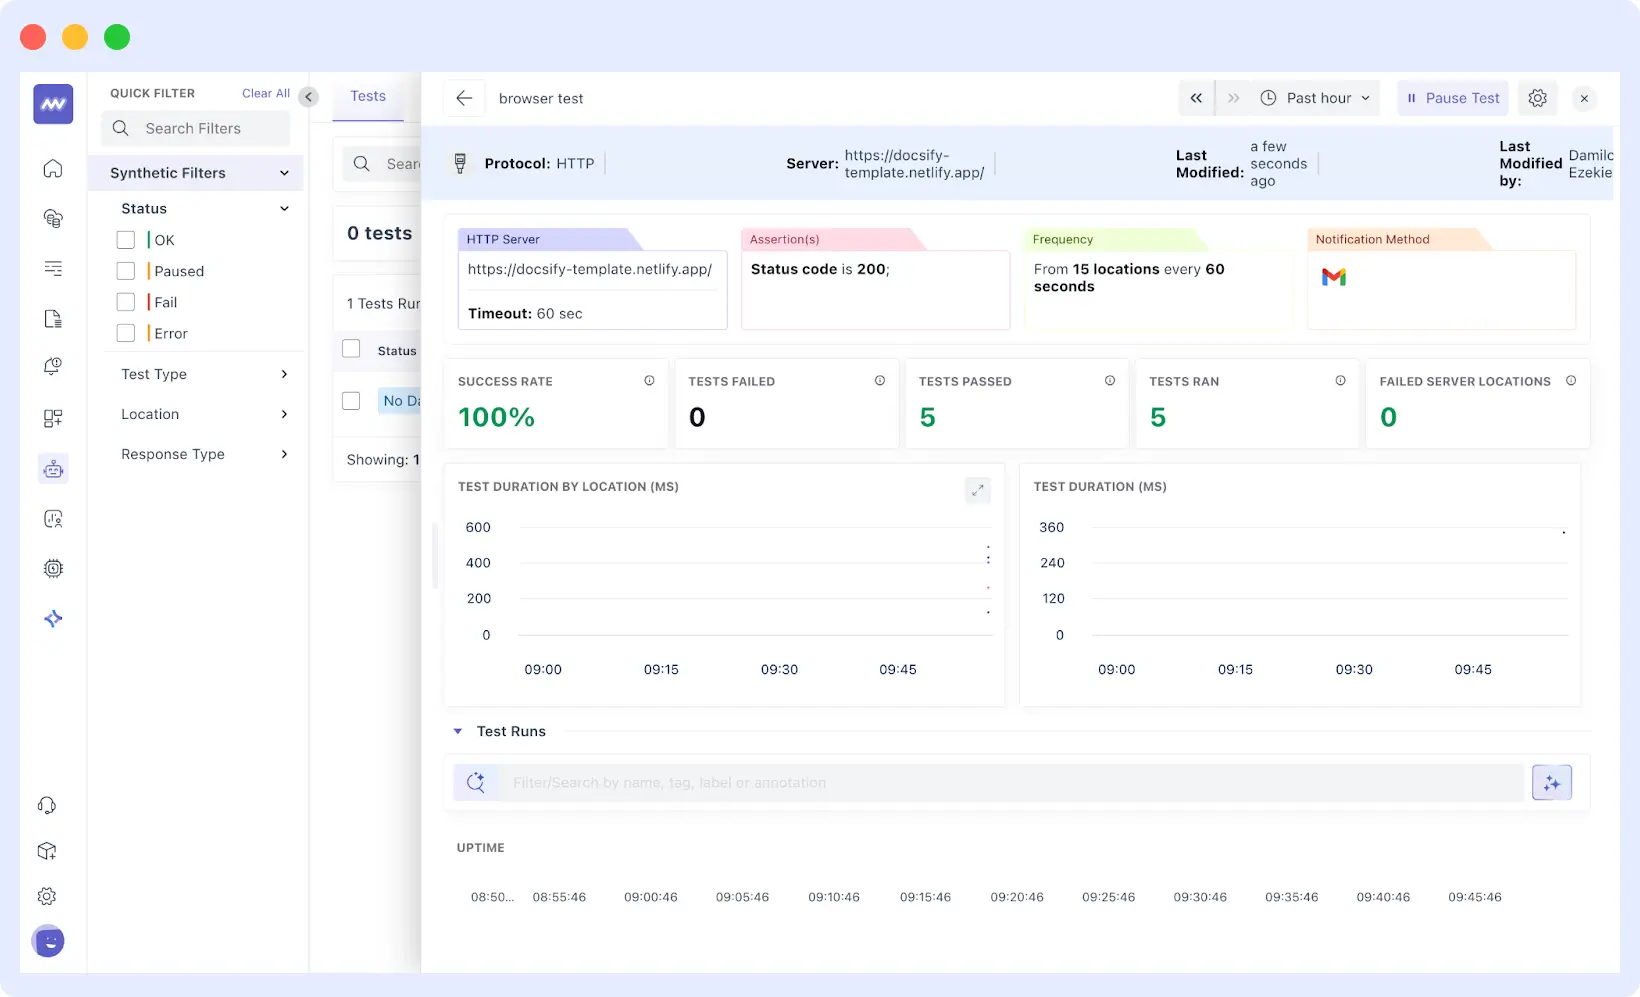
Used together, synthetic checks identify what’s failing while RUM shows which user segments are affected and under what conditions. This combination gives you concrete data for faster root cause identification.
Results: Frontend and backend issues get detected and correlated before most users experience them. Teams identify whether problems affect specific regions, devices, or browsers, enabling targeted fixes.
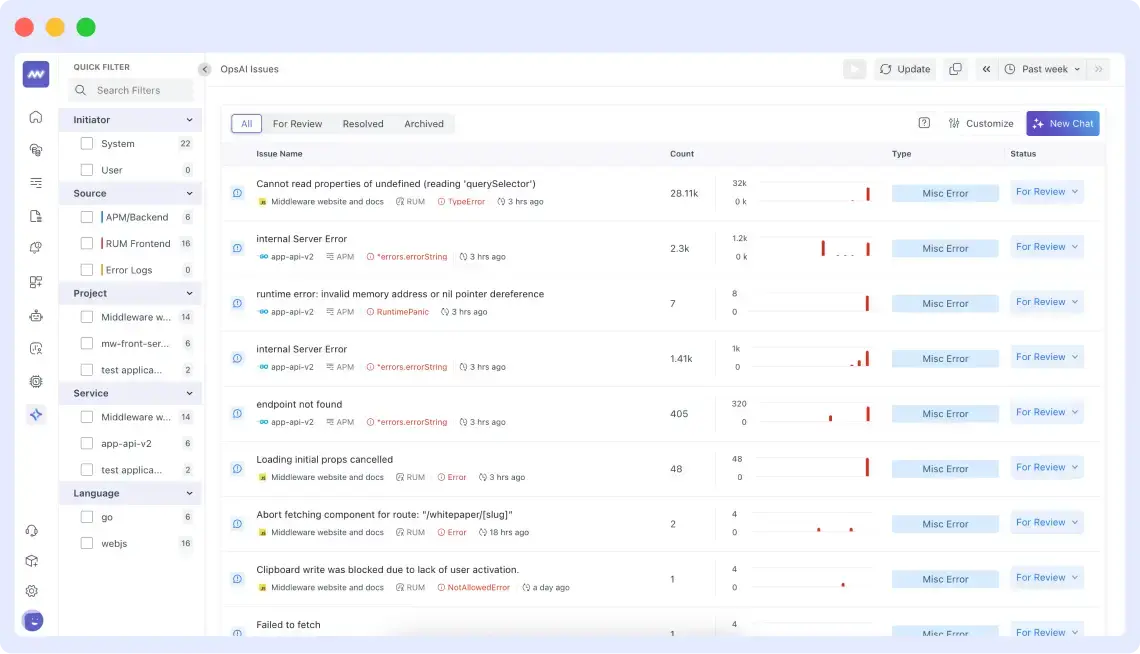
OpsAI for Intelligent Root Cause Identification
Finding root causes manually means digging through logs, comparing traces, checking commits, and piecing together what went wrong. OpsAI automates this process by pulling context from your entire observability stack and investigating issues on your behalf.
Getting Started with OpsAI
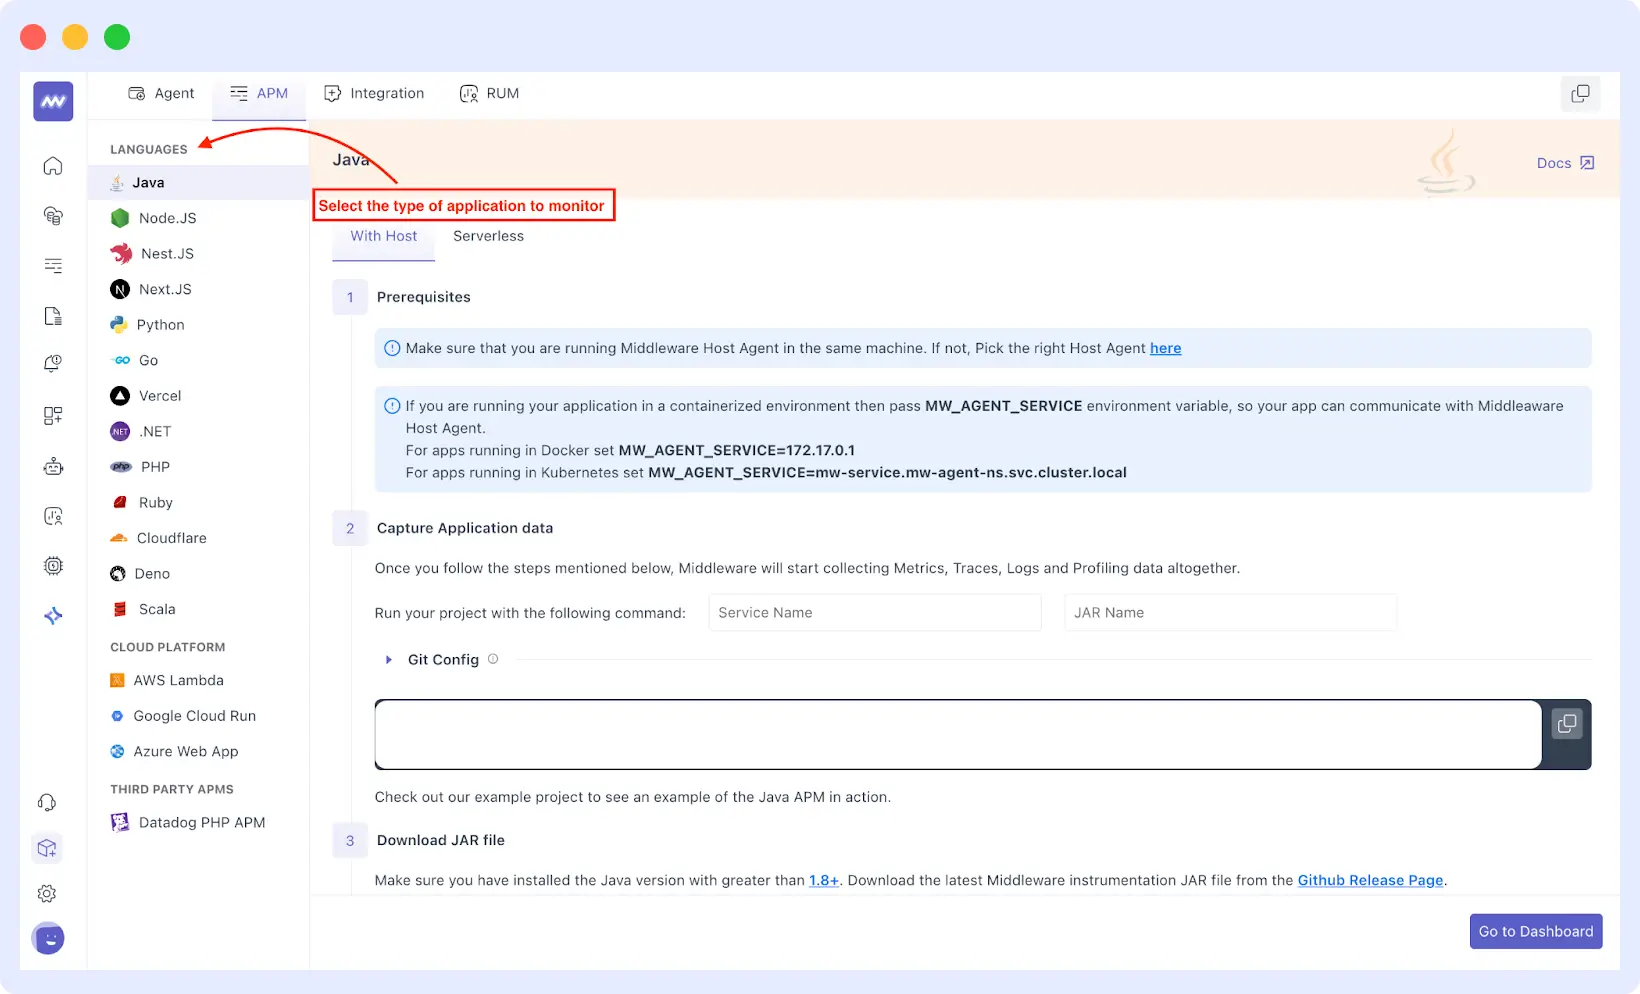
First, install the Middleware APM agent in your application. Once deployed, the agent starts monitoring your stack, tracking code exceptions, runtime errors, and performance issues across both frontend and backend.
For Node.js applications, install the agent using npm:
npm install @middleware.io/node-apm --save
// Initialize at the beginning of your application const tracker = require('@middleware.io/node-apm'); tracker.track({ serviceName: "your-service-name", accessToken: "" });
The APM agent automatically instruments your application, capturing traces, logs, and errors without requiring manual code changes. The error handler integration enables OpsAI to detect issues, analyze their root causes, and suggest fixes.
Middleware also provides APM agents for Python, Java, Golang, and JavaScript frameworks and other languages. Once deployed, the agent starts monitoring your stack immediately.
See the complete OpsAI setup guide.
Next, connect your GitHub account or any version control tool to Middleware. This integration enables OpsAI to access your repositories, examine your codebase, and directly link errors to specific files and commits. Once connected, OpsAI automatically starts collecting and analyzing errors from all your repositories.
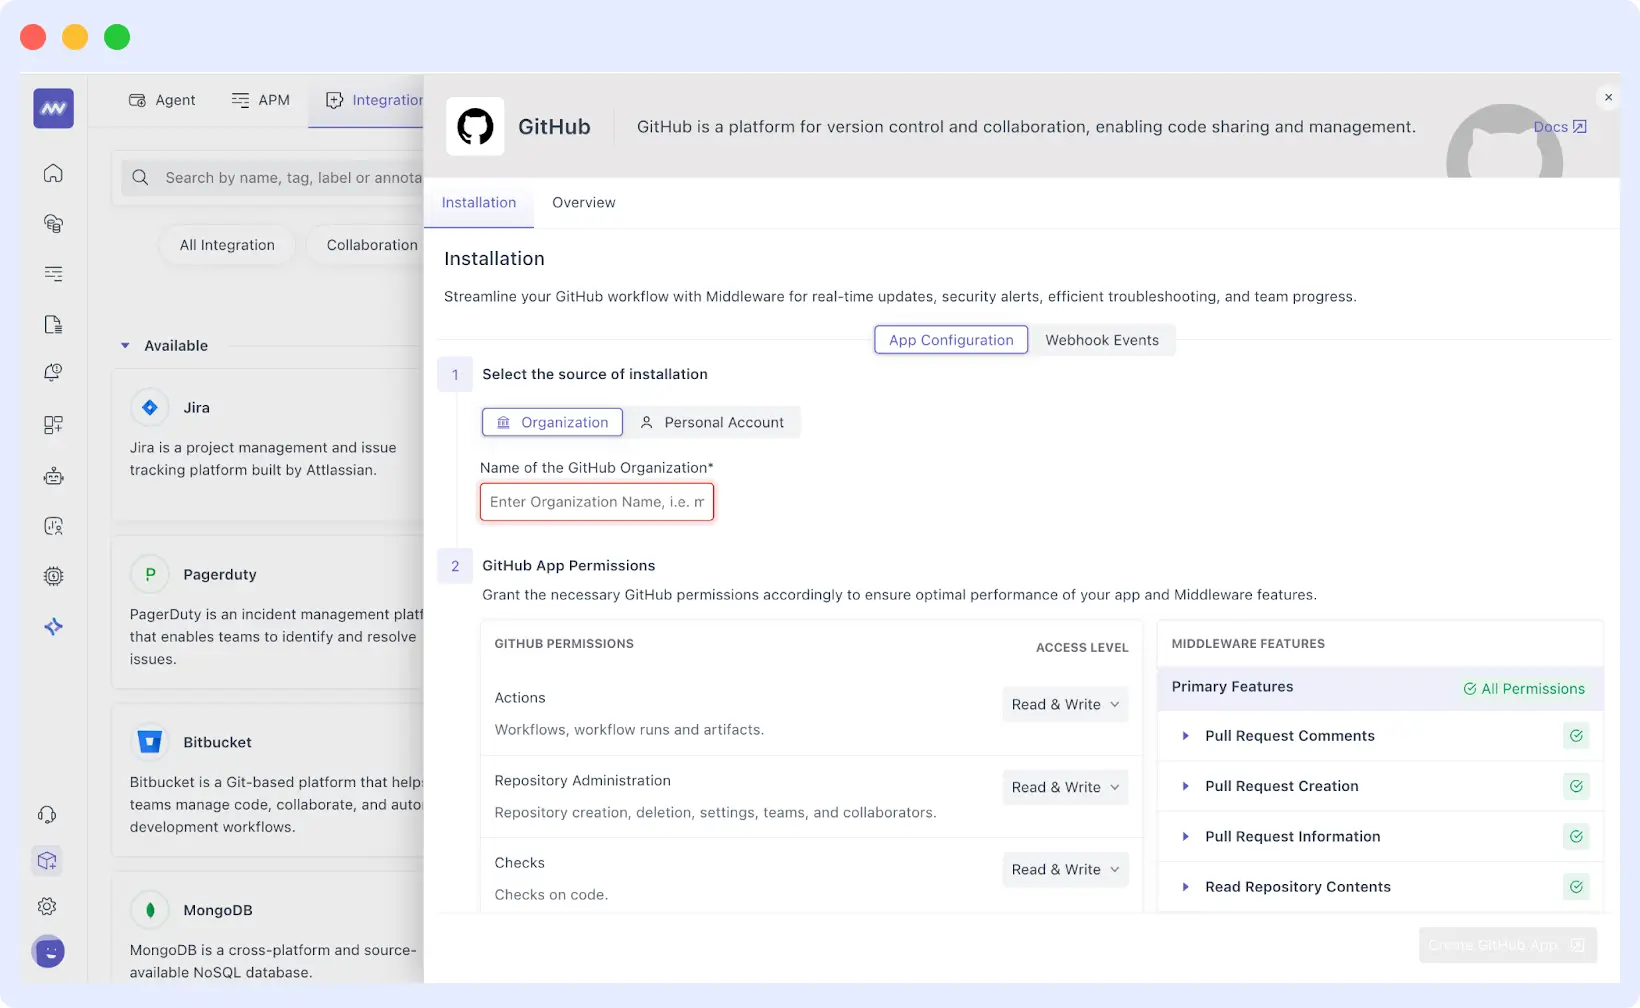
How OpsAI Investigates Root Causes
When an error occurs, OpsAI doesn’t just flag; it also provides a detailed explanation. It builds a complete picture by gathering information from traces, logs, request data, error messages, and environment details. Through the GitHub integration, it identifies the exact file and line number where the error happened.
Then it investigates deeper. OpsAI examines commits made before the error appeared, analyzes code dependencies, reviews similar past errors, and checks other developer activities to understand what caused the system to break.
👉Ready to Get Started with OpsAI?
Set up OpsAI in minutes and let automated root cause analysis transform how your team resolves issues.
Automated Fixes
OpsAI passes all the investigation details to its refactoring agent to generate fix suggestions. When it has high confidence in a solution (above 95%), it automatically creates a pull request with the fix. You can review and apply it directly from the interface.
For lower-confidence scenarios, OpsAI still provides all the investigation context, including error details, stack traces, related commits, and dependency information, so engineers can start debugging without spending time gathering information manually.
The system learns from historical patterns. As it catches and fixes more bugs, it becomes smarter at identifying root causes and suggesting accurate solutions. This means faster resolutions and fewer repeated investigations for similar problems.
OpsAI works across your entire application stack, pulling together issues from frontend (Real User Monitoring) and backend (APM), including syntax errors, code exceptions, and runtime errors.
In production use at Middleware, it resolves over half of the issues automatically. In tests with multiple customers, detection-to-resolution rates have exceeded 70%. The tool also boosts on-call developer productivity by more than 80% and reduces mean time to respond (MTTR) by 5 times.
Results: Investigation time drops from hours to minutes with automated root cause analysis and suggested fixes. An over 70% detection-to-resolution rate means that most issues are resolved quickly, often automatically.
Deployment and Change Tracking
Every deployment introduces change, and change is the number one cause of production incidents. Middleware’s Deployment and Change Tracking, powered by OpsAI, helps teams instantly connect recent updates to emerging issues, enabling faster, more confident resolutions.
Middleware integrates deployment tracking directly into your observability stack, automatically correlating each deployment with system behavior.
🔗 Ready to Stop Deployment Issues Before They Hit Production? Read the full guide: Catch Deployment Issues Before They Become Outages
Automatic Change Mapping
Middleware detects new deployments, configuration updates, and infrastructure changes in real time. These events are automatically overlaid on performance charts, including latency, error rates, and throughput. This gives teams immediate clarity on exactly what changed and when.
Trace to Exact Commit
When an issue arises, OpsAI links it directly to the precise GitHub commit and identifies the engineer responsible for the change. This eliminates hours of guessing, Slack messages, and detective work.
# Set VCS information for deployment trackingexport MW_VCS_COMMIT_SHA=$(git rev-parse HEAD)export MW_VCS_REPOSITORY_URL=$(git config --get remote.origin.url)
By setting these environment variables, Middleware automatically correlates deployments with application behavior and traces issues to specific commits.
- With this visibility, teams can clearly see how each deployment affects system health, frontend performance, backend stability, and everything in between. This also helps distinguish real code problems from environmental or infrastructure-related issues that appear similar.
- Over time, OpsAI identifies patterns across deployments, such as modules that frequently introduce errors or configurations that regularly cause instability. These insights help engineering teams prevent recurring failures before they happen.
The combination means you catch deployment issues early, understand why they happened, and fix them before users notice anything’s wrong.
🔍For more details on how Middleware links commits to system behavior and accelerates debugging, explore our guide: Troubleshooting Root Causes with GitHub Commit and Ownership Data in Error Tracking.
Results: Teams immediately connect performance issues to specific deployments and commits, eliminating guesswork about what changed. Root causes are traced to particular code lines and the responsible engineers, speeding up fixes.
Stay Ahead of Issues with Middleware
The best way to handle incidents is to prevent them entirely. When issues do occur, Middleware’s unified observability, AI detection, and automated analysis help you identify and resolve them fast before they affect your users.
Stop constantly reacting to incidents. Middleware gives your team more time to build and helps you maintain more stable services.
🚀Ready to Resolve Issues Smarter?
Experience smarter root cause resolution. Start your free trial or book a demo to see Middleware in action.


