
Have you ever dealt with an unexpected network failure that disrupted your business? These issues often begin quietly, perhaps from a failing router, an overloaded switch, or rising traffic. But no one notices them until they escalate and cause a full outage. This is why SNMP monitoring is so important.
SNMP monitoring helps you track the performance, availability, and health of network devices such as servers, routers, and switches. It shows how each device behaves, alerts you before failures occur, and provides real-time visibility across your infrastructure.
In this blog, you’ll learn what SNMP monitoring is, how it works, and which key metrics ensure your network stays reliable and healthy.
What is SNMP Monitoring?
SNMP monitoring is a method of tracking the health, performance, and status of network devices using SNMP agents installed on each device and a central SNMP manager that collects and analyzes this data.
These agents collect data such as CPU load, memory usage, and interface stats from their devices and make it available to the manager.
👉Curious why servers slow down over time? Check out our detailed post on detecting and preventing memory leaks.
The manager then queries this data, interprets it using the device’s Management Information Base (MIB), and visualizes the results in dashboards.

In practice, SNMP monitoring provides administrators with real-time information about all connected devices. So, when performance drops or a device fails, they can quickly identify the cause.
SNMP monitoring works through a process called SNMP polling, where the manager regularly requests data from agents, as well as SNMP traps, where agents instantly notify the manager of critical events.
Key Components of SNMP Monitoring
- SNMP Agent: An SNMP agent is software that gathers information about CPU load, memory, and interface status. It automatically transmits this data to the SNMP manager, or only when requested.
- SNMP Manager: The monitoring system that talks to all agents. It requests data, receives responses, and analyzes them to provide an overall health assessment of your network.
- Management Information Base (MIB): A device’s catalog of available data (e.g., bandwidth, temperature).
- Object Identifier (OID): The MIB’s unique ID for a data item. It directs the manager to seek the right metric, ensuring device-wide communication. Admins often use a MIB Browser to explore device OIDs and verify the metrics available for monitoring.
How SNMP Monitoring Works
SNMP monitoring involves basic communication between the Manager, Agent, MIB, and Dashboard.
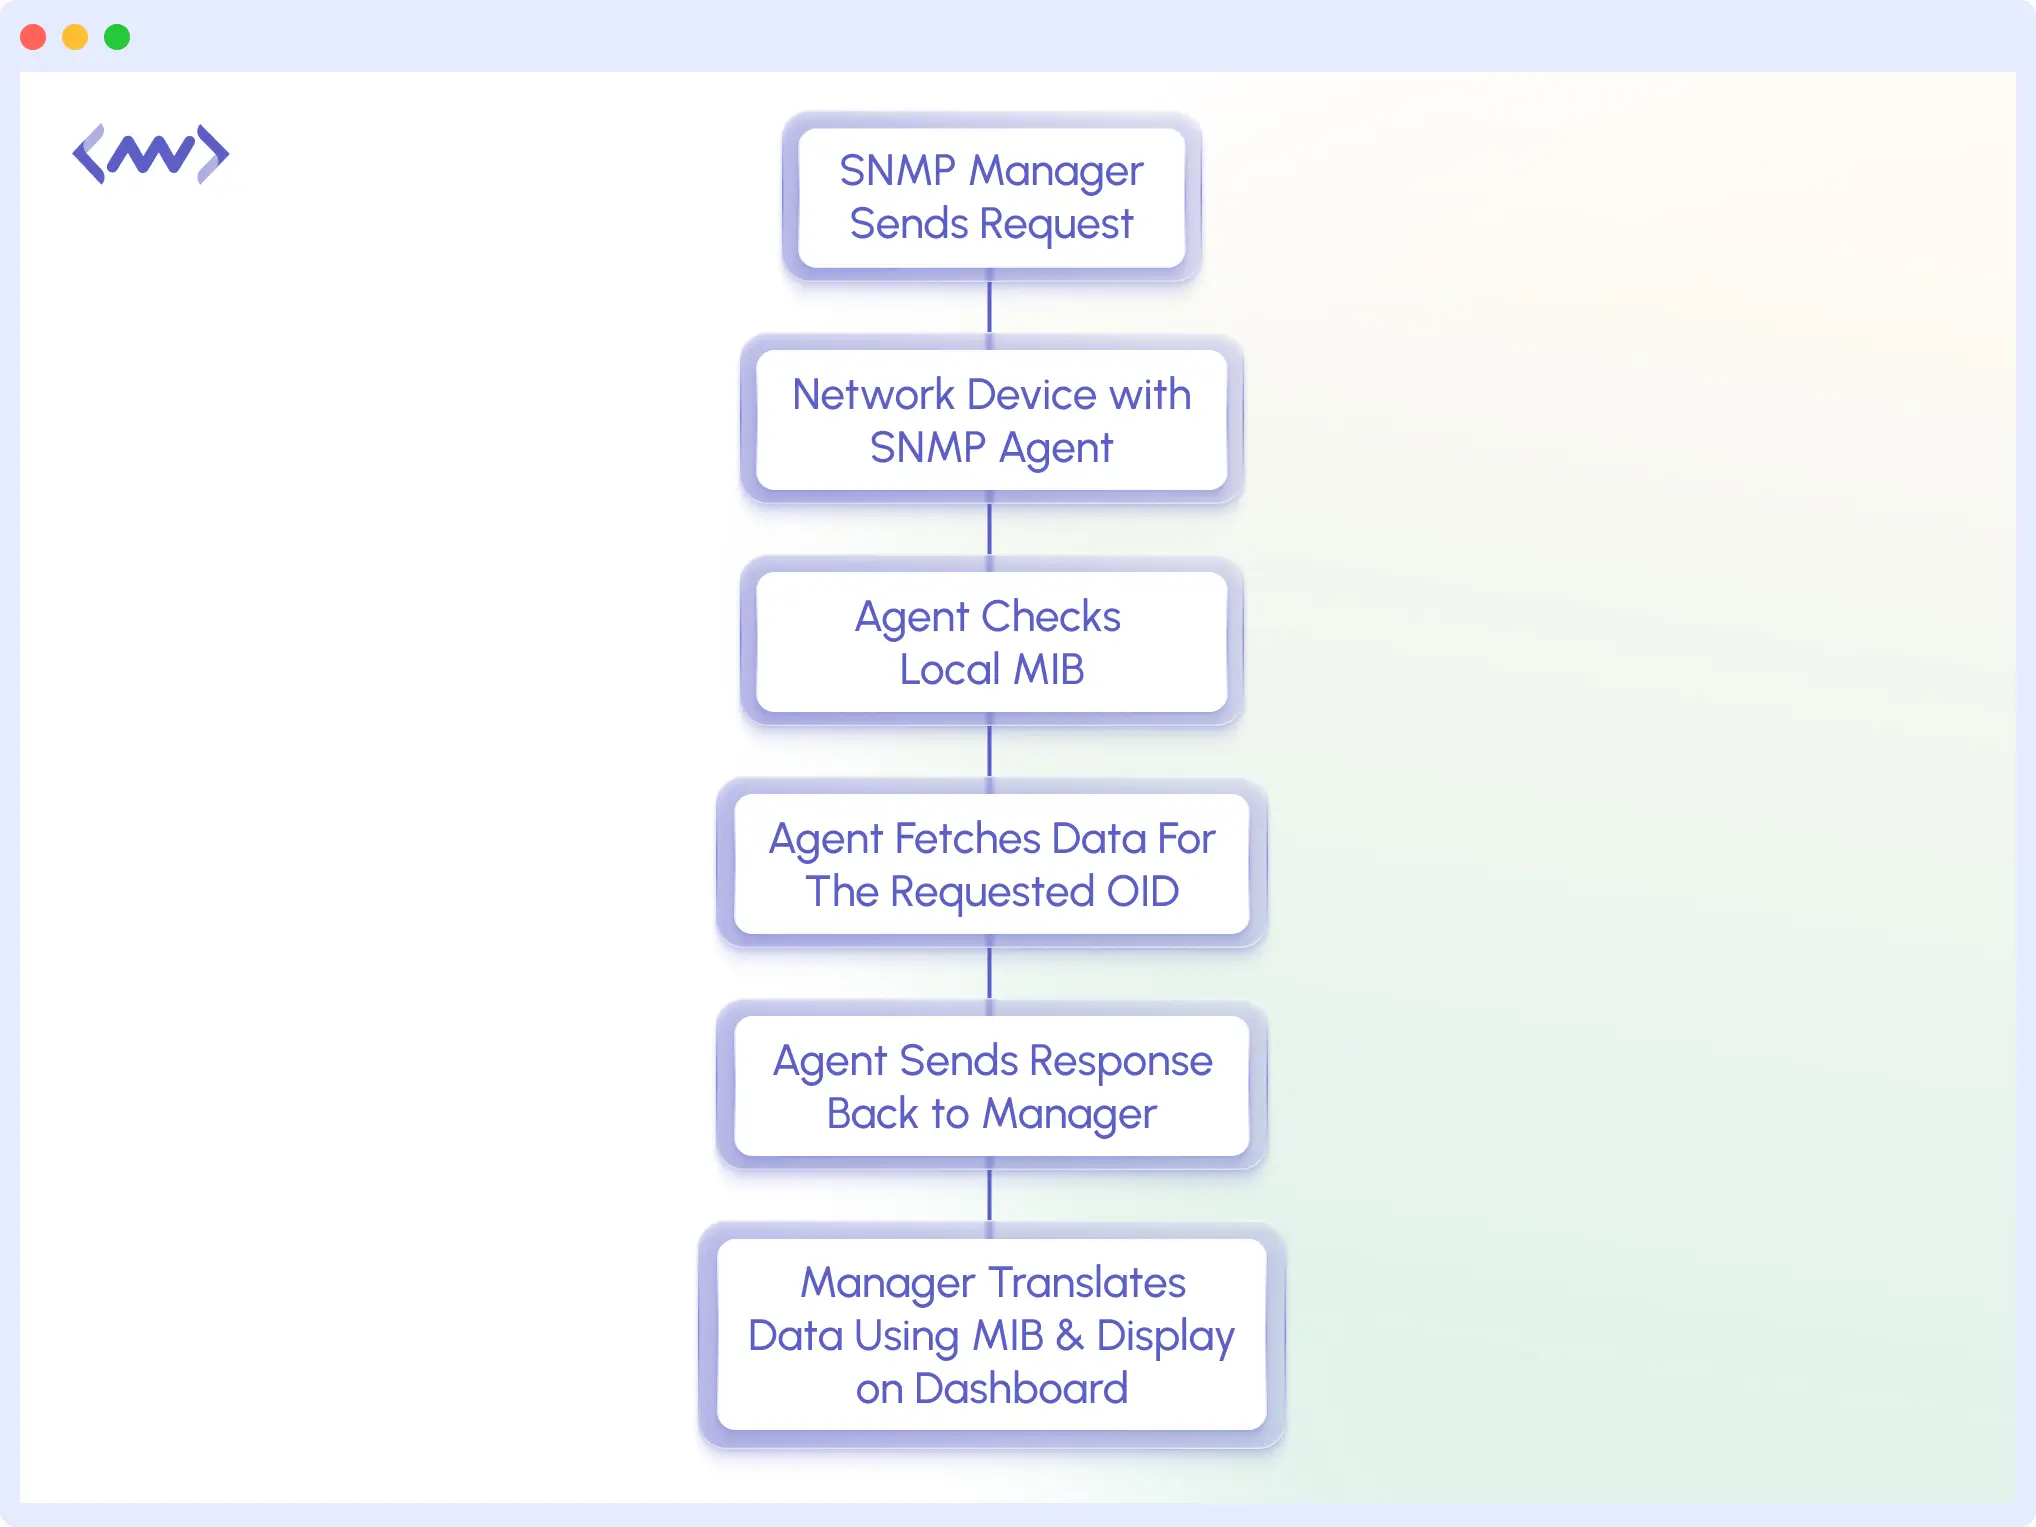
Here’s how:
- Set up Device: Every network device, such as a router or server, runs an SNMP agent. It tracks CPU load and memory use and stores the data in an MIB.
- Manager Communication: The SNMP Manager acts as the central monitoring system. It regularly sends requests (such as GET, GETNEXT, or GETBULK) to the agents using SNMP port 161. Using their individual OIDs, the agent returns the desired metrics.
- Alerts: If a device gets too hot or the network goes down, the agent will use port 162 to send a Trap or Inform message to the manager.
- Displaying Data: The manager will gather and process all received data. Admins will see this data on a dashboard and use it to monitor device health, identify changes, and resolve issues instantly.
Setting up a Simple SNMPv3 Configuration
The setup below demonstrates a basic macOS SNMPv3 configuration using Homebrew. Similar methods apply to Linux and other UNIX platforms.
Install the SNMP service
Use Homebrew to install Net-SNMP:
This installs SNMP binaries and configuration files under the /opt/homebrew/opt/net-snmp/ directory. The path might be different for you; always verify.
Create the SNMP Configuration File
Open the main configuration file using Nano (or any text editor):
Replace any existing content with the simple SNMPv3 configuration below:
createUser myUser SHA "myAuthPass123" AES "myPrivPass123"
rouser myUser authPriv
sysLocation "MacBookPro"
sysContact "Admin <admin@example.com>"
Here’s what each line does:
- createUser: Creates an SNMPv3 user (myUser) with authentication (SHA) and encryption (AES)
- rouser: Grants that user read-only access with authentication and privacy.
- sysLocation/sysContact: Adds metadata to identify the device in monitoring dashboards.
Save and exit with Ctrl + O → Enter → Ctrl + X
Start the SNMP service
Run the following command to start the SNMP daemon (agent):
After completing the configuration, you should see output similar to the following:
This means the SNMP agent is now running locally and listening for SNMPv3 requests.
Verify SNMPv3 Communication
Open another terminal and run:
/opt/homebrew/opt/net-snmp/bin/snmpget -v3 -u myUser -l authPriv -a SHA -A "myAuthPass123" -x AES -X "myPrivPass123" localhost sysUpTime.0
If your setup is successful, you’ll see an output like this:
That means your SNMP agent is up and securely reporting system information.
This setup demonstrates how SNMPv3 secures device monitoring by:
- Encrypting SNMP messages
- Authenticating the manager and agent
- Avoiding breaches of data
This example uses macOS, but most Linux servers and network devices follow a similar configuration.
🗄️Want to understand how to track server performance better? Read our full guide on Server Health Monitoring →
Common SNMP Monitoring Commands
SNMP has a set of basic commands for exchanging data between managers and agents. Each command has a specific purpose: to retrieve, update, or notify about devices.
- GET: Used by the SNMP Manager to request a specific value from an agent. For example, the current CPU load or device uptime.
- GETNEXT: It fetches the next variable in the MIB tree, allowing the manager to traverse metrics in order without knowing the exact OIDs.
- GETBULK: Only SNMPv2 and SNMPv3 can use this. It enables the manager to request several OIDs. You need it to poll large databases.
- SET: With this command, the manager can change a device’s configuration value, such as updating a threshold.
- TRAP: An unconfirmed alert from a device to the manager.
- INFORM (SNMPv2 and SNMPv3 only): A confirmed version of a TRAP (requires an acknowledgement).
What SNMP Metrics Should You Monitor?
You can track many device and network metrics with SNMP monitoring. Some of the most popular categories and the metrics they show are listed below.
Interface Metrics
Interface metrics help you track how traffic flows through your network devices. You can spot issues early with them.
- Bandwidth Usage: This shows your bandwidth use. A high number indicates an overloaded network.
- Errors and Discards: Shows how many packets are being lost. A lot of mistakes usually mean bad cables or a configuration problem.
- Interface Status: Indicates whether a port is connected. You can use it to find broken links.
System Metrics
System metrics show how healthy and well your devices are performing.
- CPU Load: Tracks how much processing power a device is using. High CPU usage can cause the system to lag.
- Memory usage: Tracks RAM consumption. A failed process or insufficient resources may often increase memory use.
- System Uptime: Device runtime since last restart. It helps detect instability or unexpected reboots.
These metrics form part of your network’s telemetry data, helping track device uptime trends and long-term performance.
🤔Track exactly what matters to your system. See how to add custom metrics using Middleware’s workflow.
Network Performance Metrics
These metrics show how well your network communicates.
- Throughput: How fast data moves across the network without issues.
- Packet Loss: The number of packets that don’t reach their destination.
Environmental and Hardware Metrics
These protect devices, especially in data centers.
- Temperature: Monitors device heat to prevent overheating.
- Power Supply Status: Notifies you of power unit failure or of backup power.
- Fan Speed: Ensures cooling fans are operating correctly. Overheating can damage the hardware.
⚡Struggling with slow apps or performance bottlenecks? Learn how to fix application performance issues with step-by-step guide. 🛠️📈
SNMP Versions and Security in Monitoring
SNMP has three versions so far: v1, v2, and v3. Their speed, safety, and dependability are all different.
SNMPv1
This is the first and most basic form of the protocol. It came out in the late 1980s. It lets a manager use simple commands like GET and SET to get data from the network and change it.
However, it has a major challenge. It sends community strings (like passwords) in plain text, making it insecure. It’s fine for small, isolated networks, but not ideal for small modern setups.
SNMPv2c
SNMPv2c enhances overall speed and efficiency in SNMP operations. It added commands such as GETBULK, which enable managers to obtain data in bulk. It improved error handling, simplifying troubleshooting.
Like v1, it uses an encrypted community string, so while it performs better, it’s not more secure.
SNMPv3
Most people use SNMPv3, which is the most advanced and secure form. It has all the features of v2c and more: authentication, encryption, and access control. This ensures that only authorized users can access SNMP data and all communication stays encrypted.
Current businesses that value data privacy should use it.
| SNMP Version | Security | Performance | Recommended Use |
|---|---|---|---|
| SNMPv1 | Low | Basic | Legacy systems |
| SNMPv2c | Low | Faster, supports GETBULK | Internal networks |
| SNMPv3 | High (Auth + Encrypt) | Best | Modern secure environments |
Challenges for SNMP Monitoring
For a very long time, SNMP has been a monitoring tool people rely on. But it also has some challenges:
- Older Versions Lack Security: SNMPv1 and SNMPv2c send community strings in plain text. They are therefore open to unwanted access.
- Configuration: Managing hundreds of devices with various MIBs and OIDs can be challenging. Inaccurate or missing data can come from minor configuration errors.
- Excess Polling and Bandwidth Load: Frequent polling with short intervals can easily overload bandwidth in large networks. Optimized polling intervals prevent unnecessary SNMP traffic and ensure efficient network telemetry collection.
- Too Many Alerts: If you don’t set traps properly, you could get too many warnings, making it hard to find the real problems.
🔔Tired of noisy alerts? 😵
Learn how to create smart, real-time alerts that actually matter. ⚡
Best Practices for SNMP Monitoring
Implementing the proper SNMP practices helps reduce risks and improve monitoring accuracy.
- Use SNMPv3 for Security: SNMPv1 and SNMPv2c send community strings in plain text, exposing them to security risks. This guarantees that the manager and agents may communicate safely.
- Limit Access to SNMP Ports (161/162): Restrict access with firewalls or ACLs. Your manager and devices should only be accessible from trusted IP addresses. All SNMP polling requests use UDP port 161, and devices send alerts and trap messages through UDP port 162.
- Organize Your OIDs and MIBs: Keep your OID and MIB files up to date. Clear organization helps your monitoring tool retrieve the right metrics efficiently.
- Set Valid Trap: Set only the SNMP traps you need. Like, when a device fails, and CPU usage is high, to avoid alert fatigue.
- Monitor Performance Trends: Dashboards can track long-term performance patterns. This finds recurring bottlenecks.
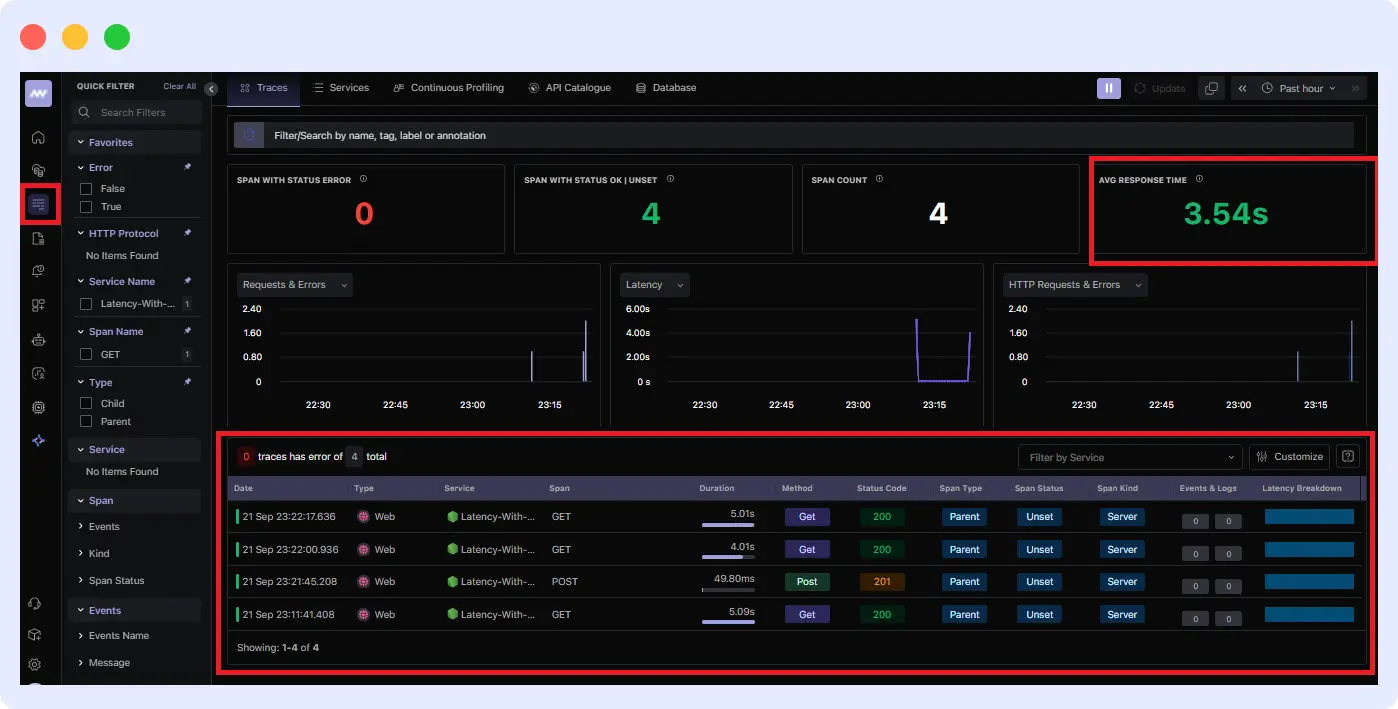
SNMP Monitoring in Modern Observability
For tracking infrastructure metrics such as bandwidth, uptime, and device health, SNMP is ideal. It, however, doesn’t provide a thorough grasp of your applications. Middleware fixes that. When combined, SNMP provides hardware-level visibility while Middleware adds application-level monitoring, giving full-stack observability.
Middleware gives you stack-wide observability by collecting metrics, logs, and distributed traces from your apps.
When used together:
- Middleware monitors apps, APIs, and services on infrastructure.
- Then SNMP monitors physical and network devices.
Both will provide a complete picture of your system, from physical hardware to app performance.
You can also link infrastructure and app behavior. For instance, SNMP will detect CPU usage, and Middleware will show whether it’s affecting response time or user experience.
Conclusion
SNMP monitors network performance, hardware, and uptime. But you need complete observability to see everything across servers, APIs, and apps.
Middleware offers a centralized platform for tracking service dependencies, user experience, and application performance.
FAQs
What does SNMP mean?
SNMP (Simple Network Management Protocol) is a standard protocol for monitoring networks, managing devices, and collecting performance metrics from routers, switches, servers, and more.
Which version of SNMP is the most secure?
The most secure option is SNMP3. Authentication and access controls protect the data.
What are traps in SNMP?
SNMP traps are messages a device sends to the manager whenever a significant event occurs.
What kind of devices can SNMP monitor?
SNMP can monitor many devices, including routers, switches, firewalls, servers, storage systems, printers, and UPS units.
How does SNMP find problems in networks?
Trap alerts and real-time polling detect network issues and warn the manager about performance drops or failures.


