Getting AI models into production is one challenge. Knowing what they do once they’re there is another. Every inference request carries information you need: latency, token usage, model behavior, finish reason. But wiring observability into each model and provider usually means repetitive, custom instrumentation for every integration.
We built Middleware to remove that work. With the TrueFoundry AI Gateway integration, every inference request your teams send becomes a structured, queryable event in Middleware, correlated with the infrastructure metrics, traces, and logs from the rest of your stack, all in one place. No per-model engineering required.
Why this matters
As AI adoption grows, the hard part is no longer reaching the models. It’s managing what comes after: multiple providers, changing APIs, and compliance requirements that pile up fast. You can get a model running and still have no clear view of how it behaves under real traffic.
Middleware already provides engineering teams with a single pane of glass and a consolidated view of their systems, giving them complete visibility. This integration extends that view to AI inference, so gateway traffic shows up alongside everything else you monitor, with no extra dashboards to switch between.
Middleware: full-stack observability built on OpenTelemetry
Middleware is a full-stack observability platform built on OpenTelemetry as its core instrumentation standard. It accepts traces, logs, infrastructure metrics, and real user monitoring through the OTel Collector and stores them in a single correlated data layer, giving teams a complete picture of their systems in one place.
What sets Middleware apart is what happens after a trace arrives. Instead of storing spans in isolation, Middleware correlates them with infrastructure signals from the host or cluster running the service.
An engineer investigating a latency spike in a gateway span can move straight from the trace to CPU and memory metrics for that pod, without changing dashboards.
Middleware also builds a live service topology map from incoming spans, so every instrumented service appears as a node with latency and error rate computed automatically. When combined with Middleware’s LLM observability, you get inference and infrastructure data in a single, correlated view.
The TrueFoundry AI Gateway
The TrueFoundry AI Gateway is a control plane for enterprise AI. It unifies access to hundreds of large language models, handles smart routing, and enforces policy centrally, all without requiring changes to the applications calling it. A single gateway pod handles more than 250 requests per second while adding roughly 3 ms of latency, so it’s production-grade from day one.
Critically for observability, the gateway emits OpenTelemetry-compliant data across every model and environment. That makes it a natural fit for Middleware’s OTel-native backend; the two speak the same language with no translation layer in between.
Better together: complete visibility, zero custom instrumentation
With this integration, every inference request that passes through the TrueFoundry AI Gateway automatically generates a structured set of OpenTelemetry spans. Each span carries prompt content, completion content, token counts, model name, latency, and finish reason as queryable attributes, then flows asynchronously to Middleware over OTLP/HTTP.
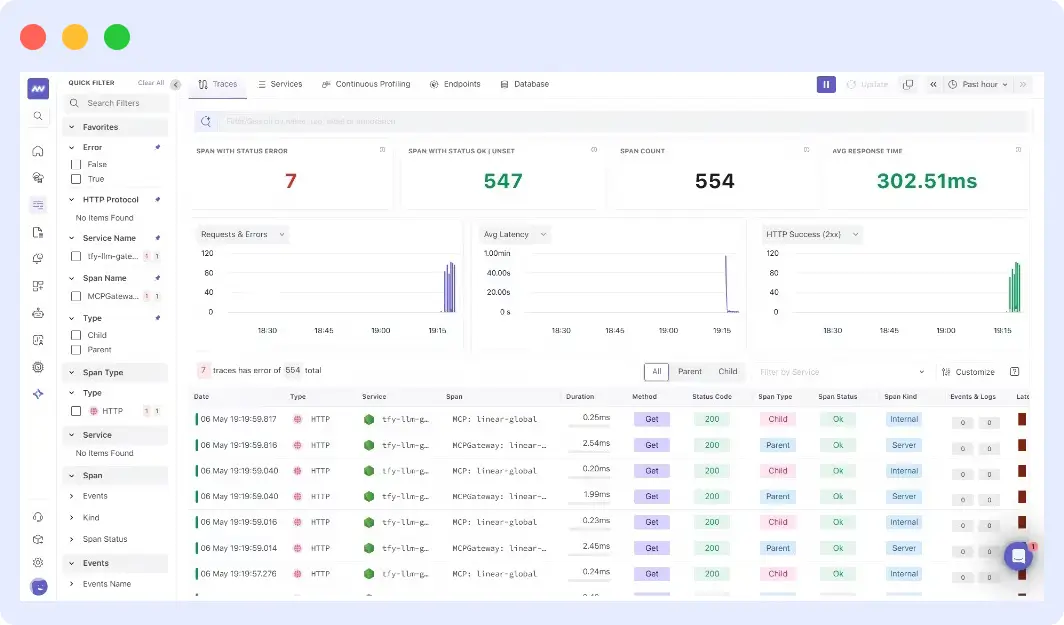
Middleware ingests those spans alongside the rest of your infrastructure telemetry. Gateway traffic becomes a first-class service in your topology map and APM views, sitting right next to the application services that call it. You can filter by model name or token count and trace an inference request the same way you’d trace any other request in your stack.
For teams handling sensitive data, the gateway’s Exclude Request Data toggle strips prompt and completion content from span attributes before export.
Token counts, latency, and model metadata are retained regardless, so you keep full operational visibility without exposing user inputs to external systems. And for strict network egress requirements, the gateway exporter can point at a self-managed OpenTelemetry Collector that forwards to Middleware, changing nothing but the endpoint URL.
From visibility to resolution with OpsAI
Seeing inference traffic is the first step. Acting on it is the next. Because gateway spans land in the same correlated data layer as the rest of your telemetry, they become first-party context for OpsAI, Middleware’s AI-native SRE agent. OpsAI detects, diagnoses, and resolves production issues across APM, RUM, logs, infrastructure, and Kubernetes, and it now treats AI inference as part of that same picture.
That matters when an LLM-backed service starts misbehaving. A latency spike on a gateway span, a jump in token usage, or a pattern of unexpected finish reasons is no longer an isolated signal: OpsAI can correlate it with the surrounding infrastructure and application telemetry, identify the root cause, and ship a pull request with the fix. Because OpsAI reads this data first-party rather than through third-party APIs, it works from the same source of truth that powers your dashboards.
Middleware runs OpsAI on its own production, where it resolves more than 80% of issues automatically. In customer beta accounts, it has reached a detection-to-resolution rate above 90% and delivered roughly 10× faster response times than competing AI SRE agents. Connecting the TrueFoundry AI Gateway brings your inference layer under that same agentic coverage.
How the trace flow works
Middleware and the TrueFoundry AI Gateway work together without adding anything to your inference path:
- Your application sends an inference request to the gateway, which handles authentication, model resolution, and routing entirely in memory. No external calls happen in the critical path.
- The gateway forwards the request to the configured LLM provider, the only external call in the request path, and returns the response to your application immediately.
- After the response is delivered, the gateway asynchronously publishes the full trace event to an internal NATS bus. Export happens entirely outside the request path, so inference latency is never affected by OTel endpoint availability or slowness.
- A dedicated OTel exporter reads from the bus, serializes the spans as a protobuf-encoded OTLP/HTTP payload, and sends them to your Middleware tenant endpoint with your Middleware API key in the Authorization header.
- Middleware receives the payload at its OTLP ingest layer and stores the spans in its correlated backend, where they’re immediately queryable alongside logs, infrastructure metrics, and APM data for the rest of your stack.
Setting it up
Configuration is closer to flipping a switch than running an engineering project. In the TrueFoundry dashboard, go to AI Engineering, then Settings, then OTEL Config.
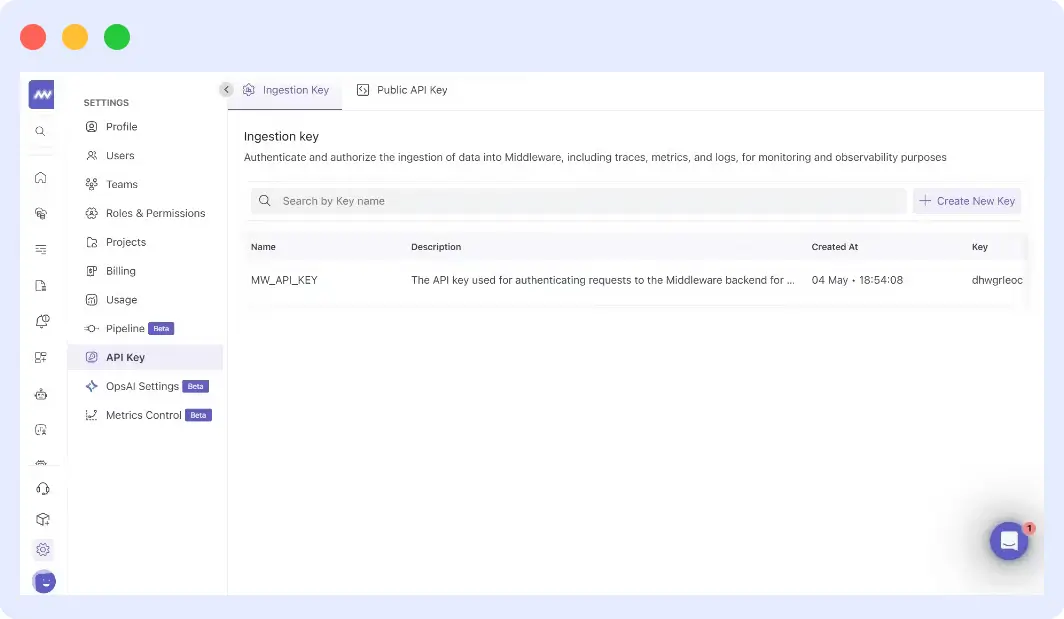
Enter your Middleware tenant endpoint and API key, set the protocol to HTTP with protobuf encoding, and save.
From that moment, your inference traffic is visible in Middleware, correlated with infrastructure signals, filterable by model name or token count, and mapped into a live service topology.
Get started
AI observability doesn’t have to mean complex instrumentation work. Connect your TrueFoundry gateway to Middleware and turn every inference request into a structured, queryable observability event. To learn more, see the Middleware documentation for integration reference.
Getting AI models into production is one challenge. Knowing what they do once they’re there is another. Every inference request carries information you need: latency, token usage, model behavior and finish reason. But wiring observability into each model and provider usually means repetitive, custom instrumentation for every integration.