With over 40 years on the data processing market, Oracle is a leading database for online transaction processing and data warehousing. Designed for enterprise grid computing, Oracle manages information, applications and provides logical data storage using tablespaces. It is used by Wells Fargo, Samsung Electronics, Honeywell, among others.
If you are having a bad day with your Oracle database performance, this article will put an end to it. In this article, we highlight key oracle database metrics to keep a tab on for root-cause analysis and optimum performance. We also explore top monitoring tools that will help you simplify the monitoring exercise.
What is Oracle?
Oracle is a feature-rich relational database management system (RDBMS) known for its scalability, reliability, security features, and comprehensive toolset. It supports a rich data model that includes relational tables, views, sequences, indexes, and constraints for structuring and organizing data.
Oracle also supports advanced data types such as LOBs, XML, spatial data, multimedia data, and JSON data. It uses SQL as the standard language for interacting with the database, while also supporting PL/SQL, a procedural language extension to SQL that allows developers to create stored procedures, functions, and triggers within the database.
An Oracle instance consists of a set of memory structures and background processes and tasks such as data caching, query processing, and transaction management. In the Oracle database, there are physical data files that store the actual data, control files containing metadata about the database, and redo logs that record changes made to the database.
Oracle provides features like Real Application Clusters (RAC), Data Guard, and Automatic Storage Management (ASM) for achieving high availability and disaster recovery capabilities.
Oracle supports both vertical and horizontal scalability through features like partitioning, parallel execution, and distributed databases, allowing developers to handle growing data volumes and user loads.
Alongside security features such as user authentication, role-based access control, encryption, and auditing, it also provides utilities for backup and recovery, data replication, data compression, and data archival to ensure data availability, reliability, and compliance with regulatory requirements.
Oracle’s comprehensive toolsets for database administration and performance tuning include SQL*Plus, SQL Developer, Enterprise Manager, Data Pump, and many others to streamline database management tasks.
Why is monitoring OracleDB important?
Monitoring OracleDB is important for the following reasons:
Capacity planning
Monitoring resource utilization trends over time enables you to anticipate future capacity requirements and help you plan accordingly. This ensures that the database has sufficient resources to handle growing data volumes and user demands.
Troubleshooting
Monitoring allows you to quickly detect and fix problems with your database, such as errors, failures, and performance issues. This helps you minimize downtime and maintain the reliability of the database. It also helps you identify slow-performing queries, resource bottlenecks, and other issues that can impact the database’s performance.
Cost efficiency
Effective monitoring helps you optimize resource usage, identify unused or underutilized resources, and avoid unnecessary expenditures on hardware or software. This leads to cost savings and a more efficient use of resources.
Security and compliance
Continuous monitoring of your Oracle database helps you detect unauthorized access, unusual activity, and security breaches in real-time. It also ensures that the database complies with data security regulations and internal policies.

Key OracleDB metrics you should be monitoring
The following are key OracleDB metrics you should be monitoring. Monitoring them enables you to proactively manage your database performance, detect issues early, and optimize system efficiency.
Oracledb.cpu_time
This metric represents the total amount of CPU time consumed by the Oracle database. Monitoring it helps you understand the workload on the database server. High CPU time usage could indicate inefficient queries, resource contention, or a need for additional hardware resources.
When you keep a tab on this metric, you’ll understand how to optimize query performance, identify the root cause of bottlenecks, and ensure that the database functions efficiently.
Oracledb.enqueue_deadlocks
This metric indicates the number of deadlocks that occur during enqueue operations in the Oracle database. Monitoring enqueue deadlocks helps you identify concurrency issues within the database.
Deadlocks lead to performance degradation and application errors. By tracking this metric, you’ll proactively address locking conflicts, optimize transaction management, and prevent application downtime.
Oracledb.exchange_deadlocks
This metric reflects the number of exchange deadlocks encountered in the Oracle database, especially as it relates to parallel query operations. Monitoring exchange deadlocks helps you detect and resolve parallel processing issues.
Exchange deadlocks impact query performance and scalability, thus, monitoring it enables you to fine-tune parallel query settings, optimize resource allocation, and ensure smooth data processing in the database.
Oracledb.logical_reads
This metric measures the number of data blocks read from the buffer cache during query execution. Monitoring the metric provides insight into the efficiency of data retrieval operations.
High numbers of logical reads indicates inefficient SQL queries, missing indexes, or database design issues. Tracking this metric enables you to optimize query performance, implement appropriate indexing strategies, and reduce I/O overhead.
Oracledb.hard_parses
This metric represents the number of times SQL statements are hard-parsed in the Oracle database. Hard parses are resource-intensive operations that impact database responsiveness.
When you monitor hard parses, you’ll easily identify poorly performing SQL statements, promote SQL plan reuse, and enhance overall system efficiency.
Oracledb.parse_calls
This metric indicates the total number of parse calls made to the Oracle database. Monitoring parse calls provides insights into the workload generated by SQL statement parsing.
Excessive parse calls often result in CPU overhead and reduced performance. Tracking this metric enables you to optimize query caching, encourages statement reusability, and minimizes parsing-related bottlenecks.
Top 5 OracleDB monitoring tools
Here are the top 5 Oracle database monitoring tools to look out for, along with their key features which will help you monitor, troubleshoot, and optimize the performance of your database:
Middleware
Middleware is a full-stack observability platform that offers centralized monitoring for infrastructure and applications. It provides monitoring capabilities for databases, including Oracle Database and its various components.
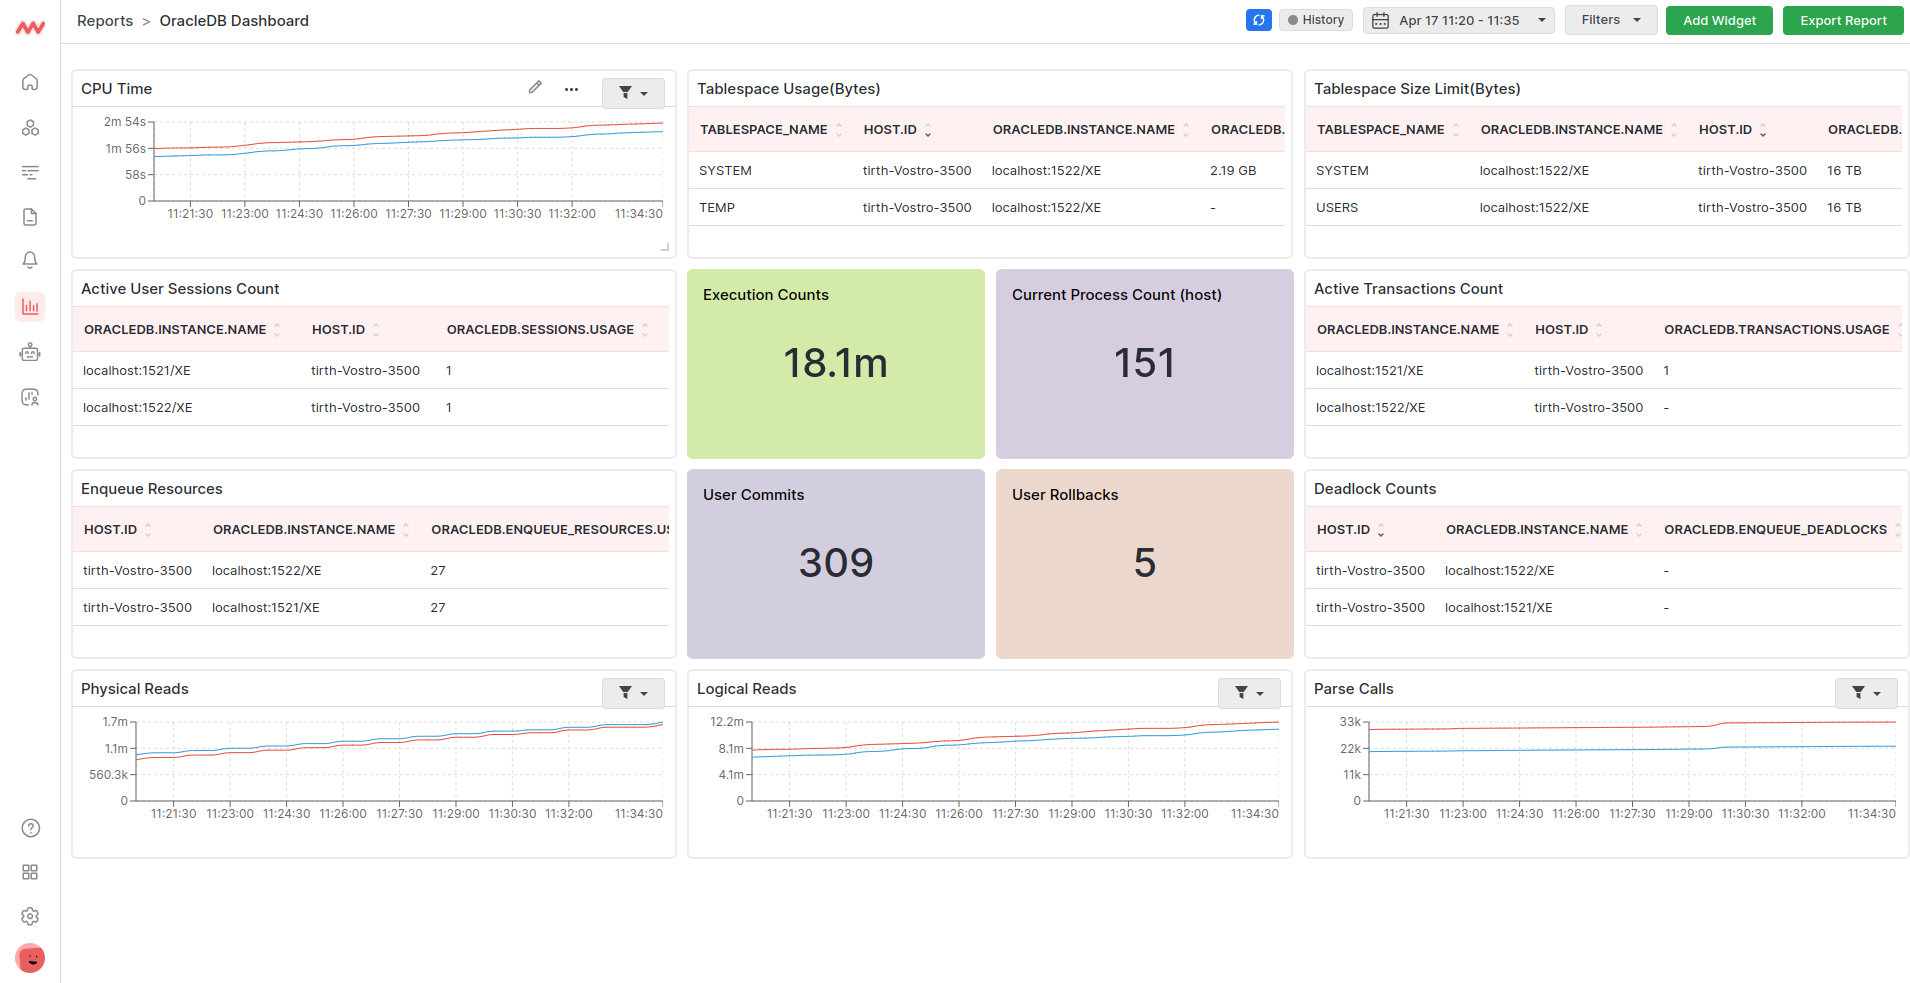
Middleware database monitoring captures performance metrics such as CPU utilization, memory usage, query execution times, resource utilization, and much more.
It dives deep into key metrics such as oracledb.cpu_time, oracledb.exchange_deadlocks, oracledb.enqueue_deadlocks, oracledb.hard_parses, oracledb.enqueue_locks.usage, oracledb.enqueue_resources.limit, oracledb.blocks_gets, oracledb.consistent_gets, among others.
With its user-friendly dashboard, Middleware provides end-to-end visibility into the performance of your Oracle database system.
While offering correlation of metrics for in-depth analysis, Middleware also provides a causation-to-correlation feature that spots when an issue begins and where it ends.
Read the Middleware Oracle Integration doc for more information.
Features
- Customizable dashboard.
- Real-time monitoring of performance metrics.
- Historical performance data analysis.
- Alerting and notification capabilities.
Pricing
Middleware pricing varies based on the number of infrastructure and APM hosts. It offers a free 14-day trial that allows you to monitor as many servers as you like.
Datadog
Datadog is a comprehensive monitoring tool for infrastructure and applications. It provides health and performance metrics for databases, including Oracle, in near real-time.
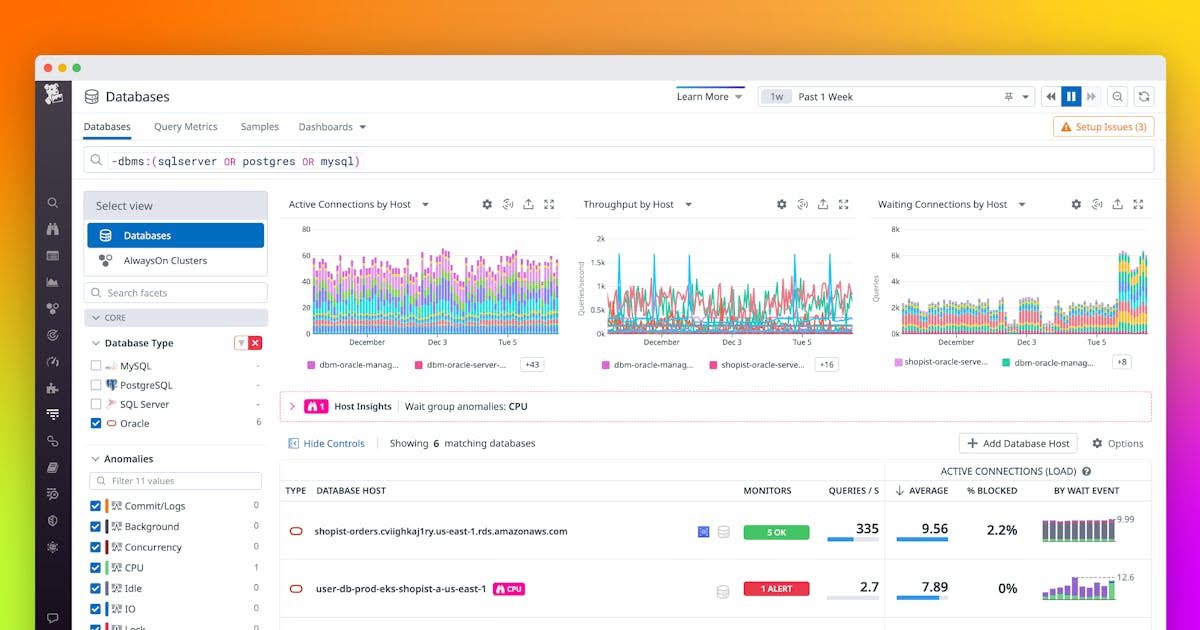
Datadog enables you to visualize these metrics through its dashboard and alerts you on your Oracle database states.
In addition to the standard integration features, Datadog provides query-level metrics, live and historical query snapshots, wait event analysis, database load, query explain plans, and blocking query insights.
Features
- Real-time performance monitoring.
- Customizable dashboards.
- Automatic anomaly detection.
- Integration with 200+ database tools.
Pricing
Datadog offers multiple pricing plans based on the number of hosts and features required. Custom pricing is however available for large enterprises.
New Relic
New Relic provides monitoring and observability for cloud-native applications and infrastructure. It offers deep insights into the health and behavior of databases, including Oracle.
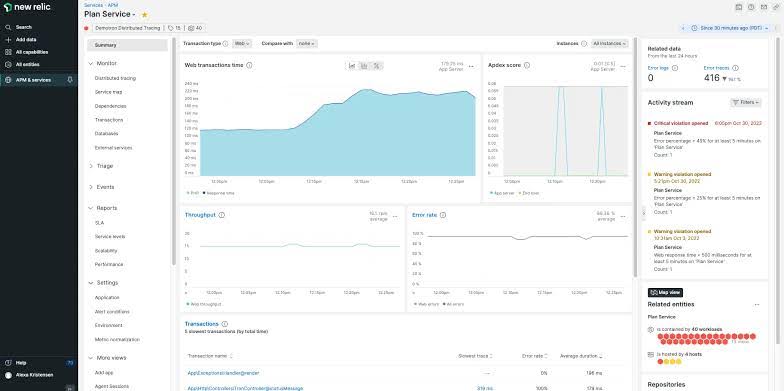
New Relic’s Oracle monitoring collects key performance metrics on the database instances, and you can customize your configuration to collect even more metrics, giving you a detailed characterization of database performance. With its customizable dashboard, you can perform the “slice and dice” operations on your database metrics.
Features
- End-to-end performance monitoring.
- Transaction monitoring and resource utilization tracking.
- Anomaly detection and alerting.
- Integration with Oracle monitoring plugins and extensions.
Pricing
New Relic pricing varies based on the selected product and features.
SigNoz
SigNoz is an open-source data observability and performance monitoring tool. It helps you monitor your system and databases, including Oracle, and troubleshoot problems.
SigNoz provides deep visibility into performance metrics and displays the data on its customizable dashboard, using graphs or flowcharts. Its metrics include availability, table sizes, cache ratios, and other key metrics.
Features
- Performance metrics visualization.
- Anomaly detection.
- Root cause analysis.
- Community-driven development and support.
Pricing
SigNoz follows an open-source model. It offers a free self-hosted version and a paid managed service option based on the volume of data and features required.
Site24x7
Site24x7 is a cloud-based infrastructure and application monitoring tool. It monitors all kinds of databases and has a specialized screen for Oracle monitoring.
Site24x7 automatically detects all database instances within an environment and continuously monitors their performance. It also monitors the underlying system for the database and makes optimization recommendations.
Features
- Threshold-based alerting and notification.
- Customizable dashboard.
- Automatic database discovery.
- Reporting and analytics capabilities.
Pricing
Site24x7 offers free monitoring service for five servers, and a paid subscription that has a 30-day free trial.
Conclusion
Database monitoring involves monitoring which ensures optimum performance and management. The right Oracle monitoring tool must combine both functions for unified and centralized observability.
Middleware executes these qualities effortlessly by offering root-cause analysis of database performance, and showing you who did what and when it occurred.
Try Middleware today for a firsthand experience of its monitoring deftness.