Windows error logs won’t tell you why a server is failing until you know exactly where to look, and Event Viewer’s Application, System, and Security channels bury the signal in noise fast. This guide shows you which Event IDs actually matter, how to query them with PowerShell, and how to go from alert to root cause without switching between five different tools.
Key takeaways
- Windows error logs are viewed through Event Viewer (eventvwr.msc) or queried with PowerShell’s Get-WinEvent
- The three core log channels are Application, System, and Security, each capturing a different failure layer
- Log files live at C:\Windows\System32\winevt\Logs\, with WER crash dumps stored separately
- Start troubleshooting from the Event ID: 1000 (app crash), 7034 (service crash), 41 (unexpected reboot), and 4625 (failed login) cover most production incidents
- Filter to Error and Critical levels only, then match timestamps to metrics spikes to find root cause faster
- Match log timestamps to metrics spikes to find root cause — or use Middleware to do both in one place
- Middleware centralizes Windows Event Logs with infrastructure metrics in one dashboard, cutting multi-server correlation from 15-20 minutes to a few
What Are Windows Error Logs?
Windows error logs are structured records captured by the Windows operating system whenever an application fails, a service crashes, or a system-level event requires tracking. Each entry contains a timestamp, severity level, event source, Event ID, and a message describing what happened.
When something breaks in production, CPU spikes, services going down and 500 errors metrics show the symptoms. Windows error logs show the cause.
The three main Windows log types
- Application logs: Errors from software and services running on Windows. This is where application crashes (Event ID 1000) and .NET exceptions (Event ID 1026) appear. For a deeper look at how application-level logging works across platforms, see Application Logs 101: Essential Knowledge for Developers.
- System logs: Operating system events, service failures, driver issues, hardware problems and unexpected shutdowns.
- Security logs: Authentication attempts, permission changes, logon failures (Event ID 4625), and share access denials (Event ID 5145).
Other log types worth knowing
- Setup logs: Capture Windows Update activity and installation events critical for diagnosing post-update breakages.
- Forwarded Events: Aggregated logs from remote machines, only present when centralized log forwarding is configured.
- Custom application logs: Products like IIS, SQL Server, and Exchange write to their own event channels.
Event severity levels
Windows assigns every event log entry one of four severity levels. For a full breakdown of how log levels work across any platform, see the log levels guide.
| Level | Meaning |
|---|---|
| Information | Routine activity, no action needed |
| Warning | Potential issue, worth reviewing |
| Error | A failure occurred |
| Critical | Severe failure requiring immediate attention |
Where are Windows error logs stored?
Windows error logs are stored in two locations, depending on the type:
- Event log files (.evtx):
C:\Windows\System32\winevt\Logs\This is where Application.evtx, System.evtx, Security.evtx, and all custom log files reside on disk. - Windows Error Reporting (WER) crash dumps:
C:\ProgramData\Microsoft\Windows\WER\contains crash report files generated by Dr. Watson and Windows Error Reporting.
You don’t usually need to browse these directories directly. Event Viewer and PowerShell read from these files and present the data in a structured, filterable format. The file path matters most when you need to export logs from a machine for external analysis or when using tools that ingest raw .evtx files. For a broader look at how log monitoring works across an entire stack, see What is Log Monitoring?
Windows Error Reporting logs location
Windows Error Reporting (WER) creates a local report each time an application crashes. Reports are stored at C:\ProgramData\Microsoft\Windows\WER\ReportArchive\ and C:\Users\[username]\AppData\Local\Microsoft\Windows\WER\. These reports supplement what you see in Event Viewer and can contain minidump files useful for deeper crash analysis.
How to Access Windows Error Logs
There are two primary methods: Event Viewer (GUI) for manual investigation, and PowerShell for programmatic querying and automation.
Method 1: Using Event Viewer (GUI)
Event Viewer is the built-in Windows tool for browsing logs interactively. Here’s how to open it:
- Press Win + R, type
eventvwr.msc, and press Enter - Or search for Event Viewer in the Start menu
- Or go to Control Panel → Administrative Tools → Event Viewer
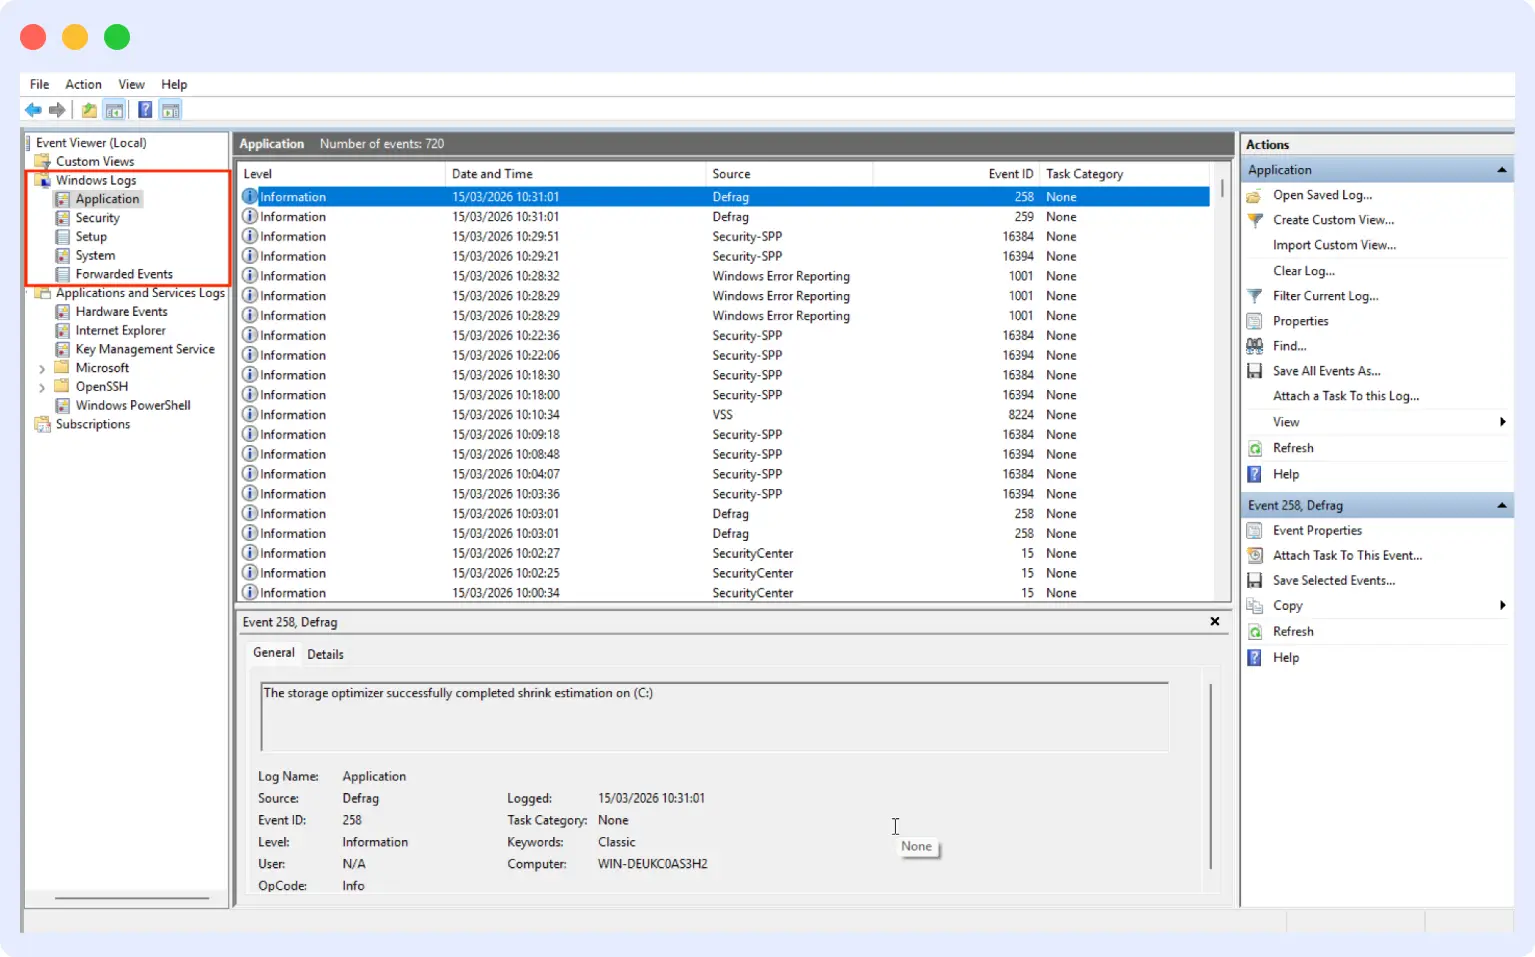
Once open, expand Windows Logs in the left panel. You’ll see: Application, Security, Setup, System, and Forwarded Events. Selecting any category shows its entries in the center panel, with details in the bottom pane when you click an entry.
Method 2: Using PowerShell
PowerShell gives you more precise filtering and is essential for remote systems or automation pipelines. Windows includes two commands:
Get-EventLog— older, simpler, works on older Windows versionsGet-WinEvent— newer, more powerful, preferred for Windows 10/11 and Server
Get the latest 10 errors from the Application log:
Get-EventLog -LogName Application -Newest 10 -EntryType ErrorFilter by time window and severity using Get-WinEvent:
Get-WinEvent -FilterHashtable @{
    LogName='Application'
    Level=2
    StartTime=(Get-Date).AddDays(-1)
}
Level values: 1 = Critical, 2 = Error, 3 = Warning
Listing all available event channels
Not all logs appear in Event Viewer by default. Applications create their own private event channels. To see everything on your system:
Get-WinEvent -ListLog *Sort by record count to find the most active logs:
Get-WinEvent -ListLog * | Sort-Object RecordCount -DescendingHow to check error logs on Windows 11
The process for checking error logs on Windows 11 is the same as in Windows 10, but the Start menu search is slightly different:
- Click the Start button or press the Windows key
- Type Event Viewer and click the result
- Expand Windows Logs in the left sidebar
- Select Application for app crashes, or System for OS and service failures
- Click any entry to see its details — focus on the Event ID and General tab message
To find only errors and critical events on Windows 11:
- Right-click the log (e.g., System) → Filter Current Log
- Under “Event level”, check Critical and Error
- Set a time range matching when the issue occurred
- Click OK
Windows 11 error logs location
Error log files on Windows 11 are stored at C:\Windows\System32\winevt\Logs\. The upgrade log for Windows 11 is found at C:\Windows\Panther\setupact.log — useful if you’re troubleshooting upgrade failures.
Windows 11 upgrade error logs
If a Windows 11 upgrade fails, check these locations:
C:\Windows\Panther\setupact.log— setup activityC:\Windows\Panther\setuperr.log— setup errorsC:\$WINDOWS.~BT\Sources\Panther\— upgrade staging logs
How to check error logs on Windows 10
On Windows 10, access Event Viewer through any of these methods:
- Press Win + X → select Event Viewer from the quick menu
- Press Win + R → type
eventvwr.msc→ Enter - Search “Event Viewer” in the Start menu
For Windows 10 blue screen error logs, look in the System log for Event ID 41 (Kernel-Power) or Event ID 1001 (BugCheck). These appear after unexpected restarts.
Windows 10 error logs location
Same as Windows 11: C:\Windows\System32\winevt\Logs\. Windows 10 update error logs are at C:\Windows\Logs\CBS\CBS.log and C:\Windows\SoftwareDistribution\ReportingEvents.log.
How to check error logs on Windows 7
On Windows 7, Event Viewer works the same way: Start → search “Event Viewer” or run eventvwr.msc. Windows 7 error logs are stored at the same default path. Note that Get-WinEvent is available from Windows 7 SP1 onwards. Windows 7 logs location: C:\Windows\System32\winevt\Logs\.
How to filter and search Windows event logs
Event logs can contain thousands of entries. Filtering is what makes them actionable during an incident.
Filtering in Event Viewer
Event Viewer provides built-in filters for narrowing down log entries. Right-click a log (for example, Application or System) and select Filter Current Log.
- Right-click a log (e.g., Application or System)
- Select Filter Current Log
- Set your time range, event levels (Critical, Error), and Event IDs
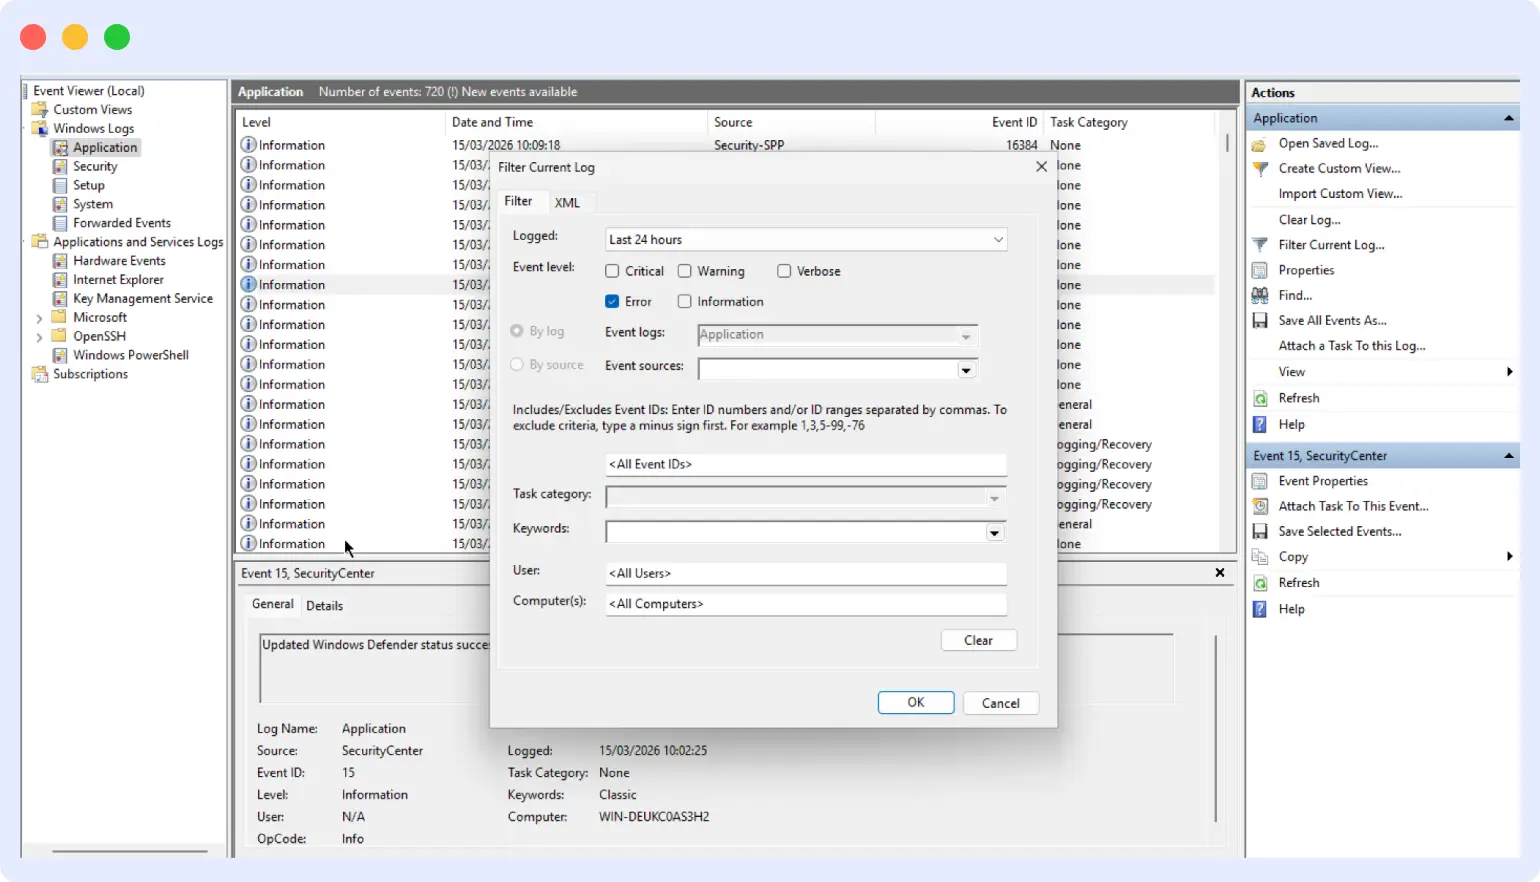
To filter by multiple Event IDs, enter them comma-separated: 1000, 1026, 7034
Filtering with PowerShell
PowerShell allows more precise and repeatable filtering. The `Get-WinEvent` command supports multiple conditions using `-FilterHashtable`.
Example:
Critical and Error events from System log, last 7 days:
Get-WinEvent -FilterHashtable @{
    LogName='System'
    Level=1,2
    StartTime=(Get-Date).AddDays(-7)
}
Filter for service crashes (Event ID 7034) from last 3 days:
Get-WinEvent -FilterHashtable @{
    LogName='System'
    ID=7034
    StartTime=(Get-Date).AddDays(-3)
}
Multiple Event IDs:
Get-WinEvent -FilterHashtable @{
    LogName='System'
    ID=1000,1026,7034
    StartTime=(Get-Date).AddDays(-7)
}
Creating custom views in Event Viewer
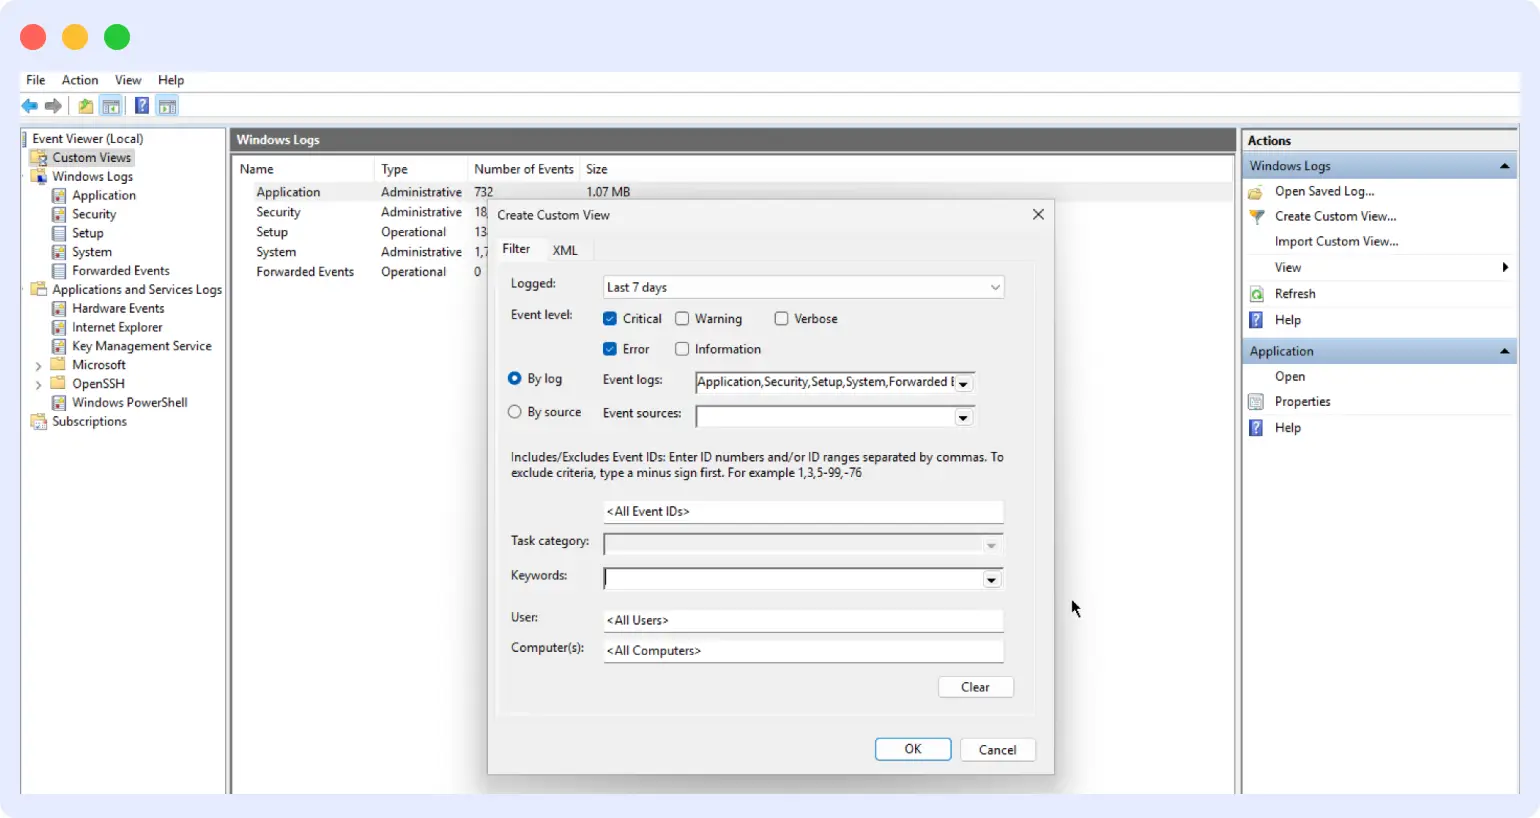
If you check the same filters repeatedly, save them as a Custom View:
- Click Create Custom View in the right panel
- Define your filters (e.g., Error and Critical from Application and System, last 7 days)
- Name and save the view
The saved view is always accessible in the left panel no need to reapply filters manually.
Advanced search with XPath
For searching inside event message content, use XPath queries. In Event Viewer, open Filter Current Log → switch to the XML tab and replace the query:
<QueryList>
  <Query Id="0" Path="Application">
    <Select Path="Application">*[EventData[Data and contains(Data, 'database')]]</Select>
  </Query>
</QueryList>
In PowerShell:
Get-WinEvent -LogName Application -FilterXPath "*[System[EventID=1000] and EventData[Data='MyApp.exe']]"Use XPath only when standard filters are not sufficient.
How to export Windows error logs
To export from Event Viewer: right-click any log → Save All Events As → choose .evtx (re-importable), .csv, .txt, or .xml. From PowerShell, export to CSV:
Get-WinEvent -FilterHashtable @{LogName='System';Level=1,2} |
  Export-Csv -Path "C:\logs\system-errors.csv" -NoTypeInformation
How to delete Windows error logs
To clear a log in Event Viewer: right-click the log → Clear Log. You’ll be prompted to save before clearing. To clear via PowerShell:
Clear-EventLog -LogName Application
Clear-EventLog -LogName System
Note: clearing logs removes all history for that channel. Only do this intentionally not during an active investigation.
Understanding Windows event log entries
Every event log entry records a single event at a specific point in time. The fields that matter most during debugging:
- Event ID: The numeric code identifying the type of event. This is your fastest way to understand what happened.
- Timestamp: When the event was recorded. Match this to metrics spikes or alerts.
- Source: The application or Windows component that generated the event.
- Level: Information, Warning, Error, or Critical maps to standard log levels used across all logging systems.
- General (message): The actual error details faulting module, exception code, process name.
The Event ID is where to start. It tells you the category of problem and often the specific component involved, which lets you look up known causes quickly or filter for related events.
What does each part of the message tell you?
The message body typically includes the faulting application name, the faulting module (the DLL or component that caused the crash), an exception code (e.g., 0xc0000005 = access violation), and the process ID. For .NET errors in Event ID 1026, the full exception stack trace appears here critical for identifying the exact line of code that failed.
Troubleshooting common Windows errors using event logs
When something fails in production, certain Event IDs tend to show up more often than others. Seeing the same ones repeatedly usually points you in the right direction.
Application crashes — Event ID 1000 and 1026
Event ID 1000 appears whenever an application crashes with an unhandled exception. For .NET applications, Event ID 1026 almost always accompanies it with the full exception stack trace. Windows Application logs are one layer of application-level logging to understand how applications should be structured to log errors effectively in the first place. Read Application Logs 101.
In the message, look at:
- Faulting module: If it’s your application’s DLL, the issue is in your code or a recent deployment. If it points to
KERNELBASE.dllorntdll.dll, the problem may be how the application interacts with system libraries. - Exception code:
0xc0000005= access violation (memory issue).0xe0434352= .NET unhandled exception.0xc000000d= invalid parameter.
Check whether Event ID 1000 recurs on a patter at the same time of day, after specific actions, or following a deployment. Patterns narrow down the cause faster than a single entry.
Service failures — Event ID 7034, 7000, 7009
Service issues generate one of three Event IDs in the System log:
- 7034: Service terminated unexpectedly. The most common during production incidents.
- 7000: Service failed to start. Often a dependency or permissions issue.
- 7009: Service timed out during startup. Points to a hung dependency or resource contention.
For services that fail to start (7000), check that all dependent services are running and that the service account has the required permissions for files, registry keys, and external resources. For repeated crashes (7034), look at the service’s own log to see what happened immediately before termination.
System crashes and unexpected reboots — Event ID 1001, 41, 6008
Unexpected restarts generate a cluster of events:
- Event ID 41 (Kernel-Power): The system was not shut down cleanly before the last power cycle. The first event to look for after an unexplained reboot.
- Event ID 6008: The previous system shutdown was unexpected. Confirms the same — logged by Event Log service on the next boot.
- Event ID 1001 (BugCheck): A stop error (BSOD) occurred. The bug check code and parameters identify the root cause — driver issues, memory corruption, hardware failure.
If the system restarts under load, suspect resource exhaustion or failing hardware. If it’s random and infrequent, look at power supply stability or overheating. Blue screen error logs on Windows 10 and 11 will show Event ID 41 followed by 1001 if a minidump was captured.
Permission and access failures — Event ID 4625, 5145
Security log events surface authentication and access issues that commonly affect services in production:
- Event ID 4625: Failed logon attempt. Look at the logon type field — type 3 is network logon. The failure reason (e.g., “Unknown user name or bad password” vs. “Account locked out”) tells you whether it’s a credential problem or a policy issue.
- Event ID 5145: Network share access was denied. Check both share-level and NTFS-level permissions — access can be allowed at one layer and blocked at another.
These events frequently appear when services can’t connect to databases, file shares, or network resources. The account listed in the event is the one to investigate.
Windows task scheduler errors
Task Scheduler has its own event log channel under Applications and Services Logs → Microsoft → Windows → TaskScheduler → Operational. Filter for Level 2 (Error) to see failed tasks. Event ID 101 means a task failed to start; Event ID 103 means it was launched but the action failed.
IIS error logs on Windows
IIS writes access and error logs to C:\inetpub\logs\LogFiles\ by default. For IIS application pool crashes, check the System log for Event ID 7034 with source “IIS Worker Process” and the Application log for Event ID 1000 — both appear when an app pool terminates unexpectedly. IIS also has its own event channel: Windows Logs → Application → Source: IIS-W3SVC.
PHP error logs on Windows (XAMPP, WAMP)
PHP doesn’t write to Windows Event Logs by default. On XAMPP, Apache error logs are at C:\xampp\apache\logs\error.log. PHP error logging location is configured in php.ini via the error_log directive. To send PHP errors to Event Viewer, set error_log = syslog in php.ini.
MySQL error logs on Windows
MySQL on Windows writes errors to a .err file in the MySQL data directory (usually C:\ProgramData\MySQL\MySQL Server X.X\Data\). MySQL can also be configured to write to Windows Event Viewer by adding log_error_verbosity=3 and log_syslog=1 to my.ini.
Windows Event ID quick reference table
The Event IDs above show up frequently during production issues. This table summarizes the most common ones and what they indicate.
| Event ID | Log | Event name | Severity | What it means |
|---|---|---|---|---|
| 1000 | Application | Application Error | Error | Application crashed with unhandled exception |
| 1026 | Application | .NET Runtime Error | Error | .NET application threw unhandled exception — includes stack trace |
| 7034 | System | Service Crash | Error | Service terminated unexpectedly |
| 7000 | System | Service Start Failure | Error | Service failed to start |
| 7009 | System | Service Timeout | Error | Service took too long to start |
| 1001 | System | BugCheck (BSOD) | Critical | Blue screen stop error occurred |
| 41 | System | Kernel-Power | Critical | Unexpected shutdown or power loss |
| 6008 | System | EventLog | Warning | Previous shutdown was unclean |
| 4625 | Security | Logon Failure | Warning | Failed login attempt |
| 5145 | Security | Share Access Denied | Warning | Network share access denied |
| 101 | Task Scheduler | Task Launch Failure | Error | Scheduled task failed to start |
| 4776 | Security | Credential Validation | Warning | Domain credential validation failed |
| 4771 | Security | Kerberos Pre-auth Failed | Warning | Account pre-authentication failure |
Using Windows event logs with Middleware
Checking logs through Event Viewer works fine for a single machine. When you’re managing multiple Windows servers, the process breaks down: you connect to each machine separately, open Event Viewer manually, and try to correlate timestamps across systems during an active incident. That back-and-forth typically adds 15–20 minutes to every investigation.
Middleware centralizes Windows Event Logs from all your servers into a single dashboard alongside CPU, memory, disk, and network metrics so you can move from alert to root cause without switching tools. For a full overview of Windows Server monitoring beyond event logs, see Windows Server Monitoring: Challenges, Tools and Best Practices.
How Middleware collects Windows event logs
Middleware uses the Windows host agent, the same one used for infrastructure monitoring. Once installed, the agent reads from your configured Event Log channels (Application, System, Security, or custom channels) and forwards entries continuously to the Middleware platform.
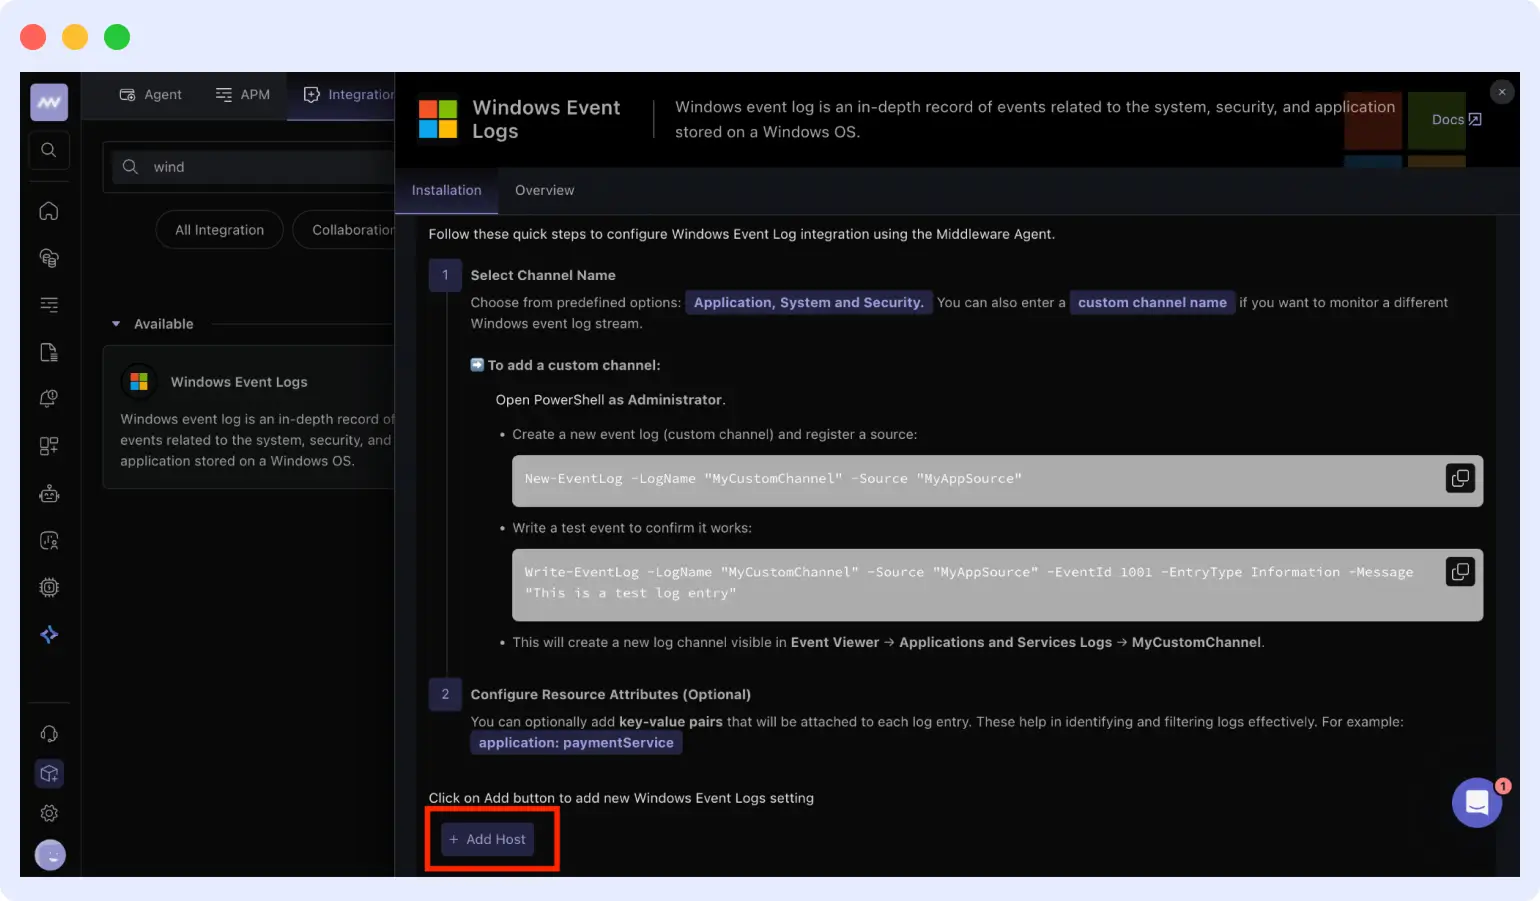
Configuration options include:
- Choosing which log channels to monitor
- Controlling collection frequency and filtering
- Organizing servers with tags for grouped views
No additional agent or separate log collector is required.
Debugging a production incident with Middleware
Here’s a realistic example. An alert fires at 14:47 — CPU at 92% on a Windows server running IIS.
- Narrow the time window: In Middleware’s Logs view, filter to 14:45–14:50.
- Filter to Error and Critical: Reduces noise immediately.
- Find the trigger: Event ID 7034 appears at 14:46:54 — IIS Worker Process stopped unexpectedly.
- Find the cause: Event ID 1000 at 14:46:52 shows an access violation in
app_pool.dll, which killed the worker process. - Correlate with metrics: CPU and memory spike at 14:47 as the system attempts to restart the pool — the timeline lines up.
- Next step: Review deployments or changes to
app_pool.dll.
With logs and metrics in the same view, this takes a few minutes. Without centralization, the same workflow connect to server, open Event Viewer, match timestamps to a separate metrics tool takes 15–20 minutes per incident.
Middleware OpsAI can also surface correlated log anomalies automatically during incidents, reducing the manual correlation step further.
Without Middleware
In a typical setup, the same investigation usually takes longer. You start with the monitoring dashboard, then connect to the server, open Event Viewer, and search through logs manually. Matching timestamps across tools takes time, especially when multiple systems are involved.
In practice, this back-and-forth can take 15 to 20 minutes for a single issue, compared to a few minutes when logs and metrics are available in one place.
Best practices for Windows event log monitoring
Once you start relying on Event Logs for debugging, a few practices make them easier to manage and more useful over time.
Configure log retention before you need it
Windows logs overwrite old entries when they hit the size limit (default: 20 MB). For production systems, this is almost always too small.
- Right-click any log in Event Viewer → Properties → set maximum log size
- Application and System logs on busy servers: 50–100 MB
- Security logs: 100 MB or more if you’re auditing everything
- Retention policy: “Overwrite events as needed” is safe for most cases; “Archive the log when full” keeps history but requires managing archived files
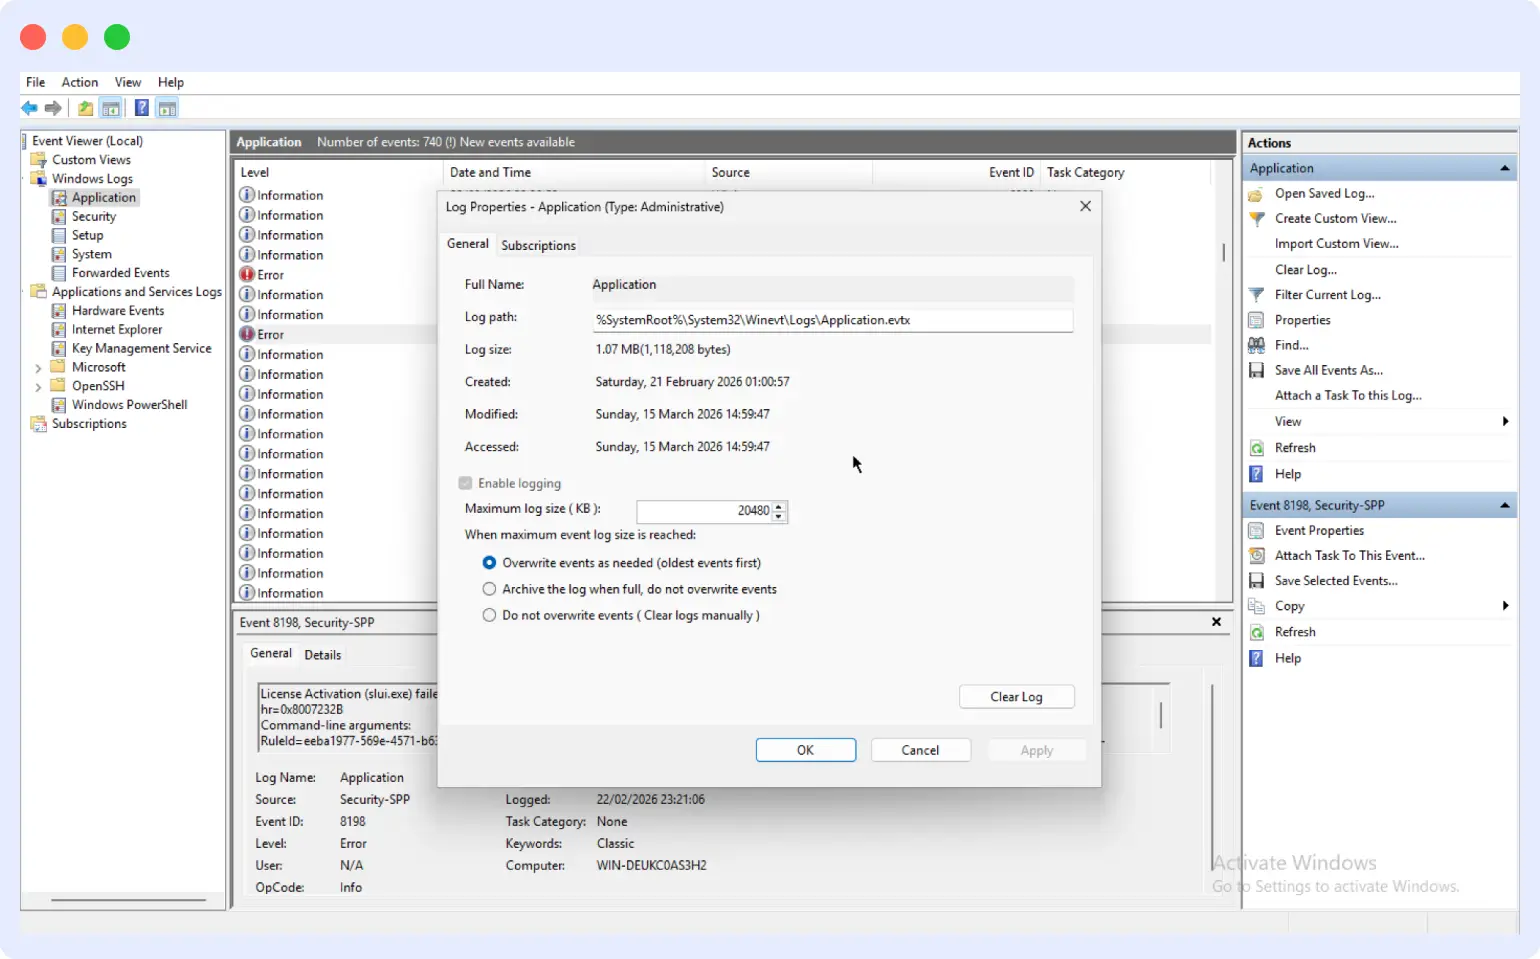
Choose how Windows handles full logs. “Overwrite events as needed” works for most cases. “Archive the log when full” keeps old logs but creates new files you’ll need to manage. “Do not overwrite events” stops logging when full, which can cause problems if you forget to clear it.
Filter what you monitor, not everything is signal
Effective log monitoring starts with reducing noise. The same principle applies whether you’re watching Windows Event Logs or a full infrastructure stack for a broader framework, see What is Infrastructure Monitoring?
- Always monitor: Application and System logs, Error and Critical levels only
- Conditional: Security logs only when troubleshooting authentication or access issues (very high volume otherwise)
- Application-specific: IIS, SQL Server, Exchange, monitor if those services are production-critical
- Skip: Information and Warning events in daily monitoring have too much noise; pull them only during active troubleshooting
Write custom application errors to Event Log
Custom applications on Windows can write directly to the Event Log instead of separate files. Register your application as an event source, then use the appropriate logging library for your language (e.g., System.Diagnostics.EventLog in .NET, win32evtlog in Python). Once configured, application errors appear in the Application log alongside system errors and can be filtered and alerted on like any other Event ID.
Secure your event logs
- Don’t log passwords, tokens, connection strings with credentials, or sensitive user data in custom application events
- Sanitize log messages before writing them
- Restrict Security log access by default only Administrators can read it; keep it that way unless compliance requirements demand broader access
- Use Windows Event Forwarding (WEF) to centralize logs to a collector server, rather than granting remote Event Viewer access to production machines
Set up alerts on critical Event IDs
Don’t rely on manual log reviews for production systems. Set up alerts on:
- Event ID 7034 — any service crash
- Event ID 41 — any unexpected restart
- Event ID 1000 — application crash (filter to your critical services)
- Event ID 4625 — failed logons (alert on volume spikes for brute-force detection)
Middleware supports alerting on log patterns and Event IDs directly, so you’re notified before issues escalate. See Middleware Log Monitoring for how alerting and ingestion work, or explore the best log monitoring tools to see how your current setup compares.
Stop checking Windows servers one by one
Windows Event Logs tell you why systems fail, not just that they did. But manually correlating logs across multiple servers using separate metrics tools significantly slows incident response.
Middleware brings Windows event logs, infrastructure metrics, and distributed traces into a single platform. Configure your log channels once, and every server’s errors are searchable in one place alongside the CPU and memory data that surrounds them.
Get started with Middleware free → | View Windows integration docs →
FAQs
How do I access Windows error logs?
Press Win + R, type eventvwr.msc, and press Enter to open Event Viewer. Alternatively, search “Event Viewer” in the Start menu. For command-line access, use Get-WinEvent or Get-EventLog in PowerShell. Event log files are stored at C:\Windows\System32\winevt\Logs\.
How do I check error logs on Windows 11?
Search for “Event Viewer” in the Start menu → expand Windows Logs → select Application or System. Right-click the log and choose “Filter Current Log” to narrow results to Error and Critical events within a specific time range. Windows 11 error logs are stored at C:\Windows\System32\winevt\Logs\.
How do I find error logs on Windows 10?
Press Win + X and select Event Viewer, or run eventvwr.msc. Navigate to Windows Logs → Application for application errors or System for OS and service failures. Windows 10 error logs are at the same location: C:\Windows\System32\winevt\Logs\.
What are the most important Event IDs to monitor?
The most critical Event IDs for production systems: 1000 (application crash), 7034 (service crash), 41 (unexpected restart), 1001 (BSOD), 7000 (service start failure), and 4625 (failed login). These cover the majority of production incidents.
Where are Windows error logs stored?
Windows event log files (.evtx) are stored at C:\Windows\System32\winevt\Logs\. Windows Error Reporting crash data is at C:\ProgramData\Microsoft\Windows\WER\. Windows 10 and 11 update error logs are at C:\Windows\Logs\CBS\CBS.log.
What is the difference between Event Viewer and PowerShell for checking logs?
Event Viewer is a GUI for manual, interactive browsing — best for one-off investigations on a single machine. PowerShell (Get-WinEvent) supports precise filtering, scripting, remote queries, and automation — better for multi-server environments or recurring log checks. For production monitoring across multiple servers, a centralized tool like Middleware is more practical than either.
How long does Windows keep error logs?
Windows keeps logs until they reach the maximum size limit (default 20 MB per log), then overwrites the oldest entries. You can increase this limit in Event Viewer → right-click any log → Properties → adjust maximum log size. For production servers, 50–100 MB is a more appropriate baseline.
How do I export Windows error logs?
In Event Viewer: right-click a log → “Save All Events As” → choose .evtx, .csv, .txt, or .xml. In PowerShell: Get-WinEvent -FilterHashtable @{LogName='System';Level=1,2} | Export-Csv -Path "C:\logs\errors.csv".
What is Windows Event Viewer?
Windows Event Viewer is the built-in Windows tool for viewing, filtering, and analyzing event logs. It provides a graphical interface to browse Application, System, and Security logs, filter by Event ID or severity, create saved custom views, and export log data. It is the primary tool for examining Windows error logs without requiring third-party software.
What are Windows system error logs?
Windows system error logs are entries in the System log channel of Windows Event Viewer that record OS-level failures — service crashes (Event ID 7034), driver errors, unexpected shutdowns (Event ID 41), and hardware issues. They are distinct from Application logs, which capture software-level failures.
How do I read Windows error logs?
Open Event Viewer → navigate to the relevant log → click an entry to view its details. Focus on the Event ID (identifies the error type), timestamp (correlate with when the issue occurred), Source (which component failed), and the General tab message (contains the specific error details, faulting module, and exception code).