Summary: Not all log monitoring tools are built the same. If your logs are scattered across dozens of services, your observability bill is climbing without matching visibility, or only one engineer on the team actually knows how to query the setup, you need a better tool. In this guide, I’ve compared 11 options across search experience, cost structure, vendor lock-in risk, and cross-signal correlation to help you find what actually works in 2026.
TL;DR
- Middleware is the strongest option for teams that want logs, metrics, and traces unified without Datadog-level costs, and includes OpsAI for AI-driven root cause analysis.
- Dynatrace and Datadog are the enterprise-grade choices for complex, multi-cloud environments where budget is secondary to capability.
- Grafana Loki and Graylog are the most cost-effective self-managed options for teams already operating Prometheus/Grafana stacks.
- Splunk leads for security and compliance-heavy use cases, but comes with significant cost and operational overhead.
- GoAccess is a zero-infrastructure option for single-server web log analysis, nothing more.
What is a log monitoring tool?
A log monitoring tool is software that collects, indexes, and analyzes log data from applications, servers, containers, and cloud infrastructure in real time, providing search, alerting, and visualization to help engineering teams detect anomalies, debug incidents, and maintain system reliability.
The 11 Best Log Monitoring Tools of 2026
1. Middleware
Best for: Full-stack observability teams who want logs, metrics, and traces in one platform without the Datadog bill.
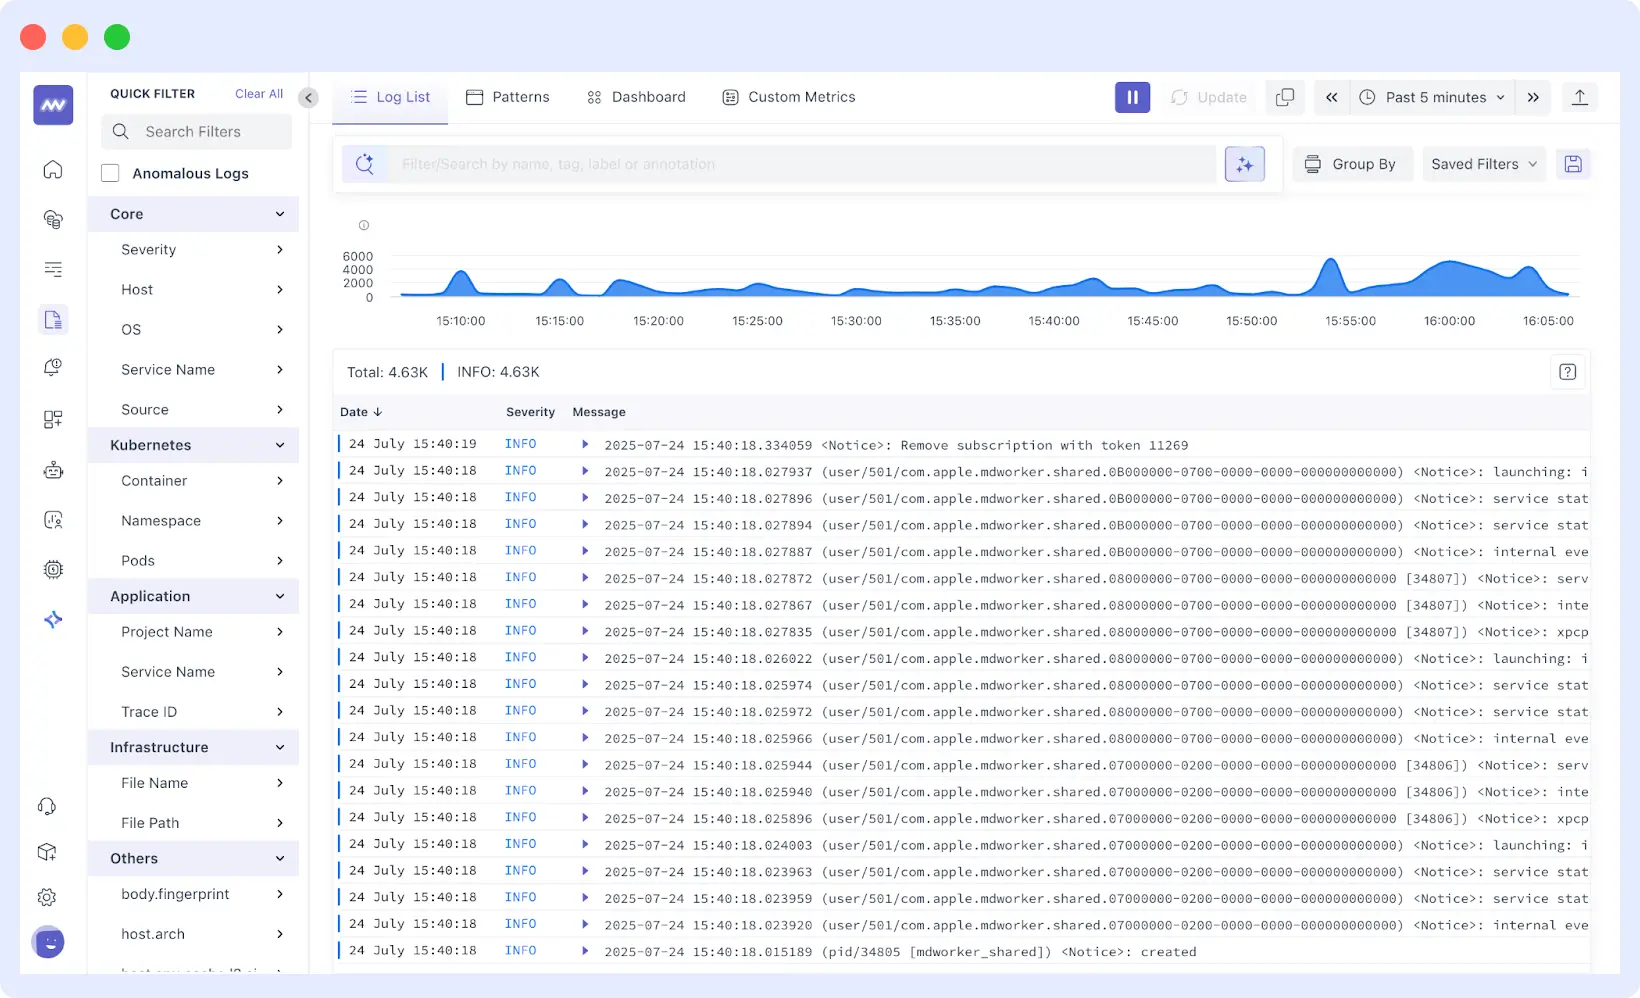
Middleware is a modern OpenTelemetry-native observability platform built by engineers who previously worked and contributed at companies like Netflix, Google, CNCF and DigitalOcean. It was designed to address a common problem in cloud-native systems, where logs, metrics, traces, and user experience data are scattered across multiple tools. Middleware brings these signals together into a single platform so engineers can move from a log event to the related trace, infrastructure metric, or user session without switching dashboards.
The platform unifies logs, metrics, traces, infrastructure monitoring, and Real User Monitoring (RUM), while also offering features such as a Log Pipeline to control ingestion costs and OpsAI, an AI agent that analyzes telemetry data, identifies root causes, and can even generate pull requests to fix issues. Internally, OpsAI resolves over 50% of incidents automatically. Across beta customers, that number climbs to 70%+, with teams reporting 80%+ improvement in on-call productivity.
What stands out
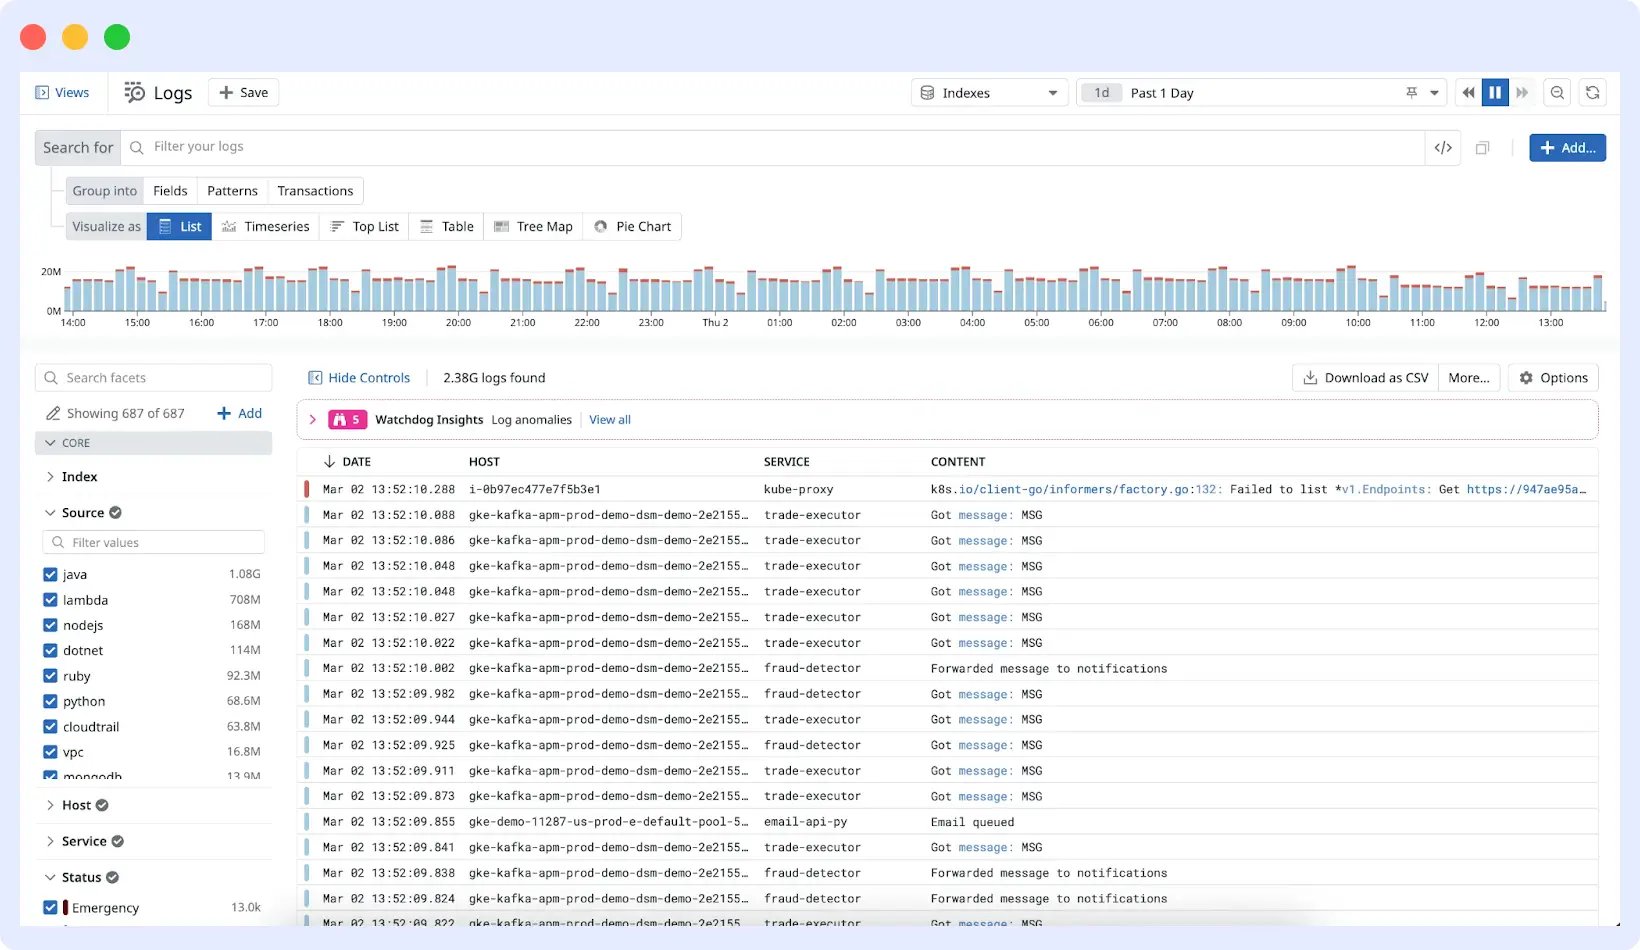
- Centralized log collection from infrastructure, containers, and application layers in a single dashboard
- Real-time log tailing with fast full-text and structured search
- AI-based anomaly detection that surfaces unusual log patterns without manual threshold configuration
- Strong Kubernetes support with pod, namespace, and label enrichment
- OpenTelemetry-native: no vendor lock-in on the collection layer
- Role-based access controls for multi-team environments
- Up to 5x lower cost than comparable observability platforms
The catch
Middleware is younger than established vendors. Feature parity is strong across observability (approximately 95%), but security and SIEM capabilities are not part of the current platform. Enterprise customers including Hoichoi, Walmart, Lee, Congi, and CEAT indicate solid production adoption.
Pricing
14-day free trial with unlimited data ingestion. After the trial, pricing starts at $0.30/GB for logs, metrics, and traces combined on a unified pay-as-you-go model, avoiding the separate indexing and retention charges common on platforms like Datadog or New Relic.
Where it fits
Middleware is the right choice for DevOps and SRE teams that have outgrown basic logging but are being priced out by large observability vendors. It fits well in Kubernetes-heavy environments where teams need to correlate logs with traces and metrics in real time. If you need AI-driven root cause analysis without a six-figure observability bill, Middleware is a strong candidate.
2. Dynatrace
Best for: Large enterprises running complex hybrid and multi-cloud environments where manual configuration doesn’t scale.
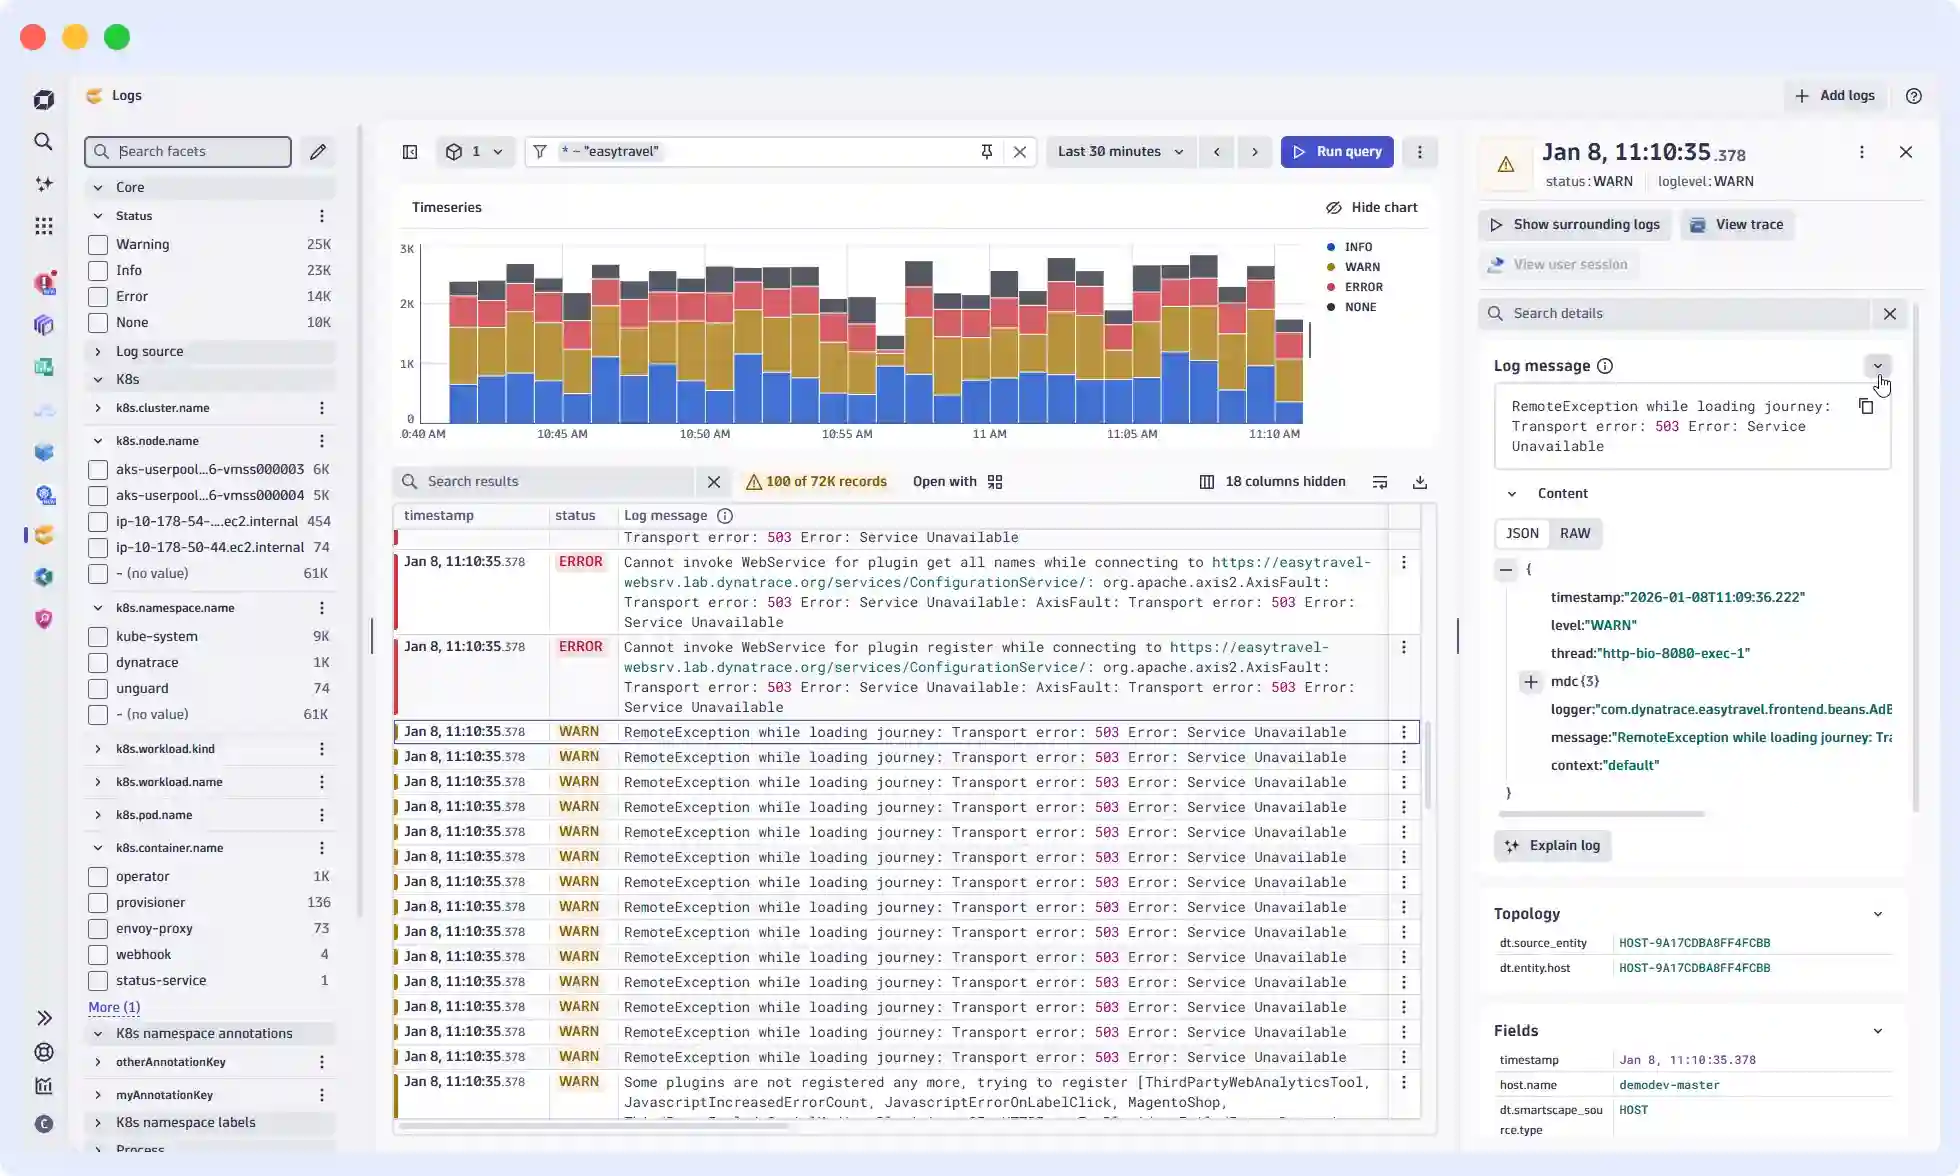
Dynatrace is an enterprise-grade observability platform built around its AI engine, Davis, which automatically discovers, maps, and monitors every component of your stack. When something fails, Davis does not surface a hundred individual alerts. It follows the dependency chain: service A failed because service B slowed down due to a connection limit on database C, and presents a single root-cause event. For large organizations with many interdependencies, this saves significant investigation time.
What stands out
- Davis AI traces root cause through dependency chains automatically, not just surface symptoms
- OneAgent instruments the full stack without per-service configuration
- Native support for AWS, Azure, GCP, Kubernetes, and Red Hat OpenShift
- Covers logs, metrics, traces, and real user monitoring in one platform
- Auto-discovers new services and infrastructure as environments change
The catch
DQL (Dynatrace Query Language) is proprietary. Query expertise does not transfer if you migrate away. The learning curve is real for teams coming in fresh. Pricing has three separate components (ingestion, retention, querying) that require monitoring to avoid surprises at scale.
Pricing
- Log ingestion: $0.20/GiB
- Retention: $0.0007/GiB per day
- Querying: $0.0035/GiB
Where it fits
Dynatrace is built for Fortune 500 enterprises managing massive hybrid cloud environments with thousands of microservices where manual monitoring is not feasible. If your team prioritizes automated root-cause analysis across AWS, Azure, and on-premise mainframes simultaneously, Dynatrace is the enterprise benchmark.
3. New Relic
Best for: Teams that want a single platform with predictable per-user pricing.
New Relic’s approach is built around a unified telemetry pipeline that logs metrics, events, and traces, all of which flow into the same data store and are queryable via NRQL (New Relic Query Language). Log management integrates tightly with APM and infrastructure monitoring, which makes cross-signal investigation practical.
What stands out
- Unified data model across logs, metrics, traces, and events
- NRQL is SQL-like and relatively accessible
- Strong live-tail functionality for real-time debugging
- Log patterns feature automatically groups similar log entries to reduce noise
- 100 GB free data ingestion per month
The catch
Pricing beyond the free tier can get expensive, particularly for organizations with many full-platform users. The query language, while approachable, is proprietary.
Pricing
Free tier: 100 GB/month. Standard: starts at $10/user. Data ingestion beyond the free tier: $0.35/GB.
See how Middleware compares: Middleware vs New Relic
Where it fits
New Relic suits DevOps teams who want an all-in-one platform with a per-user pricing model rather than complex data-sampling tiers. It is particularly effective for teams that rely heavily on APM and want logs to be a natural extension of code-level visibility.
4. Datadog
Best for: Large enterprises with complex environments and a budget to match.
Datadog is the market incumbent in observability for good reason. Its log management product is mature, deeply integrated with the rest of the platform (metrics, APM, synthetic monitoring, security), and backed by an extensive integration library. Log Explorer is powerful, and correlating logs directly with APM traces is genuinely useful for incident investigation.
What stands out
- 500+ integrations for log collection and parsing pipelines
- Seamless log-to-trace correlation within the platform
- Powerful log processing pipelines for normalization and enrichment
- Security monitoring (SIEM) built into the same platform
- Excellent dashboarding and visualization
The catch
Datadog’s pricing model is complex and expensive at scale. Log management is priced separately from infrastructure monitoring and APM. At high log volumes, costs compound quickly, and many teams find themselves managing ingestion volumes just to avoid bill shock.
Pricing
$0.10/GB ingestion + $1.70/GB for 15-day indexing. Custom enterprise pricing available.
Datadog getting expensive? See how Middleware compares
Where it fits
Datadog remains the standard for large-scale, multi-cloud enterprises that need the most extensive integration library available and are consolidating logs, security (SIEM), synthetics, and network monitoring into one ecosystem. Best for teams that value feature depth and platform maturity over cost.
5. Motadata
Best for: Enterprises and growing organizations that need AI-driven log monitoring with unified observability (logs, metrics, traces) and strong compliance controls.
Motadata ObserveOps is an AI-powered observability platform that centralizes logs from servers, applications, databases, network devices, and cloud infrastructure into one unified pipeline. Built for modern hybrid environments, the Motastore-backed architecture handles large-scale log data while maintaining fast query performance.
What stands out
- Unified log collection across infrastructure, applications, and cloud environments
- Real-time log monitoring with live analytics and anomaly detection
- Dynamic log parsing and intelligent indexing without downtime
- Strong compliance and governance controls (audit trails, retention policies)
- Full-stack observability: logs, metrics, and traces in one platform
The catch
Motadata is newer compared to legacy tools like Splunk or Datadog. Enterprise adoption is growing, but community resources and third-party integrations are not as extensive.
Pricing
Custom enterprise pricing. Typically positioned as more cost-efficient than legacy platforms at scale.
Where it fits
Motadata works well for enterprises centralizing log intelligence with strong compliance requirements, and for teams implementing AI-driven observability across hybrid or multi-cloud setups.
6. Splunk
Best for: Large enterprises with security-heavy use cases and existing Splunk investment.
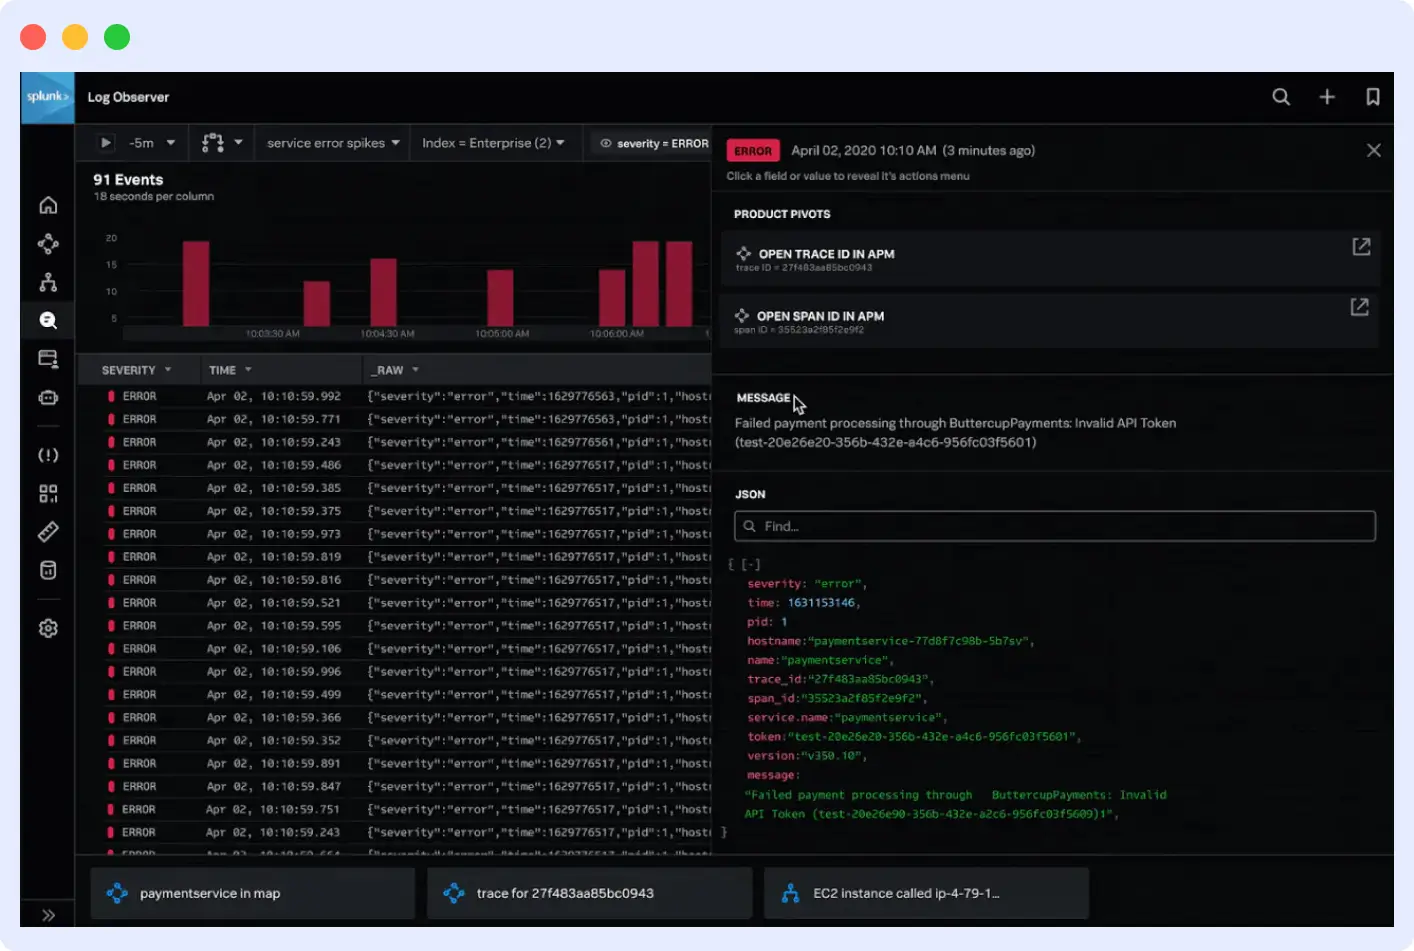
Splunk built its reputation on indexing and searching machine data at scale. Its Search Processing Language (SPL) is genuinely powerful, and its SIEM capabilities make it a common choice in security operations. If your log monitoring use case overlaps significantly with security event analysis, Splunk is worth serious consideration.
What stands out
- SPL is extremely capable for complex log analysis and correlation
- Industry-leading SIEM and security analytics
- Handles unstructured and multi-line logs well
- Strong compliance and audit trail capabilities
- Large ecosystem of apps and add-ons
The catch
Splunk’s cost model, traditionally priced by daily ingest volume, is expensive at scale. It requires meaningful operational overhead to deploy and maintain. The SPL learning curve is real.
Pricing
Free tier at 500 MB/day. Enterprise pricing starts around $225/month for 100 GB/day, though most large deployments use custom enterprise contracts.
Where it fits
Splunk is the premier choice for Security Operations Centers (SOCs) and large organizations where log data serves compliance and security purposes as much as debugging. Best fit for regulated industries (finance, healthcare) where comprehensive data retention and forensic audit trails are non-negotiable.
7. Grafana Loki
Best for: Teams already invested in the Grafana stack who want cost-effective log storage.
Loki takes a deliberately different approach to log storage. Rather than indexing log content (as Elasticsearch does), it only indexes metadata labels. Log data is stored as compressed chunks. This makes Loki significantly cheaper to operate at scale, but means full-text search across log content is slower and more resource-intensive at query time.
What stands out
- Very low storage cost compared to Elasticsearch-based solutions
- Native integration with Grafana and Prometheus
- LogQL query language aligns with PromQL
- Excellent fit for Kubernetes environments using Promtail or Alloy agents
- Open-source with self-hosted or Grafana Cloud-managed options
The catch
Full-text search performance degrades as scale increases. If your team needs to search across large log volumes without knowing the label structure in advance, Loki can be frustrating. It rewards consistent, well-defined labeling practices.
Pricing
Open-source (self-hosted, free). Grafana Cloud includes a generous free tier; paid tiers start at $0.50/GB ingested.
Where it fits
Loki is the right choice for SRE and platform engineering teams already using Prometheus and Grafana who want to reduce logging costs by only indexing metadata. Ideal for Kubernetes environments where cost-efficient, long-term storage in S3/GCS is a priority.
8. Elastic (ELK Stack)
Best for: Teams with the engineering capacity to operate a self-managed stack and need maximum customization.
The Elastic Stack, Elasticsearch, Logstash, and Kibana have been the default choice for self-managed log infrastructure for over a decade. Kibana’s log viewer and Discover interface are mature and flexible. Elasticsearch’s full-text search is fast and well-understood.
What stands out
- Powerful full-text and structured search via Elasticsearch
- Rich dashboarding and visualization through Kibana
- Lightweight Beats agents (Filebeat, Metricbeat) for log collection
- Highly customizable for almost any logging architecture
- Large community and extensive documentation
The catch
Operating Elasticsearch at scale requires real infrastructure expertise. Cluster management, index lifecycle policies, shard sizing, and performance tuning are non-trivial. The managed Elastic Cloud offering reduces operational burden but increases cost.
Pricing
Open-source (self-hosted). Elastic Cloud managed service starts around $95/month; pricing scales with storage and compute.
Where it fits
The ELK Stack is for engineering-heavy teams who want complete control over their stack and need Elasticsearch’s full-text search capabilities. Best for organizations that can staff the infrastructure management or need a highly customized log-processing pipeline via Logstash.
9. Mezmo
Best for: Teams dealing with high log volumes who want to control what reaches storage and reduce both noise and cost at the collection layer.
Mezmo gives teams control over their log data before it ever reaches storage. By letting you parse, filter, enrich, and route logs at the pipeline level, it reduces noise, cuts ingestion costs, and ensures only the right data reaches the right destination. A major advantage for teams dealing with high-volume, distributed log streams.
What stands out
- Fast real-time log tailing and filtering across distributed log streams
- Quotas and index rate alerting to control unexpected data spikes
- Granular notifications triggered by searches, correlations, and storage criteria
- Auto and custom parsing and enrichment to structure logs into usable formats
- Powerful telemetry pipeline to route log data to the right destination
- Intuitive UI with strong Kubernetes and cloud-native integrations
The catch
- Costs can grow significantly at high log volumes
- Metrics and traces support is less mature than dedicated observability platforms
- Navigation can feel cumbersome for complex queries
Pricing
Free community plan with no data retention. Professional: $0.80/GB with 3-day retention. Enterprise: custom.
Where it fits
Mezmo (formerly LogDNA) suits fast-moving developer teams who prioritize a live-tail experience and need to control ingestion costs before data hits storage. Its Telemetry Pipeline makes it a strong choice for teams routing and filtering logs across departments or storage tiers. storage tiers to keep their primary observability tools clean and performant.
10. GoAccess
Best for: Developers and small teams who need fast, zero-overhead visibility into web server traffic without the complexity of a full observability platform.
GoAccess is a single-purpose tool. It analyzes web server logs (Apache, Nginx, Amazon S3 access logs, CloudFront, and others) in real time, directly in a terminal or browser dashboard with millisecond refresh rates. For solo developers or small teams managing a handful of web servers, it is the fastest path from zero to useful traffic information.
What stands out
- Real-time web server log analysis with millisecond-level data refresh
- Runs in terminal or browser with zero external dependencies or infrastructure
- Incremental log processing reads only new entries, not the entire file each time
- Supports Apache, Nginx, Amazon S3, Cloudfront, and more without configuration
- Completely free with no infrastructure cost or licensing
The catch
- Limited to web server log formats: not suitable for application or infrastructure monitoring
- No alerting, anomaly detection, or long-term log retention
- Does not scale to distributed or multi-service environments
Pricing
Free and open-source.
Where it fits
GoAccess is the right tool for system administrators and solo developers who need instant, real-time visual analysis of web server logs without a complex SaaS setup. Run one command in the terminal and see a live dashboard of traffic patterns, visitor locations, and 404 errors.
11. Graylog
Best for: Mid-size teams that want open-source log management with a reasonable UI.
Graylog sits between the full complexity of the ELK stack and the simplicity of hosted solutions. It uses Elasticsearch or OpenSearch as a backend but wraps it in a more opinionated, operator-friendly interface. Alert management, role-based access, and compliance-focused audit features are well-developed.
What stands out
- Cleaner operator experience than raw Kibana for log management workflows
- Strong alerting and notification pipeline
- GELF (Graylog Extended Log Format) supports rich structured log data
- Good compliance and access control features
- Active open-source community
The catch
Graylog still requires Elasticsearch or OpenSearch underneath, so the operational complexity of that dependency does not fully disappear.
Pricing
Open-source (self-hosted). Enterprise edition starts at $1,250/month.
Where it fits
Graylog is the sensible middle ground for mid-sized IT teams who find the ELK stack too complex but find SaaS solutions too expensive. It fits well in corporate IT environments that need strong role-based access control and simplified alerting on top of an OpenSearch backend, particularly for teams moving toward structured logging with GELF.
How to choose a log monitoring tool
| Tool | Best for | Pricing |
|---|---|---|
| Middleware | Unified logs, metrics and traces at a fraction of competitor costs, with AI-driven root cause analysis | 14-day free trial, unlimited ingestion; $0.30/GB after |
| Dynatrace | AI-driven root cause analysis with auto-discovery across complex enterprise stacks | $0.20/GiB ingestion; $0.0007/GiB per day retention |
| New Relic | Correlating logs, metrics and traces in a single platform with a generous free tier | Free (100 GB/mo); $0.35/GB after |
| Datadog | Real-time log analysis with 500+ integrations and ML-based anomaly detection | $0.10/GB ingestion + $1.70/million log events/mo |
| Motadata | Enterprises needing AI-driven log monitoring with compliance controls | Custom pricing |
| Splunk | SPL-based search and analytics built for enterprise security and compliance | Quote-based |
| Grafana Loki | Cost-efficient log storage for Grafana/Prometheus stacks | Open-source; Grafana Cloud paid tiers from $0.50/GB |
| Elastic (ELK Stack) | Customizable self-managed logging infrastructure | Open-source; Elastic Cloud from ~$95/mo |
| Mezmo | Parsing and routing high-volume log pipelines before they hit storage | Free (no retention); $0.80/GB with 3-day retention |
| GoAccess | Instant real-time web server log analysis with zero setup | Free (open-source) |
| Graylog | Centralized log management with flexible self-hosted or cloud deployment | Free (self-hosted); from $1,250/mo (cloud) |
Start with the observability scope
If you only need logs, Loki or Graylog can be cost-effective. If you need logs alongside metrics and traces, a unified platform like Middleware or Datadog reduces the overhead of connecting multiple tools. Unified platforms also tend to make incidents faster to resolve because you are not switching contexts.
Run the math at your actual log volume
Most tools offer free trials. Ingest a week of real production logs, measure the cost, and project forward at 2x growth. Surprises at this stage are much cheaper than surprises at renewal time.
Test the query experience under realistic conditions
The best UI does not matter if queries on 30-day windows time out. Test with the volume and time ranges your team actually uses during incidents, not demo data.
Factor in operational overhead
Hosted SaaS tools trade money for engineering time. Self-managed tools (Loki, Elastic, Graylog) trade money for operational complexity. That trade-off is different for a three-person platform team versus a dedicated SRE organization.
The right log monitoring tool is the one your team will actually use consistently, in incidents, at 3 AM. Optimize for that.
If you’re ready to test one, Middleware is free to start with no credit card required. Get started
FAQs
What is the difference between log monitoring and log management?
Log monitoring focuses on real-time detection of anomalies, errors, and system events as they happen. Log management is broader and covers the full lifecycle: collection, storage, indexing, retention, and search. Most modern platforms combine both, but some tools (like Mezmo) specialize in pipeline management before logs reach a storage backend.
What log monitoring tools are best for Kubernetes environments?
Middleware, Grafana Loki, and Datadog all have strong Kubernetes support. Middleware provides pod, namespace, and label enrichment out of the box via its OpenTelemetry-native agent. Loki integrates directly with Promtail and Alloy and is a natural fit for Prometheus-based stacks. Datadog has mature Kubernetes integrations but at higher cost.
How much does log monitoring typically cost?
It varies widely by volume and tooling. Open-source tools (Loki, Elastic, Graylog) are free to run but carry infrastructure and operational costs. Commercial tools range from $0.10/GB (Datadog ingestion) to $0.80/GB (Mezmo) for indexed storage. Middleware starts at $0.30/GB on a unified model that covers logs, metrics, and traces together.
What is the best free log monitoring tool?
Grafana Loki and the ELK Stack are the most capable open-source options with no licensing cost. GoAccess is free and requires zero infrastructure for web server log analysis. Middleware and New Relic both offer free tiers: Middleware includes a 14-day trial with unlimited ingestion; New Relic offers 100 GB/month permanently free.