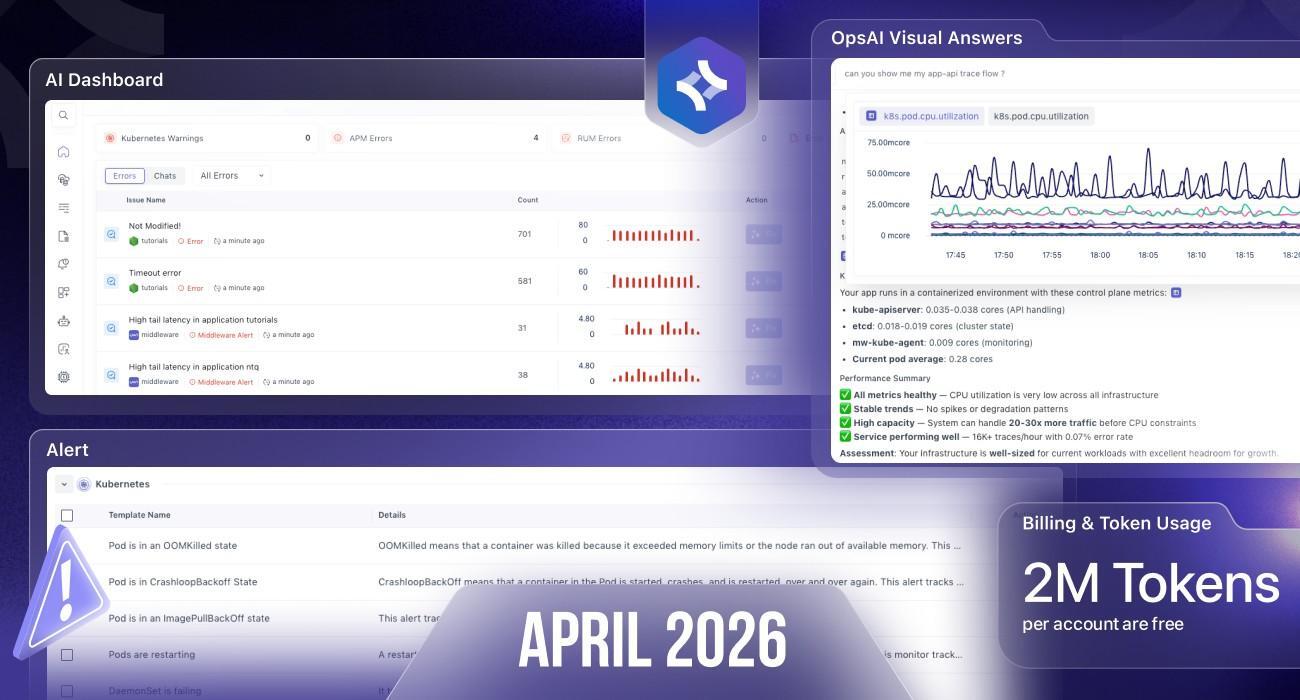
April is all about OpsAI evolution — making it the central interface for observability, debugging, and automation. Along with that, we’ve rolled out improvements across alerts, integrations, RUM, logs, and billing transparency.
Here’s everything new this month 👇
OpsAI
AI Dashboard (New Default Landing Page)
OpsAI is now the default landing screen inside Middleware.
- View everything in one place:
- Errors
- Alerts
- Integrated alerts from Grafana / Datadog
- Chats and fixes
- Previous dashboard still available:
Dashboard Builder → System Health Overview 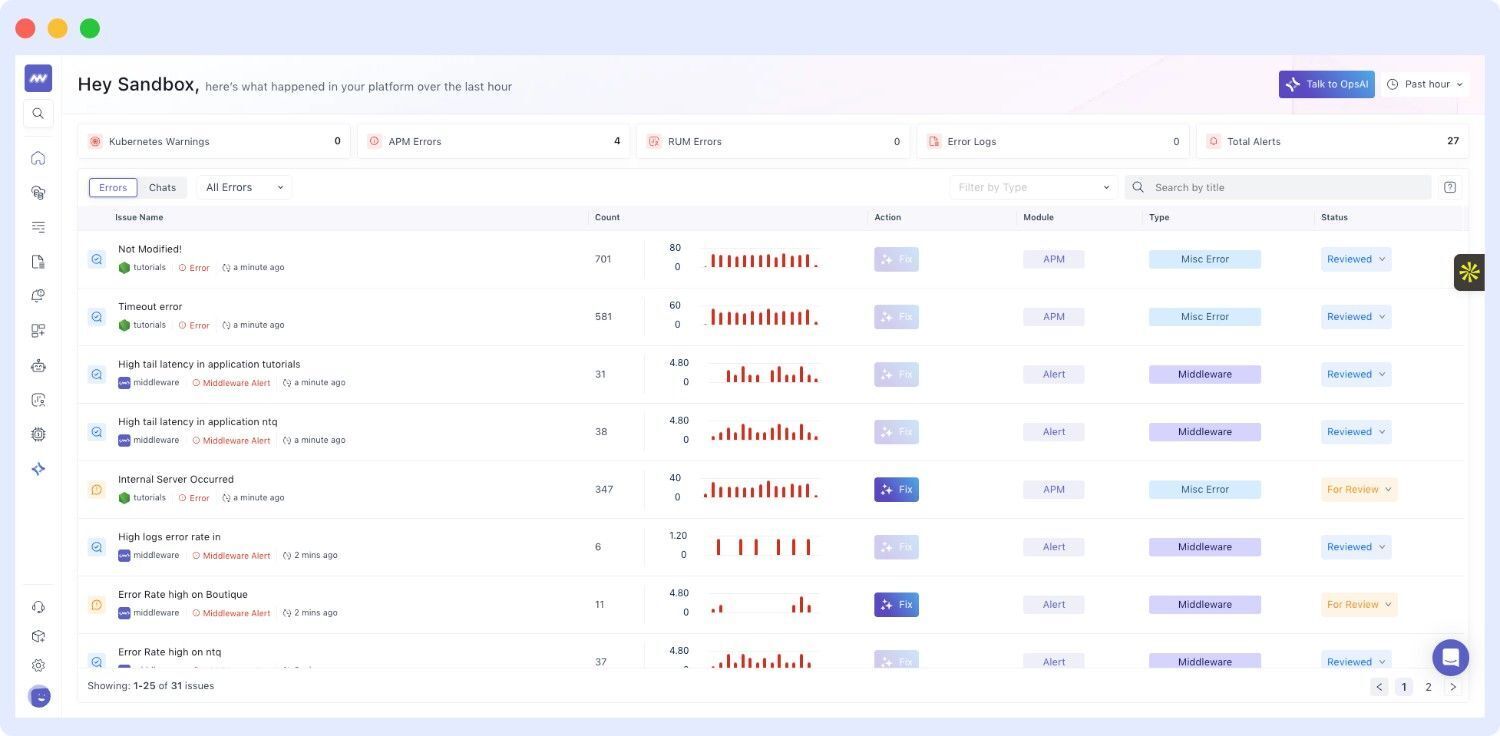
Talk to OpsAI
- Start a new chat and ask questions about:
- Your observability data
- Errors and incidents
- Middleware features and integrations
OpsAI can now answer queries using both your data + product knowledge.
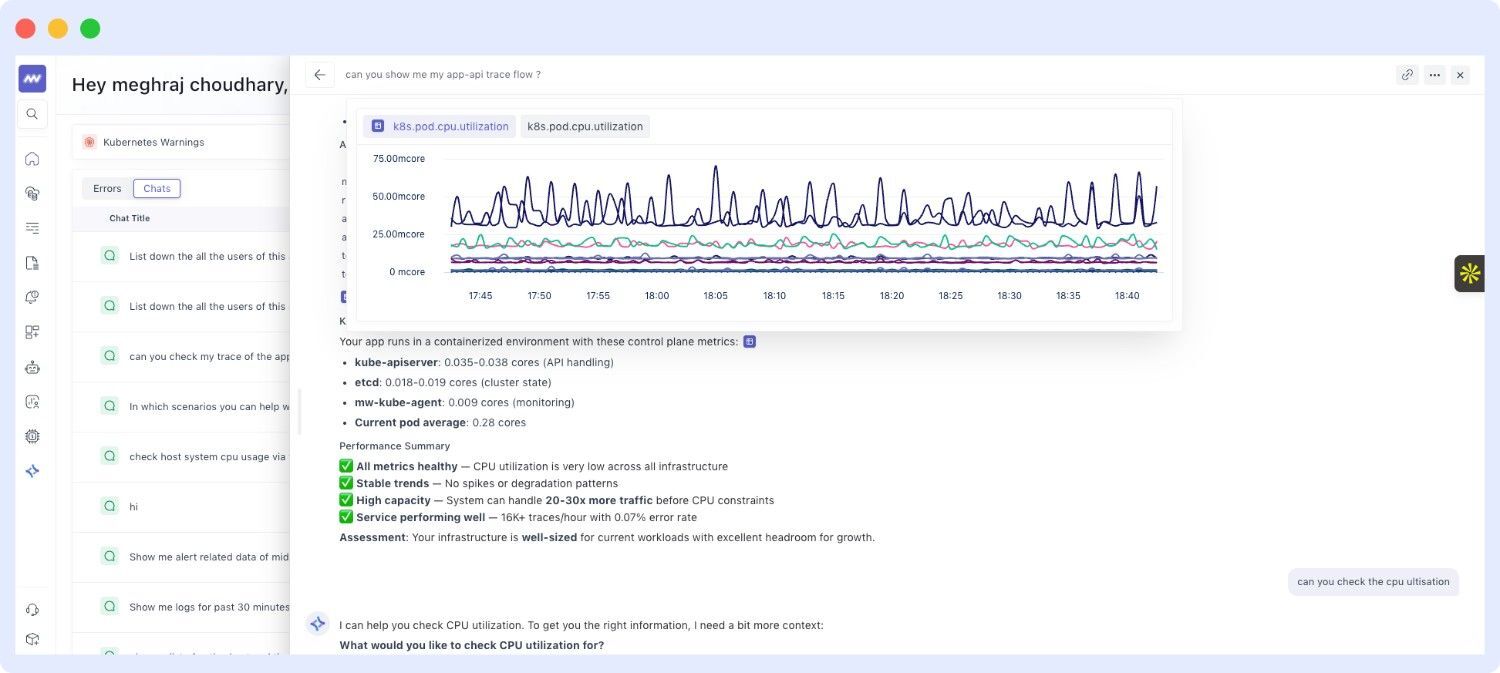
OpsAI Visual Answers
- OpsAI now includes charts and visualizations in responses when relevant
- Makes it easier to:
- Compare data
- Understand trends
- Analyze issues faster
Unified Alerts in OpsAI
- All alerts (including Middleware + third-party) are now visible inside OpsAI
- You can directly investigate alerts using opsAI
Third-Party Alerts Support
- Supports alerts from:
- Grafana
- Datadog
Send alerts via integration and resolve them using OpsAI.
Billing & Token Usage
- 2M tokens per account are free for investigation & fixes
- Post limit → usage-based billing on tokens. Refer to the detailed Middleware pricing.
👉 Note:
- Creating dashboards or alerts with OpsAI is free
Integration Enhancements
GCP
- Upgraded CloudSQL integration
- Added polling support for Query Insights (PostgreSQL)
AWS
Added support for 7 new services:
- DocumentDB
- Bedrock
- SageMaker
- Billing & Cost Management
- KMS
- SES
- Textract
RUM Improvements
- Android SDK now supports de-obfuscated stack traces
- Fixed issue in geographic analytics chart
- Added HTML/JavaScript snippets in RUM installation guide
- Improved consistency of resource attributes in mobile SDKs
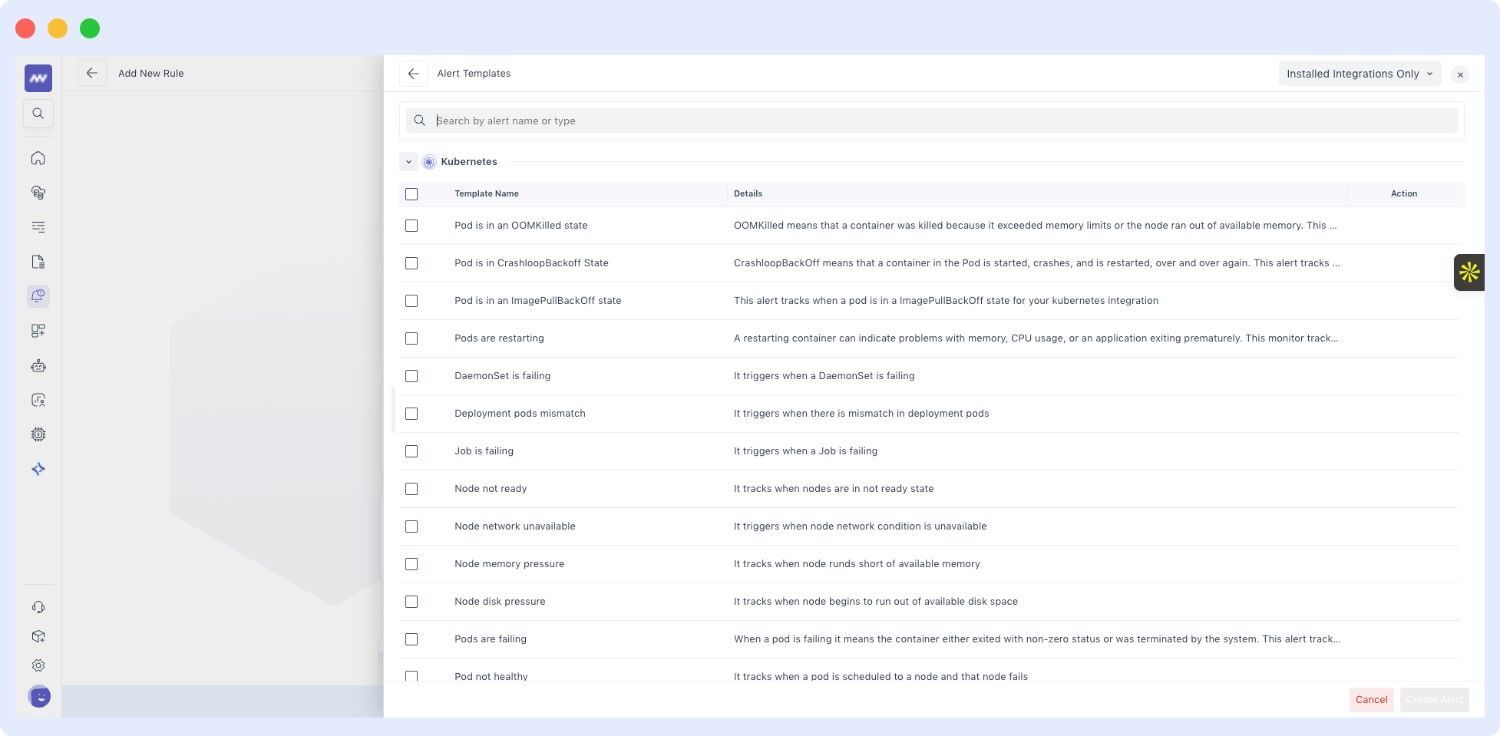
Alerting Improvements
- Updated alert template UI
- Create multiple alerts at once from templates
- Added token usage alerts (cost & usage-based)
Logs Improvements
- Support added for special characters in search and filters
- Fixed indexing issues for parsed attributes
- Added support for:
- < (less than)
- > (greater than)
in log filters
OpsAI Backend & Performance Improvements
- Introduced context summarization
- Reduces payload size
- Improves response speed and efficiency
- UI fixes in AI dashboard:
- Spacing
- Tables
- Scrolling
Pricing Update
We’ve updated pricing related to:
- Free trial limits
- Free usage tiers
👉 Please refer to the latest Middleware pricing.