



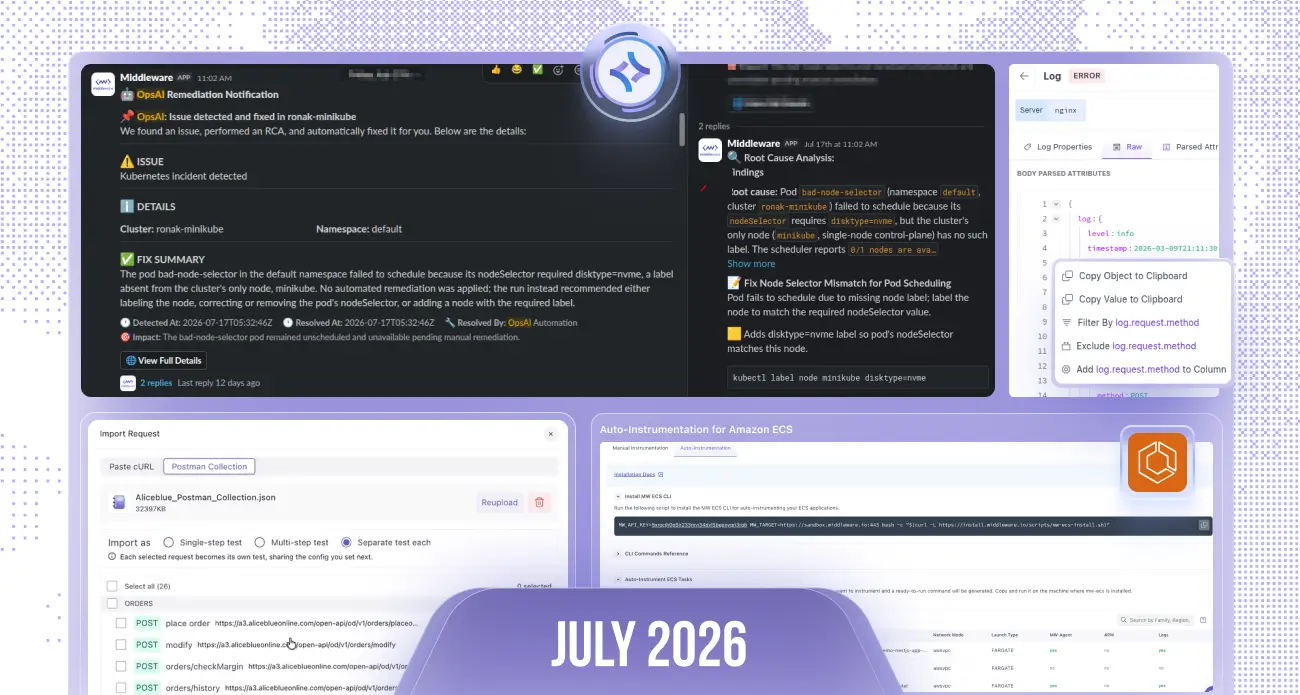
From AI-powered operations to simplified cloud onboarding, this release is packed with features that help you investigate, build, and monitor faster. We’ve expanded OpsAI across more workflows, improved integrations, introduced ECS auto-instrumentation, enhanced RUM capabilities, and made observability more accessible for teams of all sizes.
Here’s everything new this month 👇
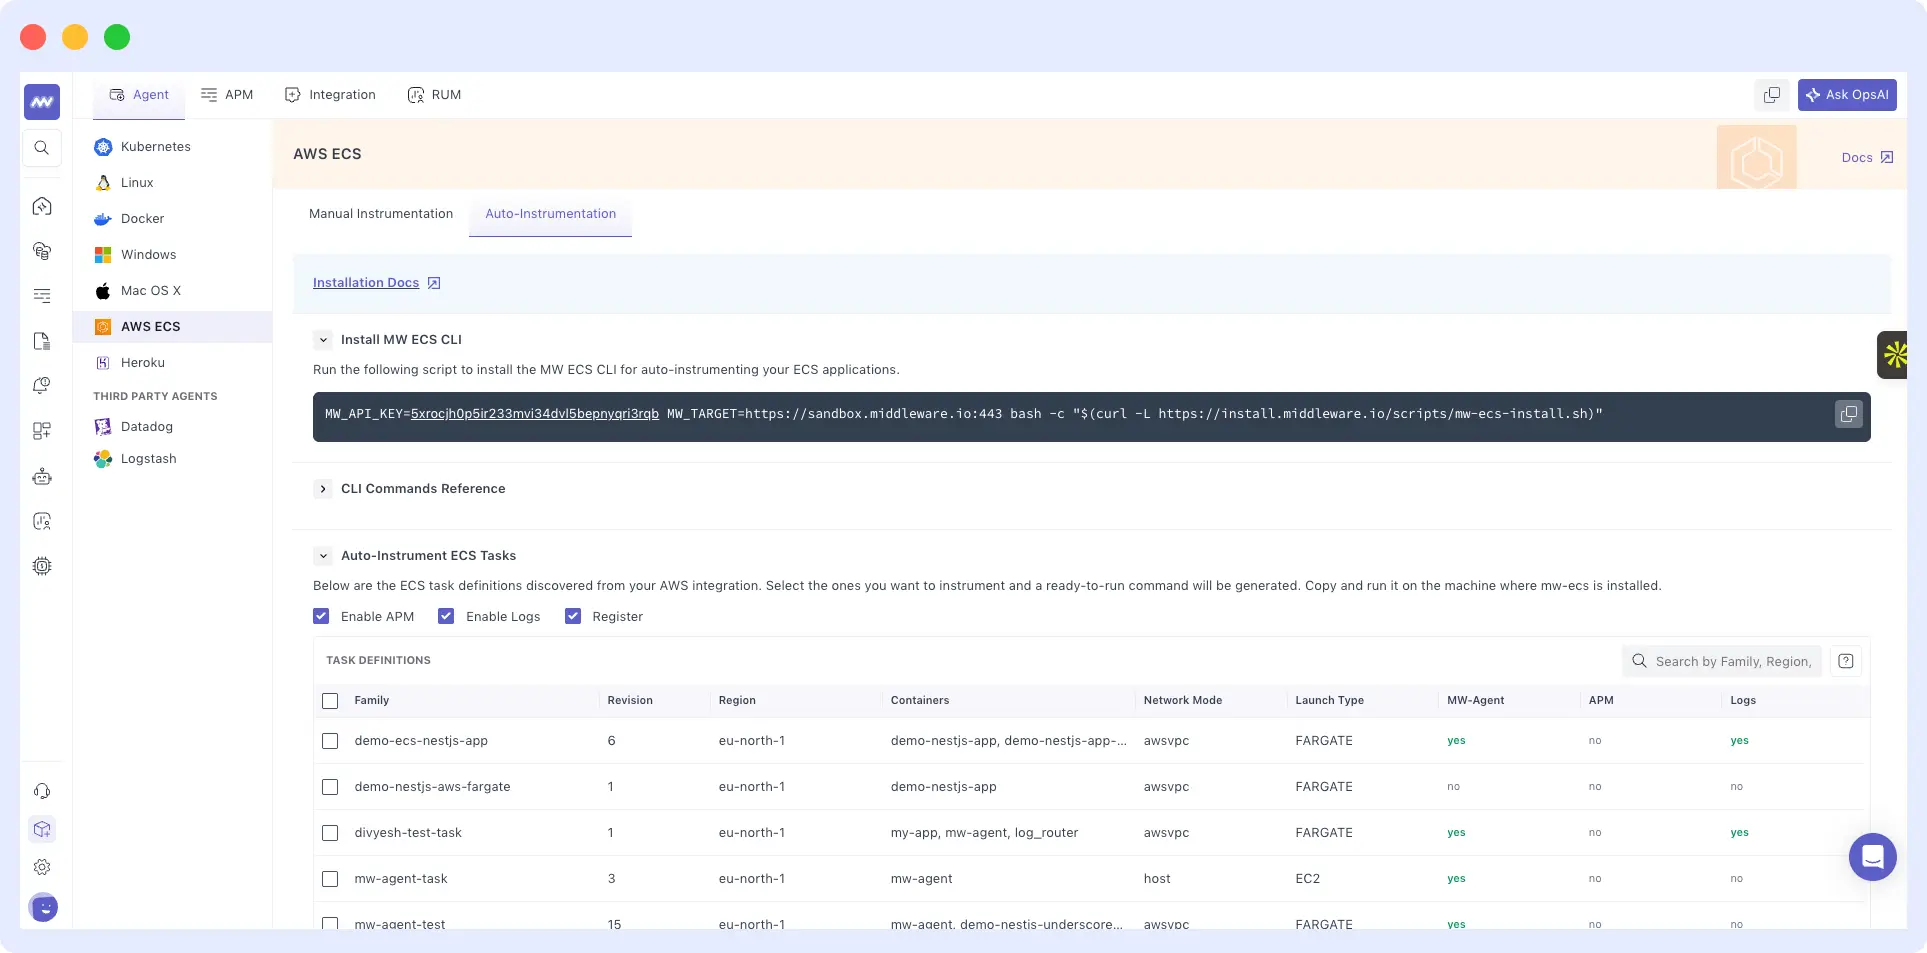
⚙️ Auto-Instrumentation for Amazon ECS
We’ve extended our auto-instrumentation capabilities to AWS ECS.
You can now:
- Discover ECS clusters and services
- Detect applications running inside ECS tasks
- Configure auto-instrumentation directly from the UI
- Instrument ECS task definitions with minimal setup
This makes onboarding containerized workloads significantly faster without manual configuration.
🤖 OpsAI – More Automation, More Context
Create Alerts from Chat
OpsAI can now create alerts directly from New Chat.
Simply describe what you want to monitor, and OpsAI will automatically generate the appropriate alert configuration.
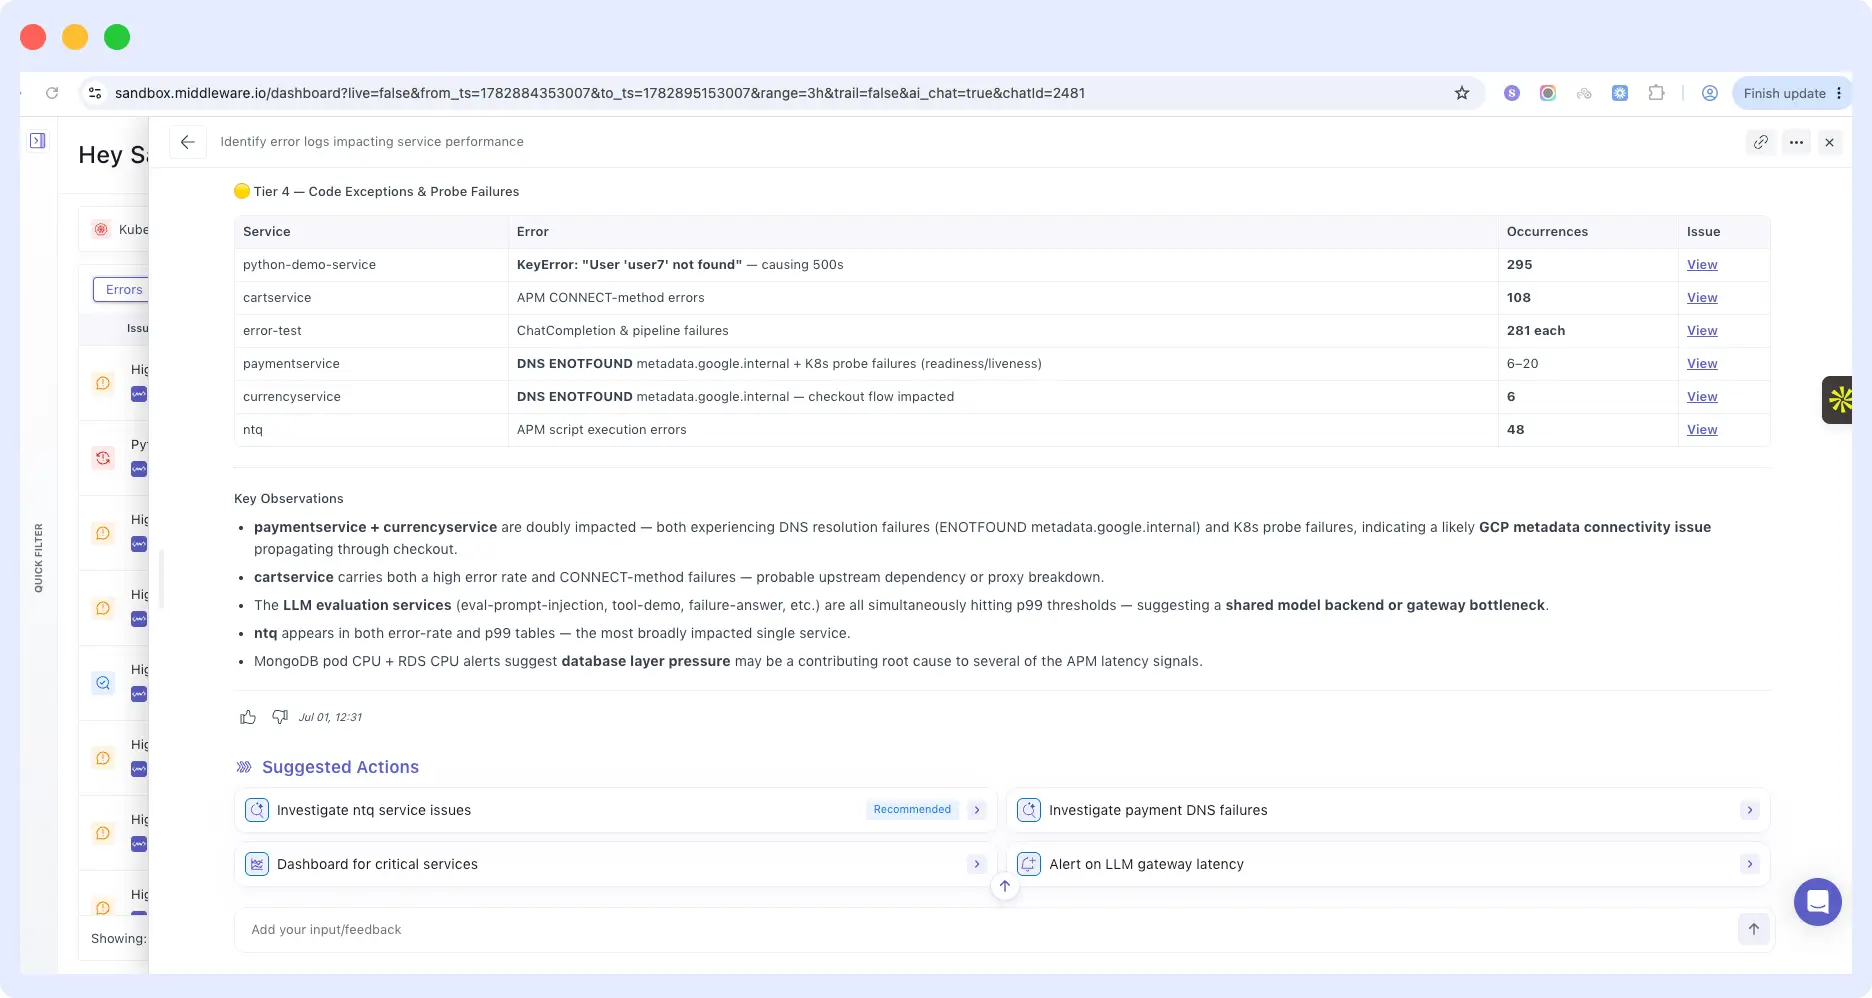
Suggested Next Steps
After investigating an issue, OpsAI now recommends the most relevant next actions.
Examples include:
- Investigate related services
- View logs or traces
- Create an alert
- Generate a fix
- Execute Kubernetes commands
Users can execute suggested actions with a single click.
OpsAI in Slack
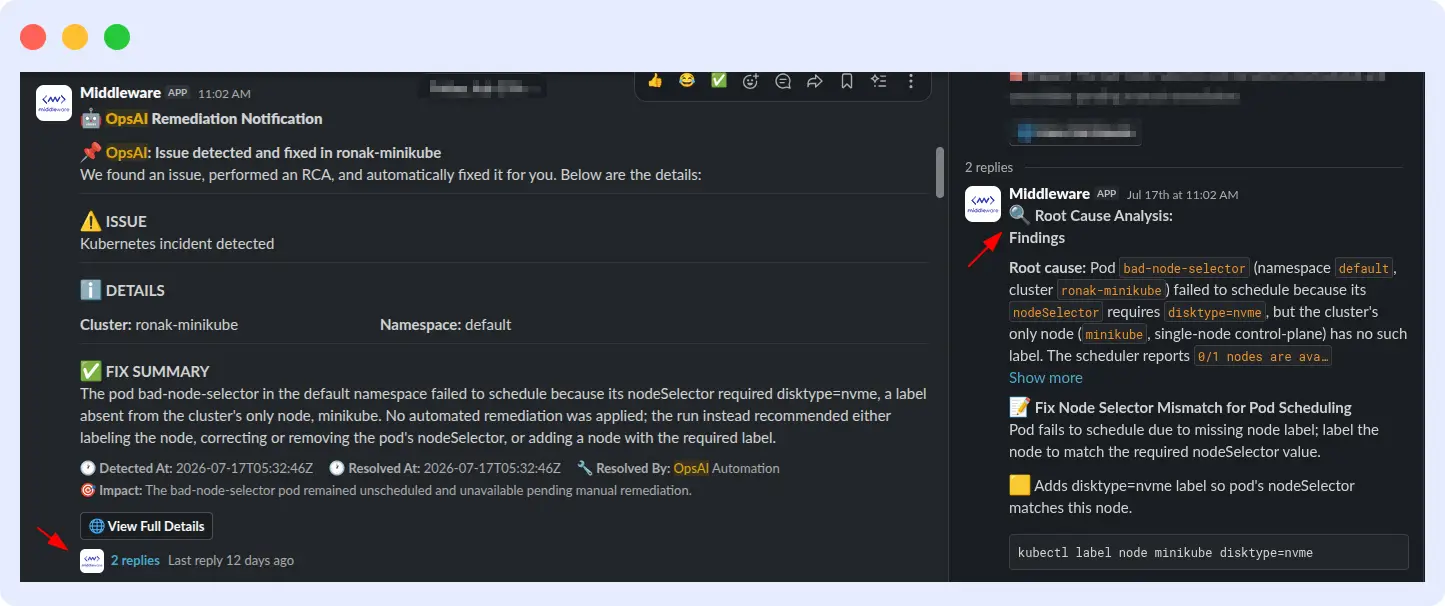
OpsAI is now available directly inside Slack.
When an issue occurs, teams can access:
- Root Cause Analysis (RCA)
- Investigation summary
- Recommended fixes
without leaving Slack workspace.
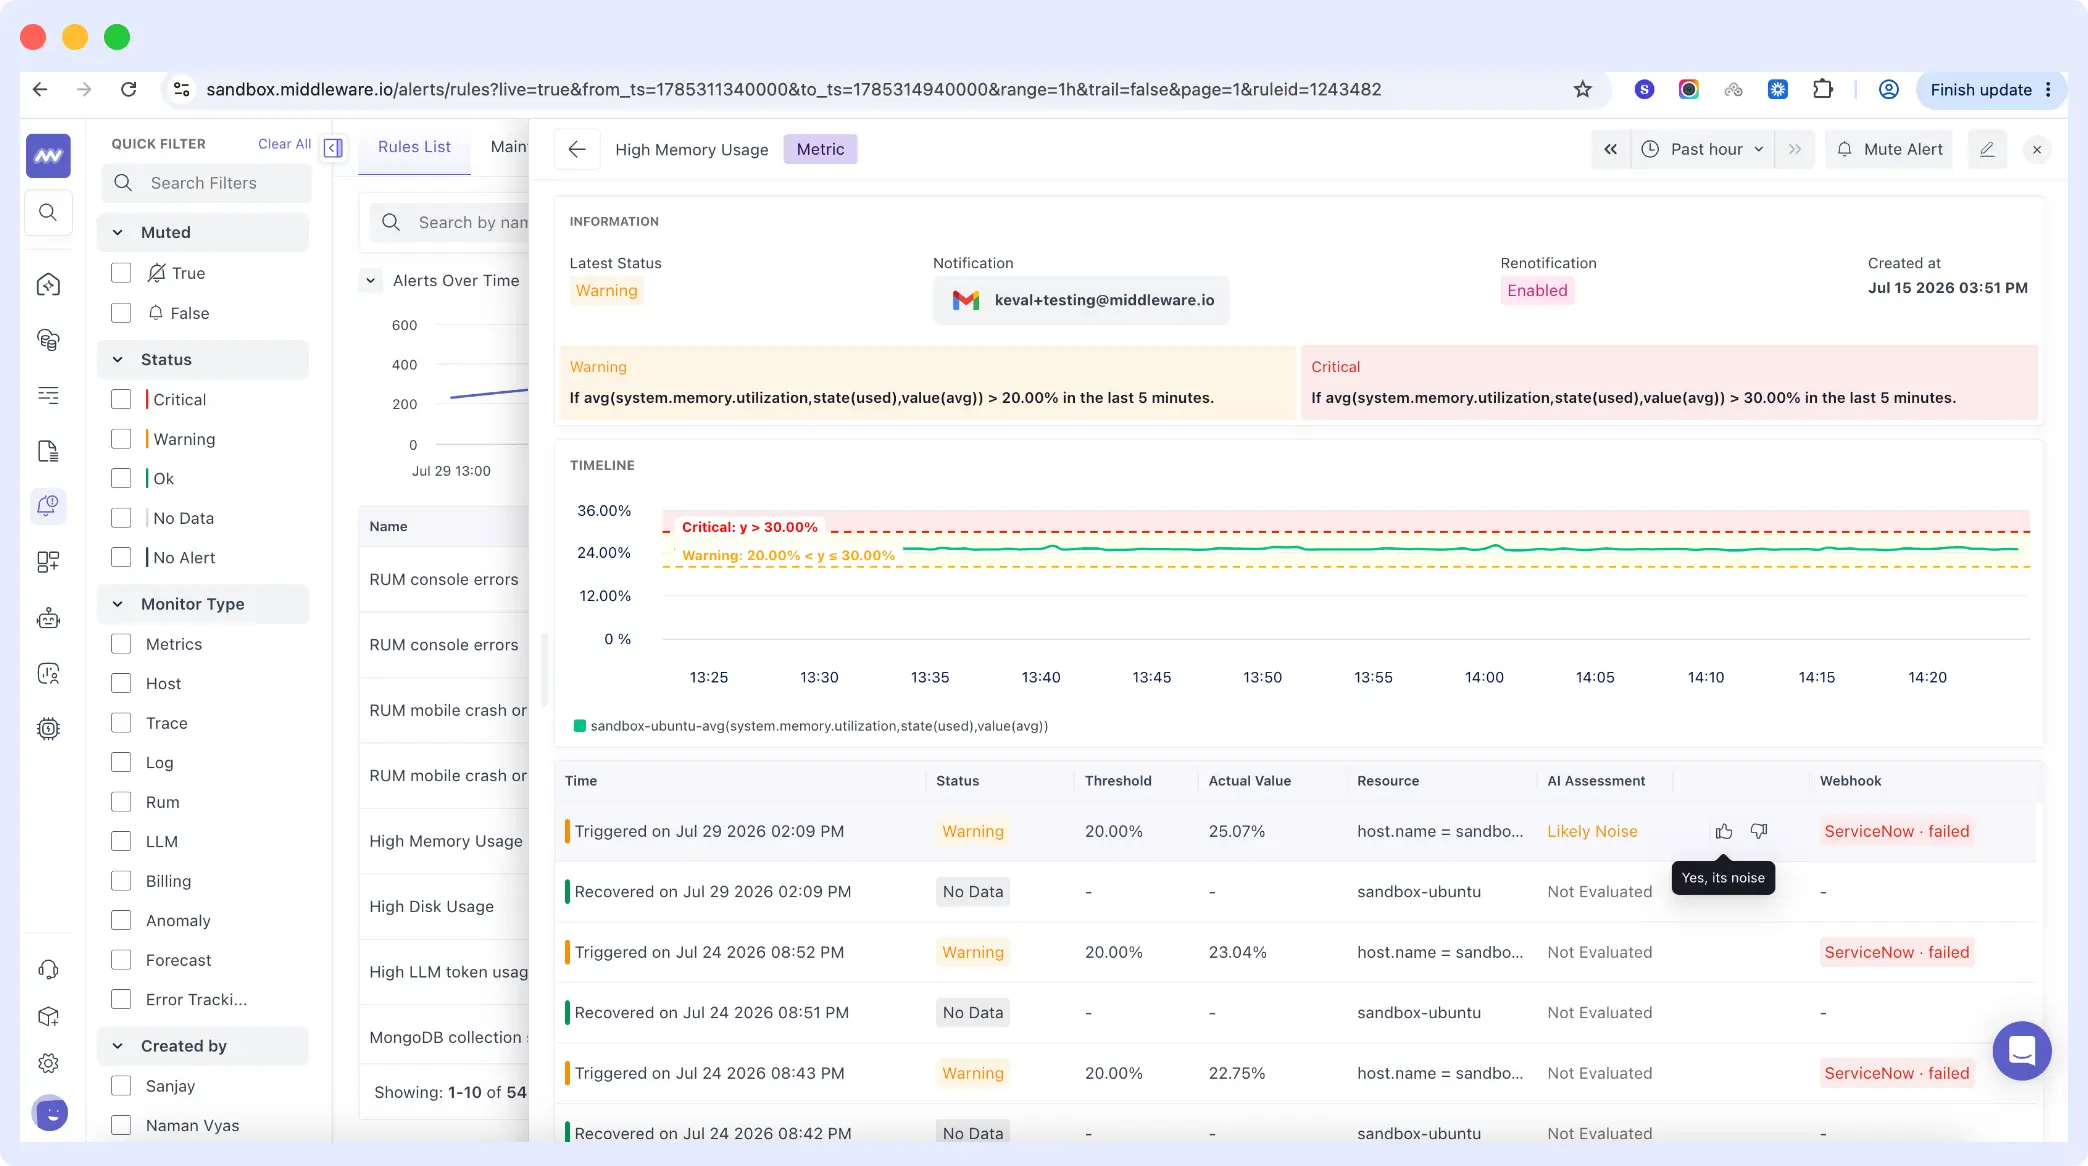
AI Assessment for Alerts
OpsAI now evaluates every alert and classifies it into one of four categories:
- ✅ Actionable – The alert represents a real issue that requires attention.
- ⚠️ Likely Noise – The alert appears to be a false positive.
- ❓ Needs Review – OpsAI couldn’t confidently classify the alert and recommends manual review.
- ⏳ Not Evaluated – The alert hasn’t been analyzed yet.
Feedback Loop for AI Assessments
Users can now provide feedback on OpsAI’s alert assessments.
This feedback helps improve future classifications and continuously trains the AI to better distinguish between actionable alerts and noisy ones.
Coming Soon: Alerts marked as Likely Noise will be automatically muted to further reduce alert fatigue.
Additional OpsAI Improvements
- Faster loading for issue listings and investigation details.
- Display the username of the person who started a conversation.
- Generate pull requests from any Git branch, not just the default branch.
🔌 Integration Enhancements
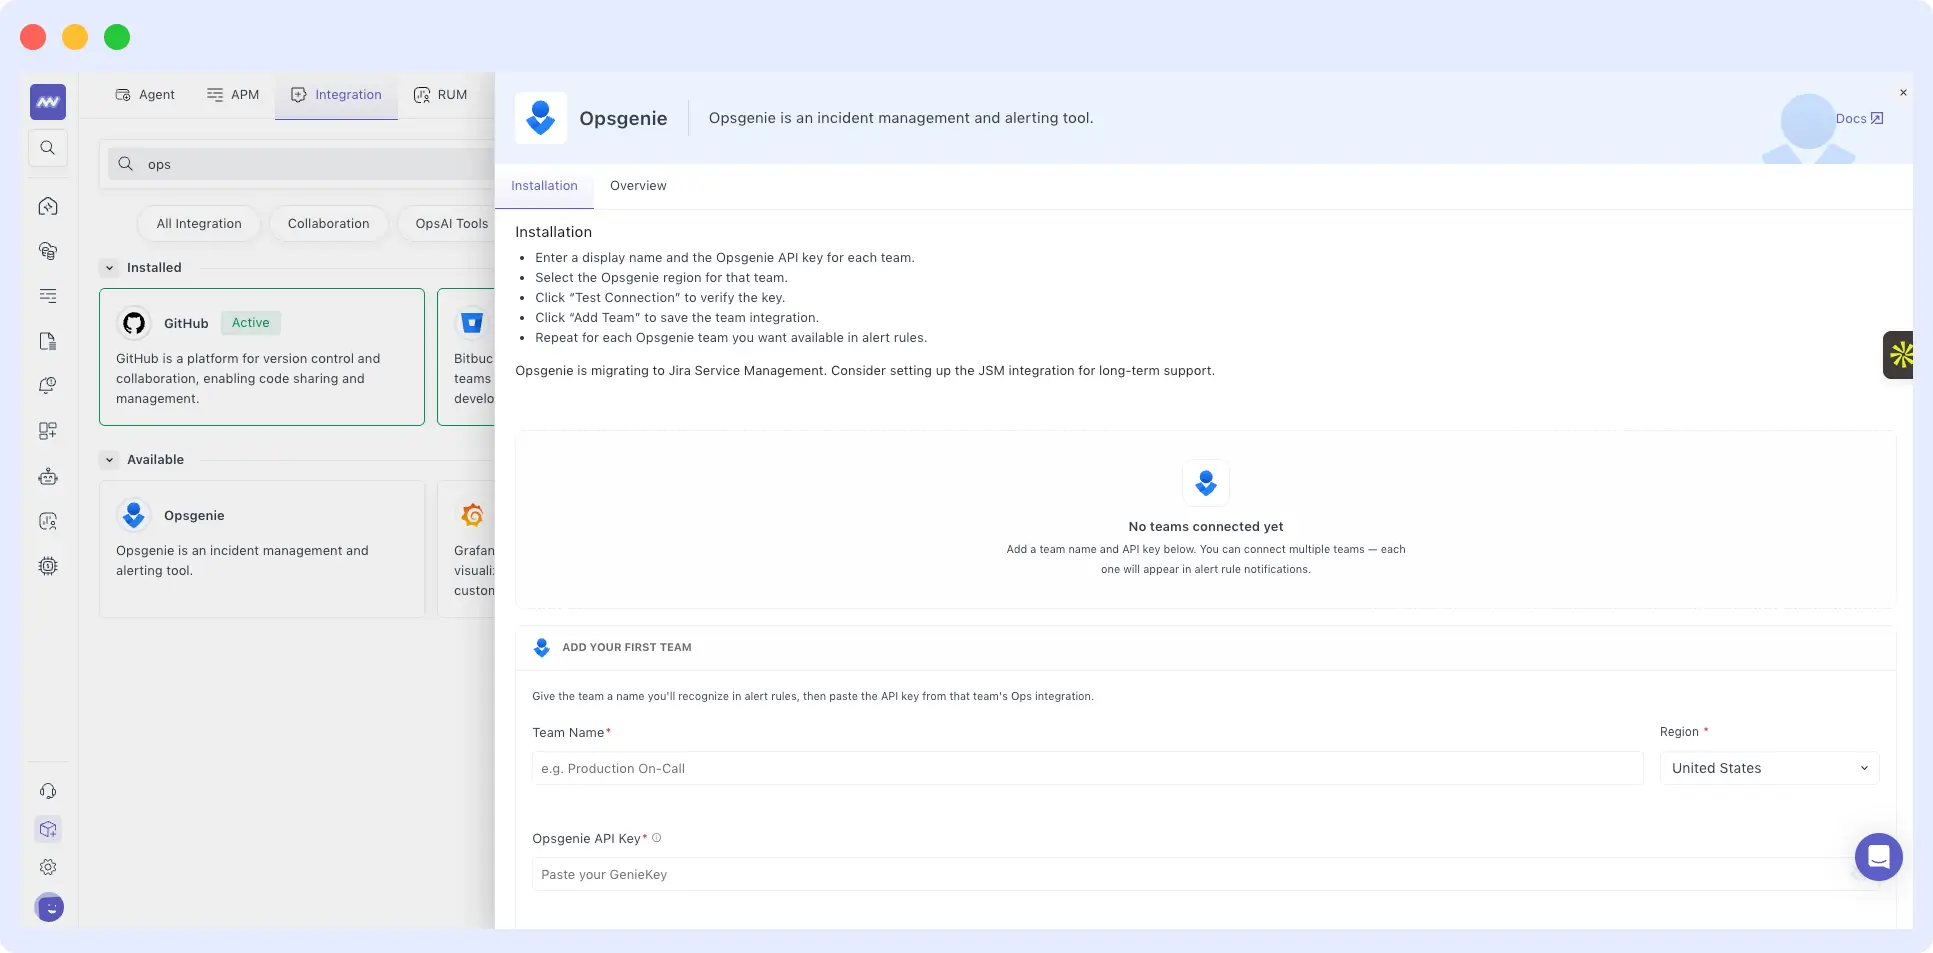
Opsgenie Integration
We’ve revamped the Opsgenie integration to make it fully compatible with Jira Service Management.
Setup now requires:
- Team name
- Region
- API key
Prometheus Integration
Added Basic Authentication support for scraping password-protected Prometheus endpoints.
MySQL on Kubernetes
Added Kubernetes agent support for monitoring MySQL running on Google Cloud Platform.
Data Collection Visibility
The Data Collected tab now lists every metric collected by each integration, making it easier to understand what data becomes available after setup.
GCP Integration
Added support for folder-level polling, making it easier to monitor organizations with multiple GCP projects.
📝 Audit Logs
Audit Logs are now available for tracking administrative activities across Middleware.
Track changes made to:
- Pipeline configuration
- Users
- Projects
- API Keys
- Metrics ingestion control
- Agent installation
- APM configuration
This provides better visibility for governance, compliance, and troubleshooting.
✨ Product Enhancements
Log Parsing
Added support for JSON parsing at specific file paths within a host.
Previously, JSON parsing could only be configured at the host or cluster level through Pipelines.
Status Page
Improved the Status Page UI with:
- Information section
- Status badges
RUM Permissions
Added Role-Based Access Control (RBAC) for the RUM module with permissions for:
- View
- Add
- Edit
Public Dashboard Sharing
Dashboards can now be shared publicly using a secure shareable link.
Anyone with the link can view the dashboard without requiring a Middleware account.
Text Widgets
Added support for Text Widgets in dashboards.
Use them to:
- Add notes
- Document incidents
- Provide dashboard context
- Simplify dashboard migration from platforms like Datadog
🚨 Alert Improvements
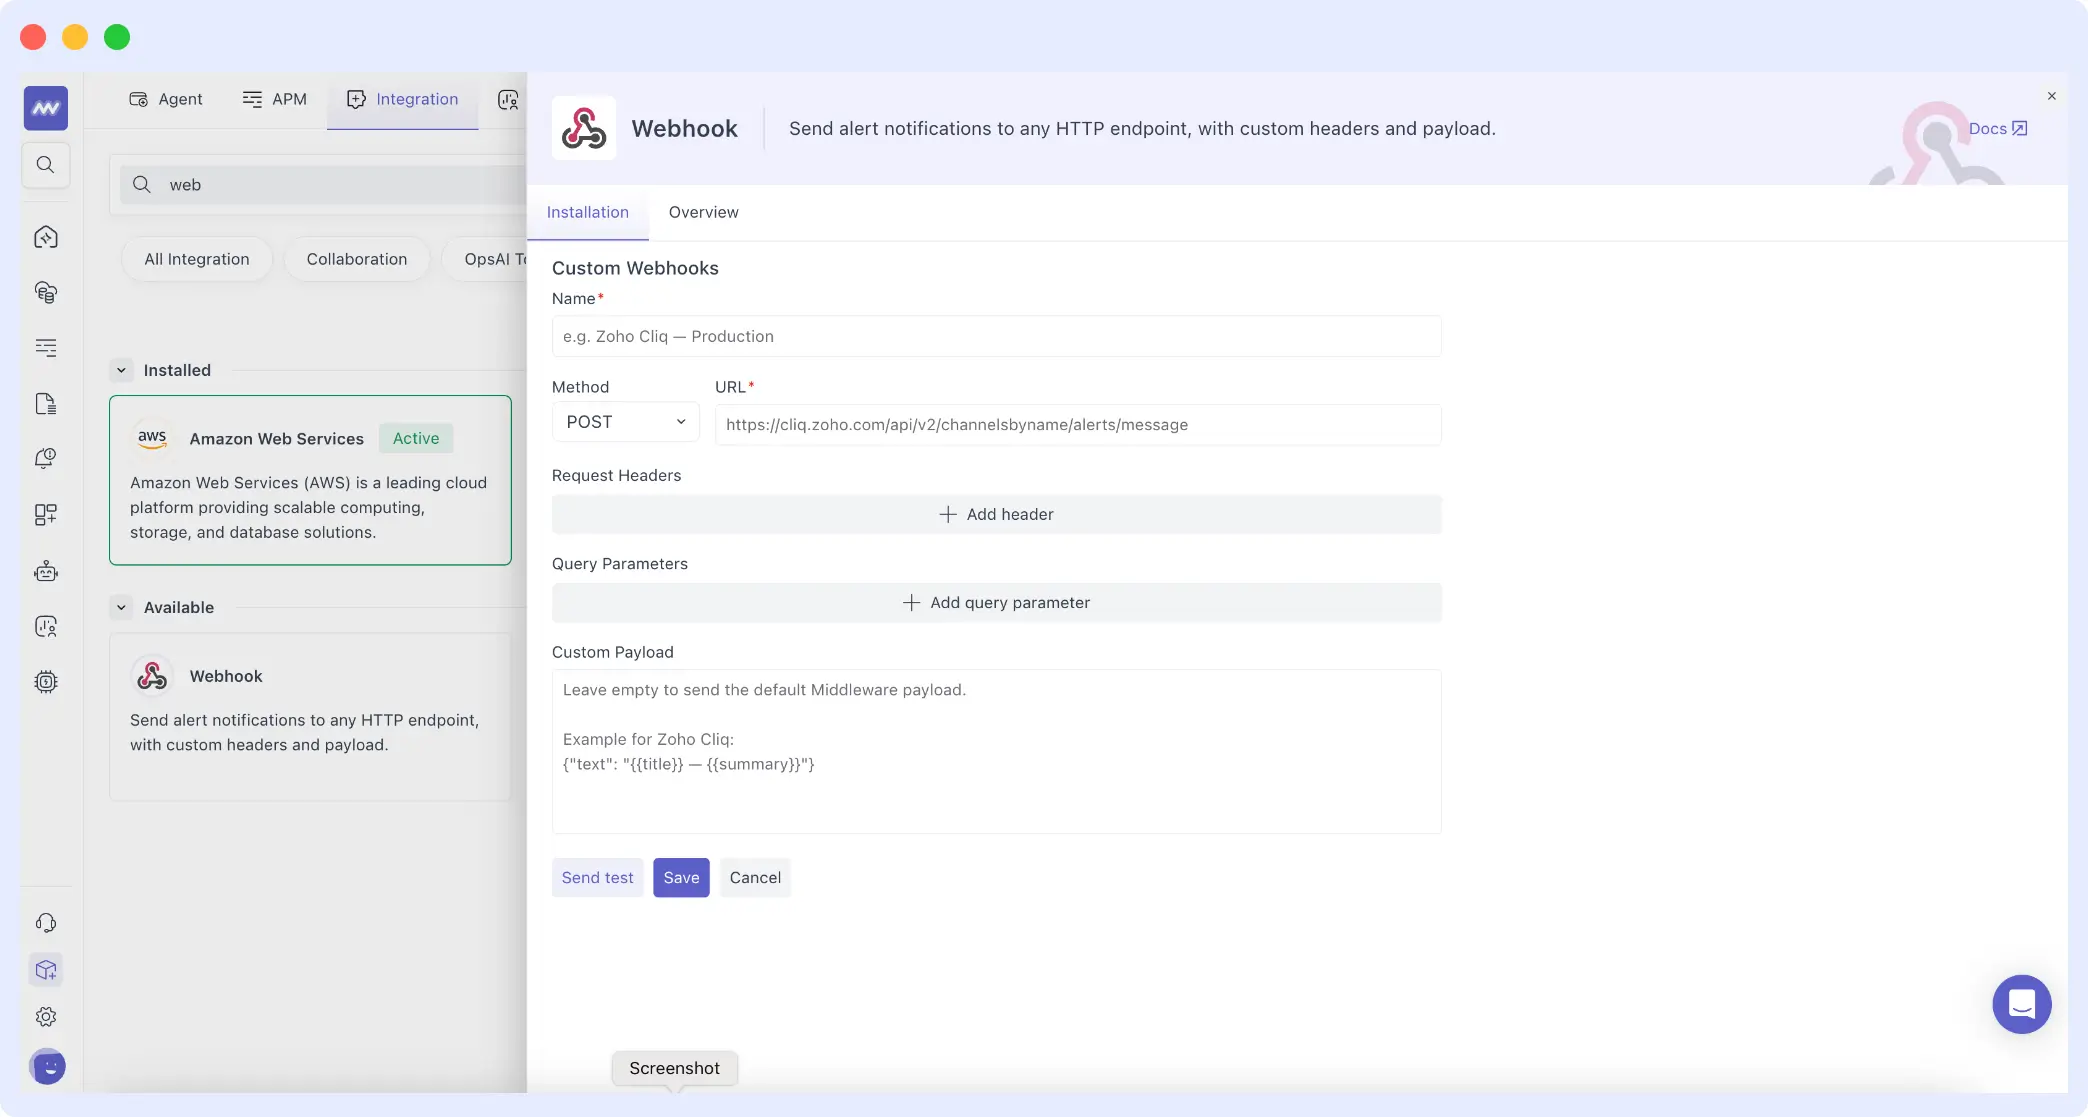
Webhook Notifications
Webhook notifications now support:
- Custom headers
- Custom payloads
Webhook response details are also displayed directly in the UI to simplify troubleshooting.
📱 RUM Enhancements
Upgrade to the latest SDK for Android, iOS, React Native, and Flutter to get the latest performance improvements and features.
New capabilities include:
- Session Replay using real recordings instead of screenshots
- Lower network usage and battery consumption
- Native Crash & ANR reporting
- Symbolicated stack traces (dSYM / Source Maps)
- Heatmaps linked with screen names
- Automatic HTTP instrumentation
- Navigation instrumentation
- Slow and frozen frame detection
These improvements provide deeper mobile visibility while minimizing application overhead.
📜 Log Monitoring
Several improvements make log analysis faster and easier.
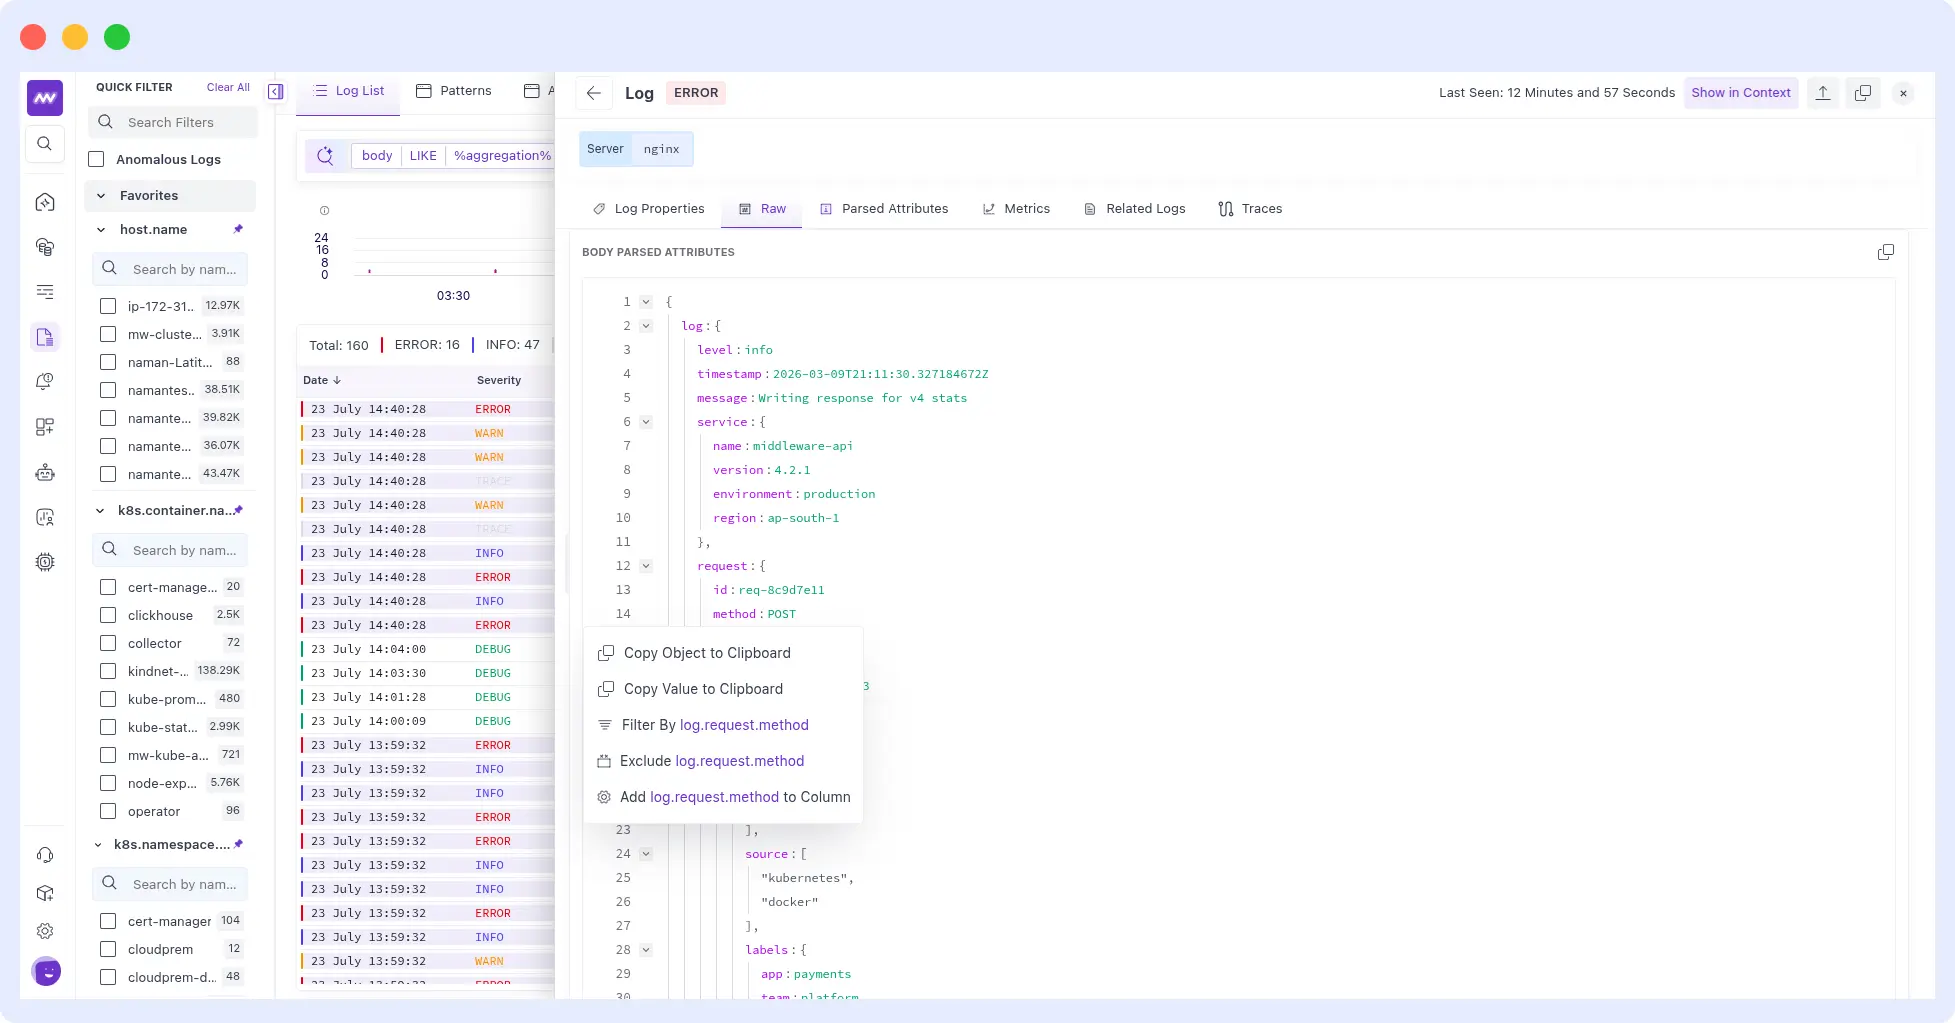
Better JSON Formatting
Updated the JSON formatter to present parsed attributes more clearly.
Faster Log Exploration
You can now directly from the Log Detail panel:
- Filter by an attribute
- Exclude an attribute
- Add an attribute as a column
Quality Improvements
- Fixed Copy Object and Copy Value to remove unnecessary escape characters.
- Optimized queries so log detail panels typically load within 2–3 seconds.
🧪 Synthetic Monitoring
Creating API tests is now much faster.
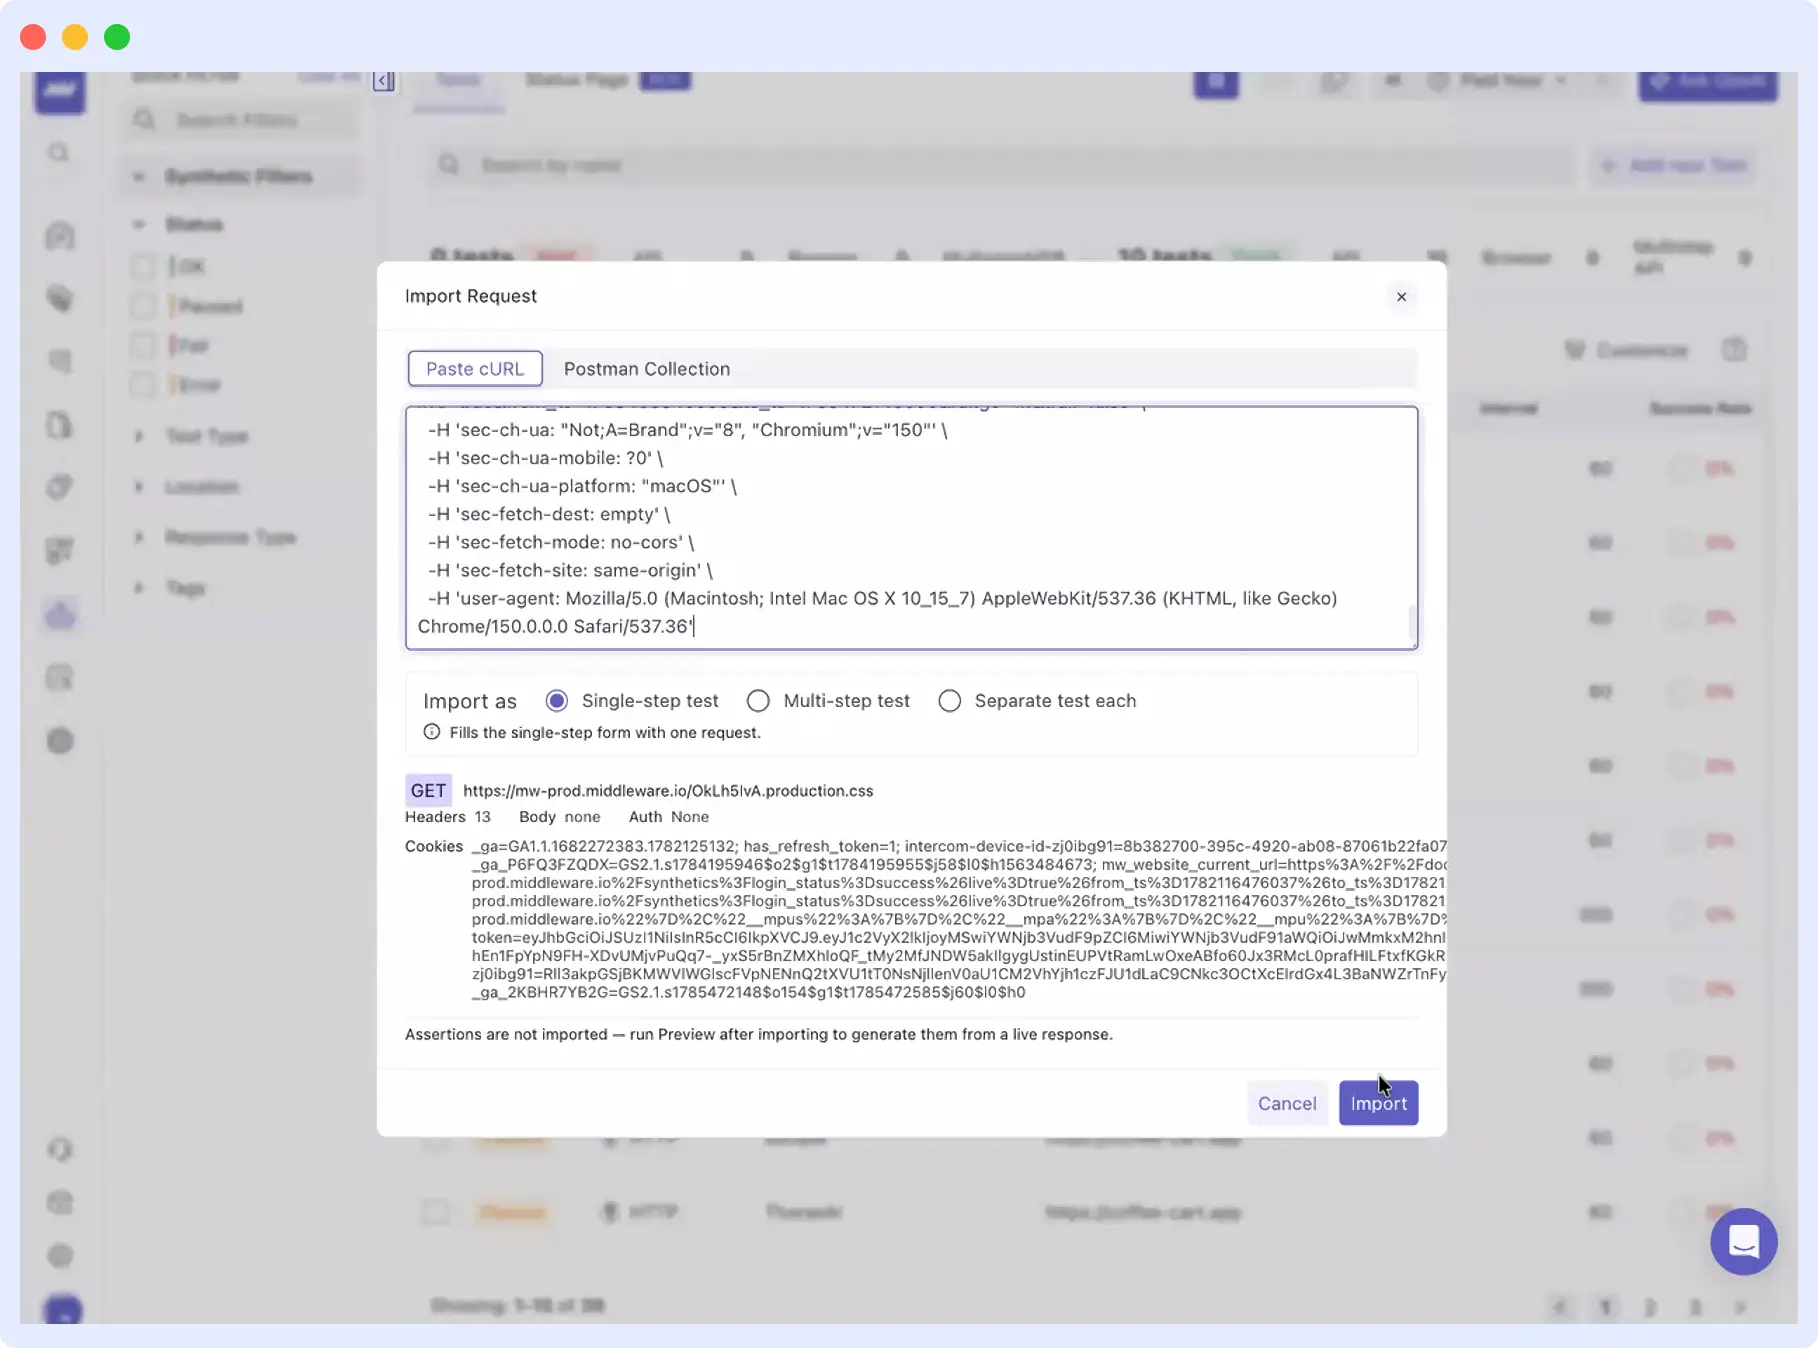
Import from cURL
Paste any cURL command and import it as:
- Single-step test
- Multi-step test
- Separate API tests
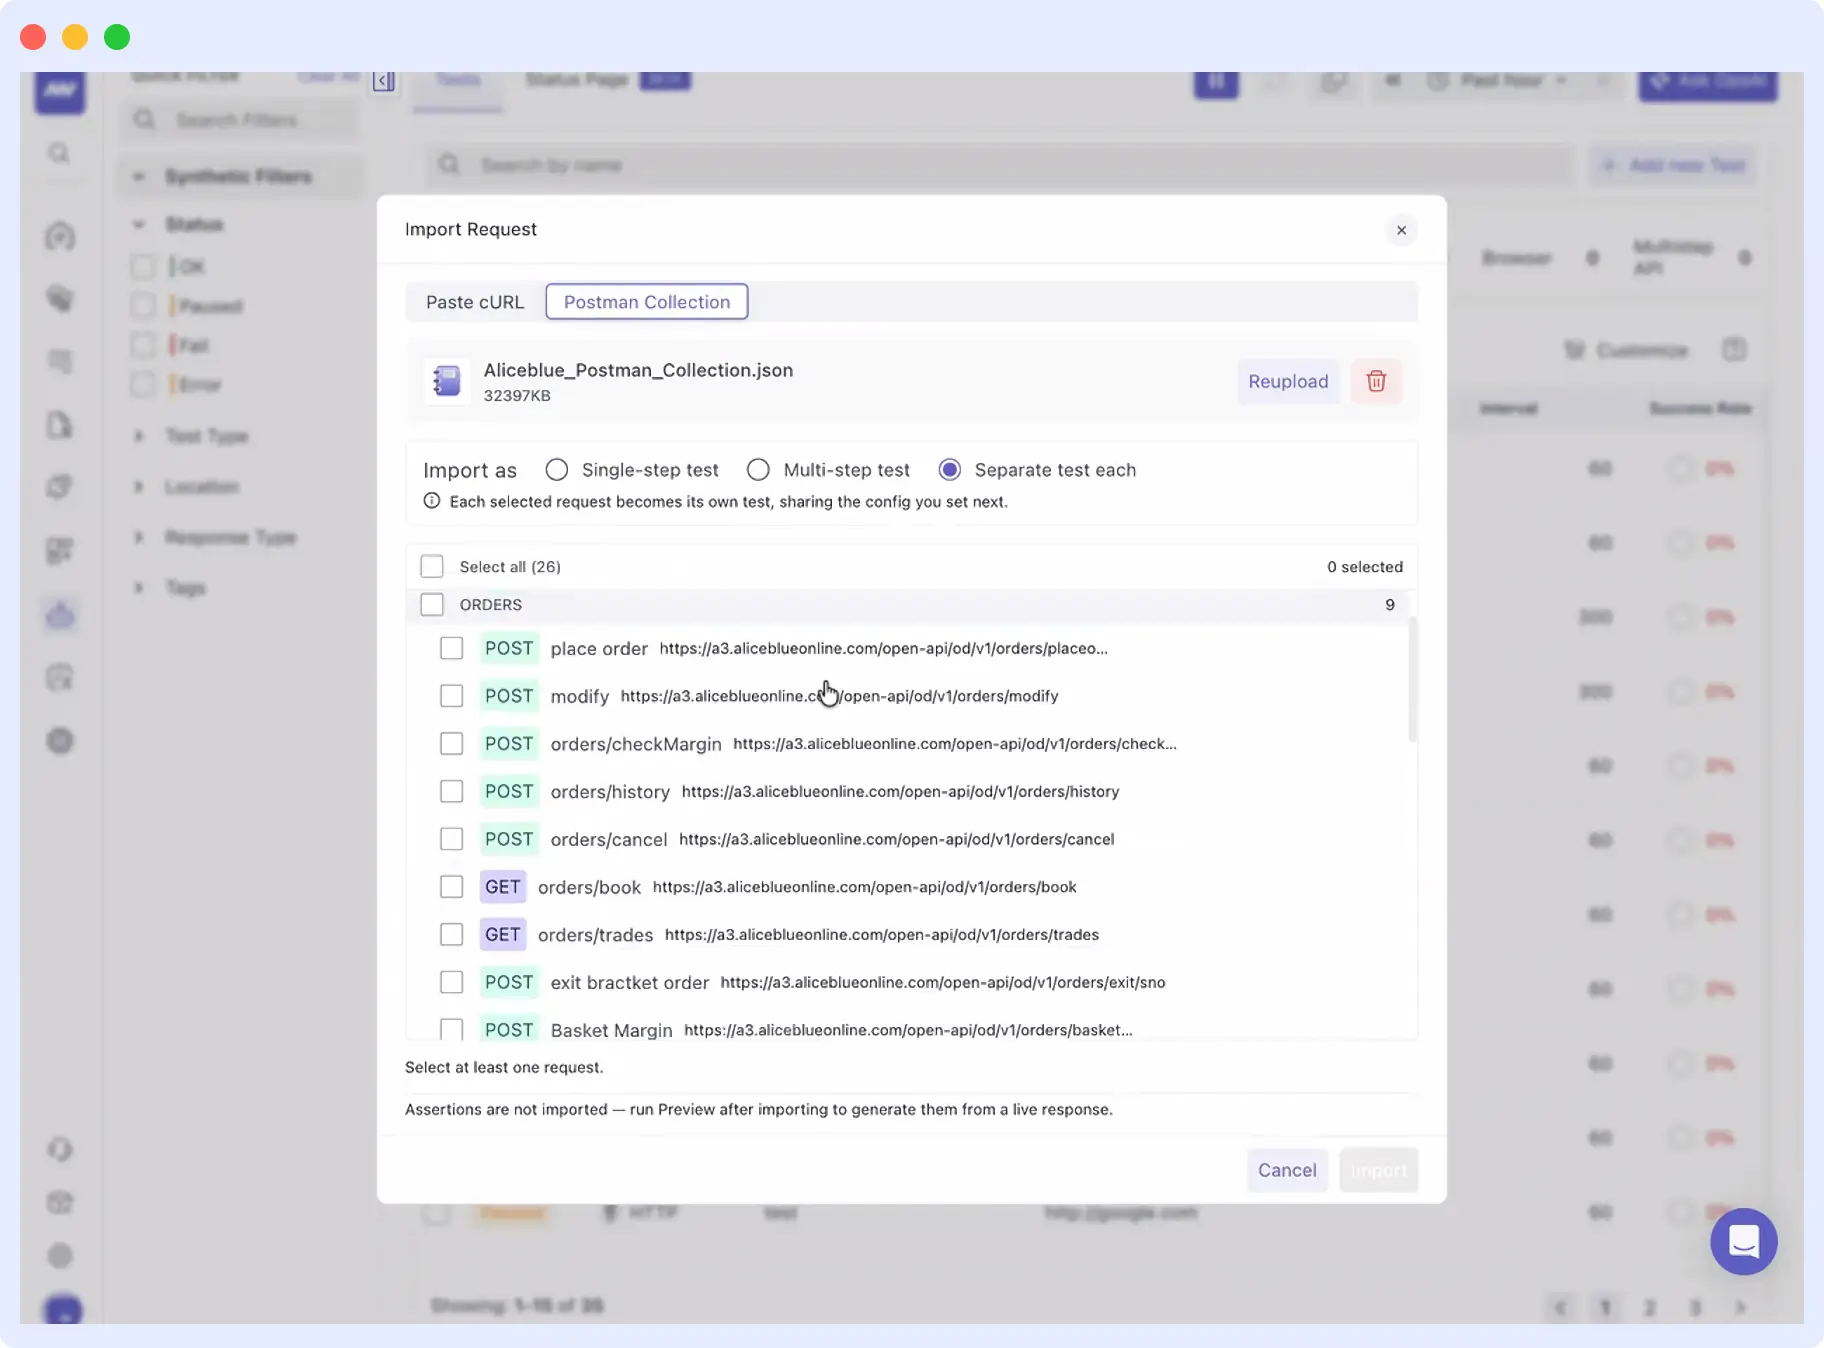
Import from Postman
Upload a Postman collection and select which APIs to import as Synthetic Tests.
No manual recreation required.
☁️ Google Cloud Marketplace
Middleware is now available on Google Cloud Marketplace.
You can now:
- Sign up directly through GCP Marketplace
- Use your existing Google Cloud billing
- Consolidate Middleware costs into your GCP invoice
This simplifies procurement and billing for Google Cloud customers.

