From deep MongoDB monitoring and a major upgrade to LLM Observability, to OpsAI integrations inside your IDE and AI-powered workflows across the platform, this release is packed with features that help you investigate, build, and monitor faster.
Here’s everything new this month 👇
🤖 OpsAI
We expanded OpsAI beyond issue investigation, making it available across the entire platform and directly inside your development workflow.
Remote MCP Support
Middleware now provides a Remote MCP Server, allowing developers to access observability data directly from their IDE or AI coding assistants.
With MCP, you can:
- Query logs, traces, metrics, and alerts without leaving your editor
- Investigate production issues directly from your development environment
- Bring live observability context into AI-assisted coding workflows
Here is the doc for integration.
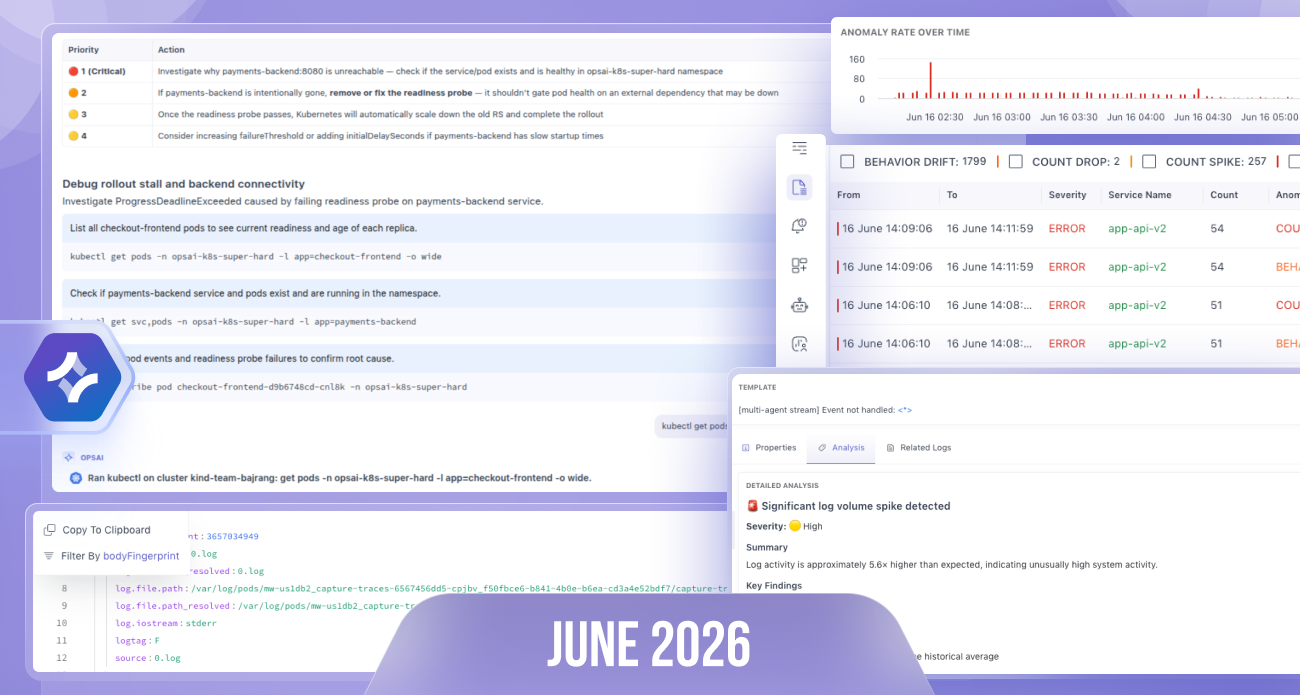
Run Kubernetes Commands During Investigation
OpsAI can now execute Kubernetes commands directly from an investigation or chat.
- One-click execution
- No need to switch to a terminal
- Faster debugging and remediation workflows
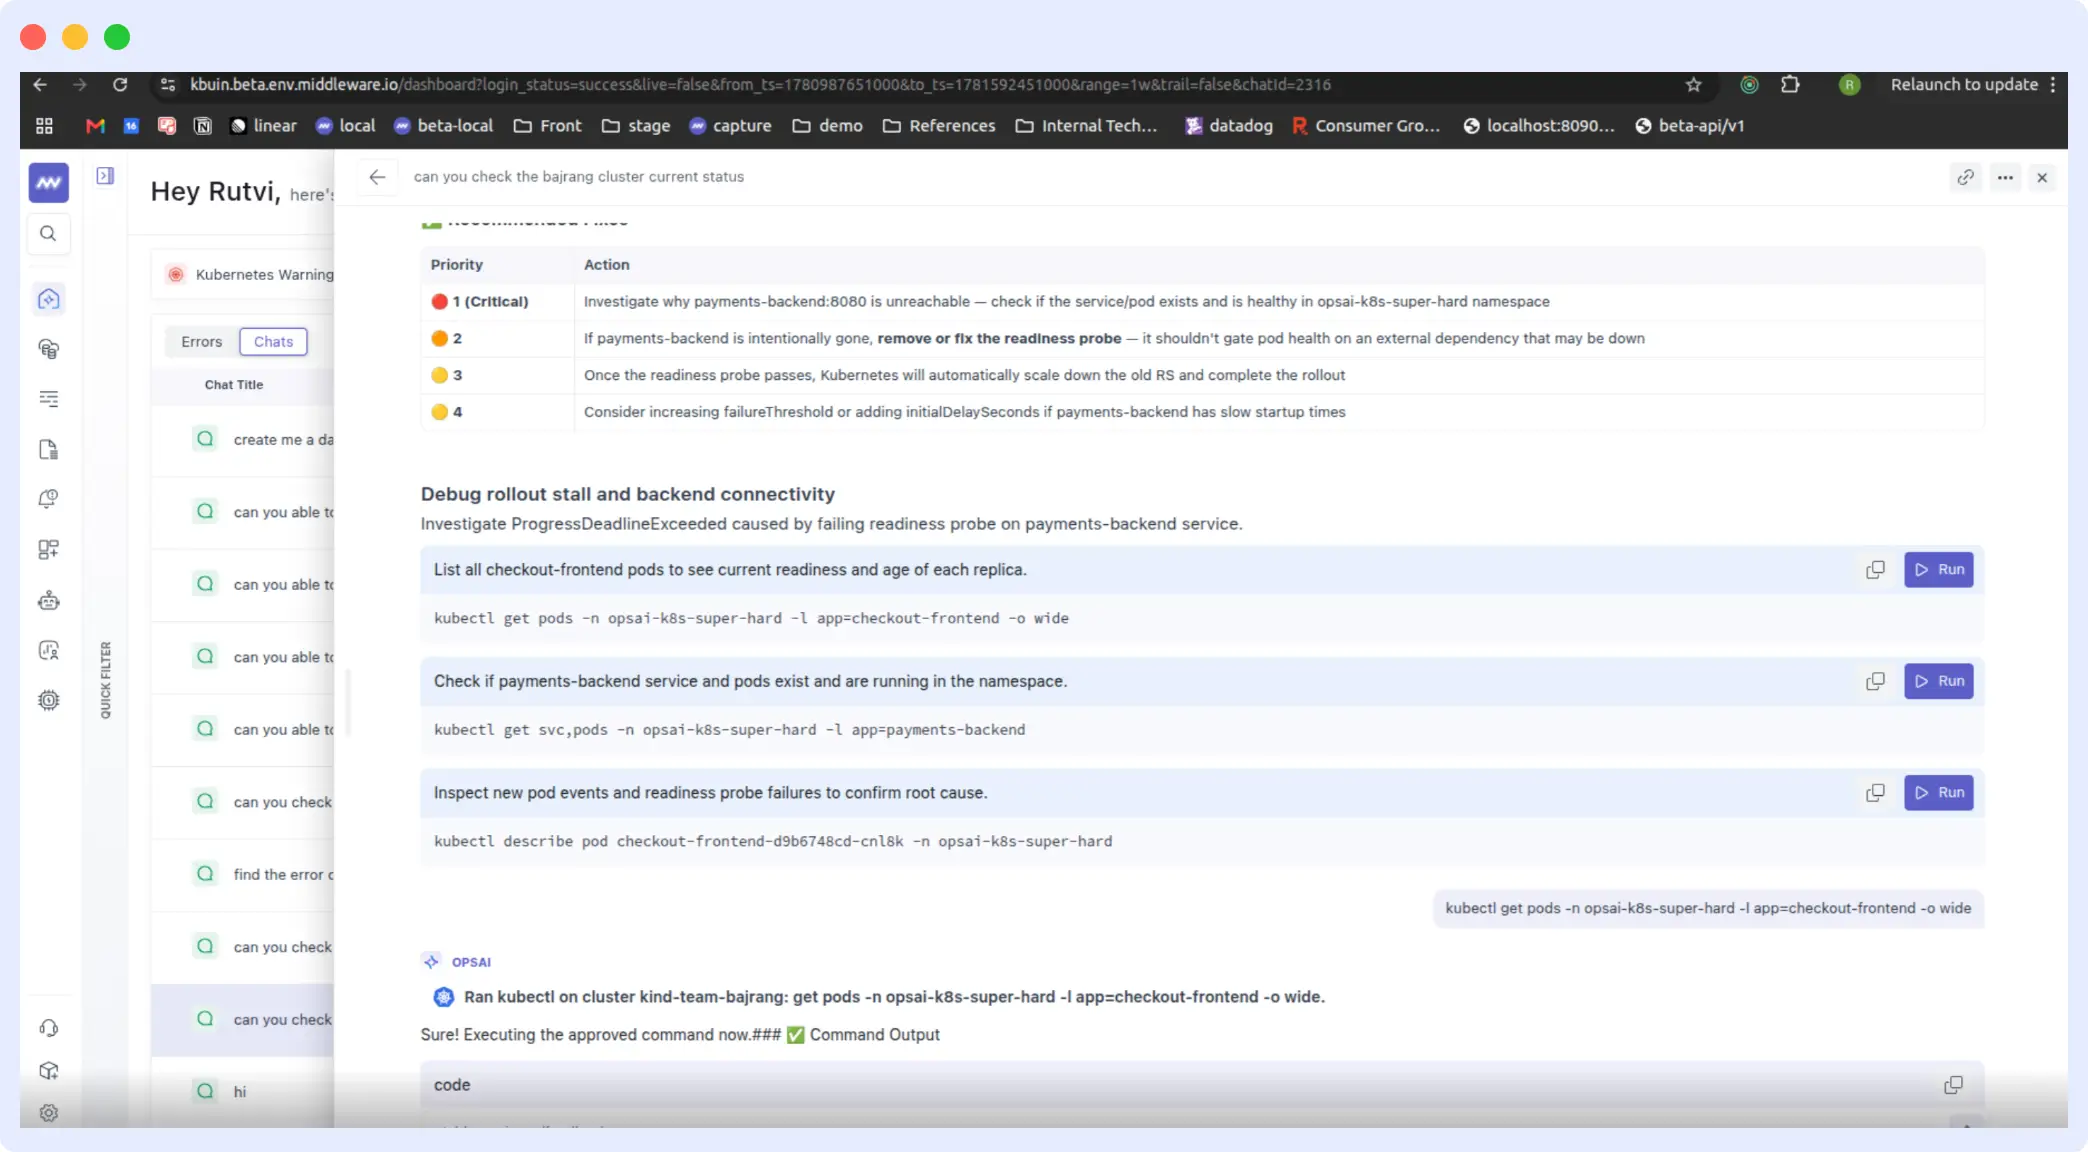
Create Dashboards from Chat
Simply describe the dashboard you need in the chat, and OpsAI will:
- Generate the dashboard
- Configure widgets automatically
- Return a link to the newly created dashboard
Vercel Support
OpsAI now supports:
- Vercel logs
- Fatal errors
These issues appear directly in the OpsAI issue list, allowing you to investigate them and generate GitHub pull requests with suggested fixes.
Synthetic Monitoring with OpsAI
OpsAI can now answer questions about Synthetic Monitoring and create synthetic tests directly from chat.
Examples include:
- Creating uptime checks
- Reviewing test results
- Troubleshooting failed synthetic tests
Ask OpsAI from Anywhere
Every major screen across Middleware now includes an Ask OpsAI button.
Ask questions about the data you’re viewing, or simply ask OpsAI to:
- Create dashboards
- Create alerts
- Explain anomalies
- Analyze metrics, logs, or traces
without leaving your current screen.
RUM Data Support
OpsAI now understands Real User Monitoring (RUM) data.
Start a new chat to:
- Analyze frontend performance
- Investigate user sessions
- Understand browser errors
- Ask questions about user behavior
Navigation Updates
To simplify navigation:
- Removed Error & OpsAI from the left navigation menu
- Updated the Welcome Dashboard with additional filters for quicker access to investigations
🍃 MongoDB Database Monitoring
We’ve introduced several new screens to help teams monitor database performance in greater detail.
New Monitoring Views
- Query Metrics
- Blocking Queries
- Query Samples
Along with new MongoDB performance metrics to monitor overall database health and workload characteristics.
📜 Log Monitoring
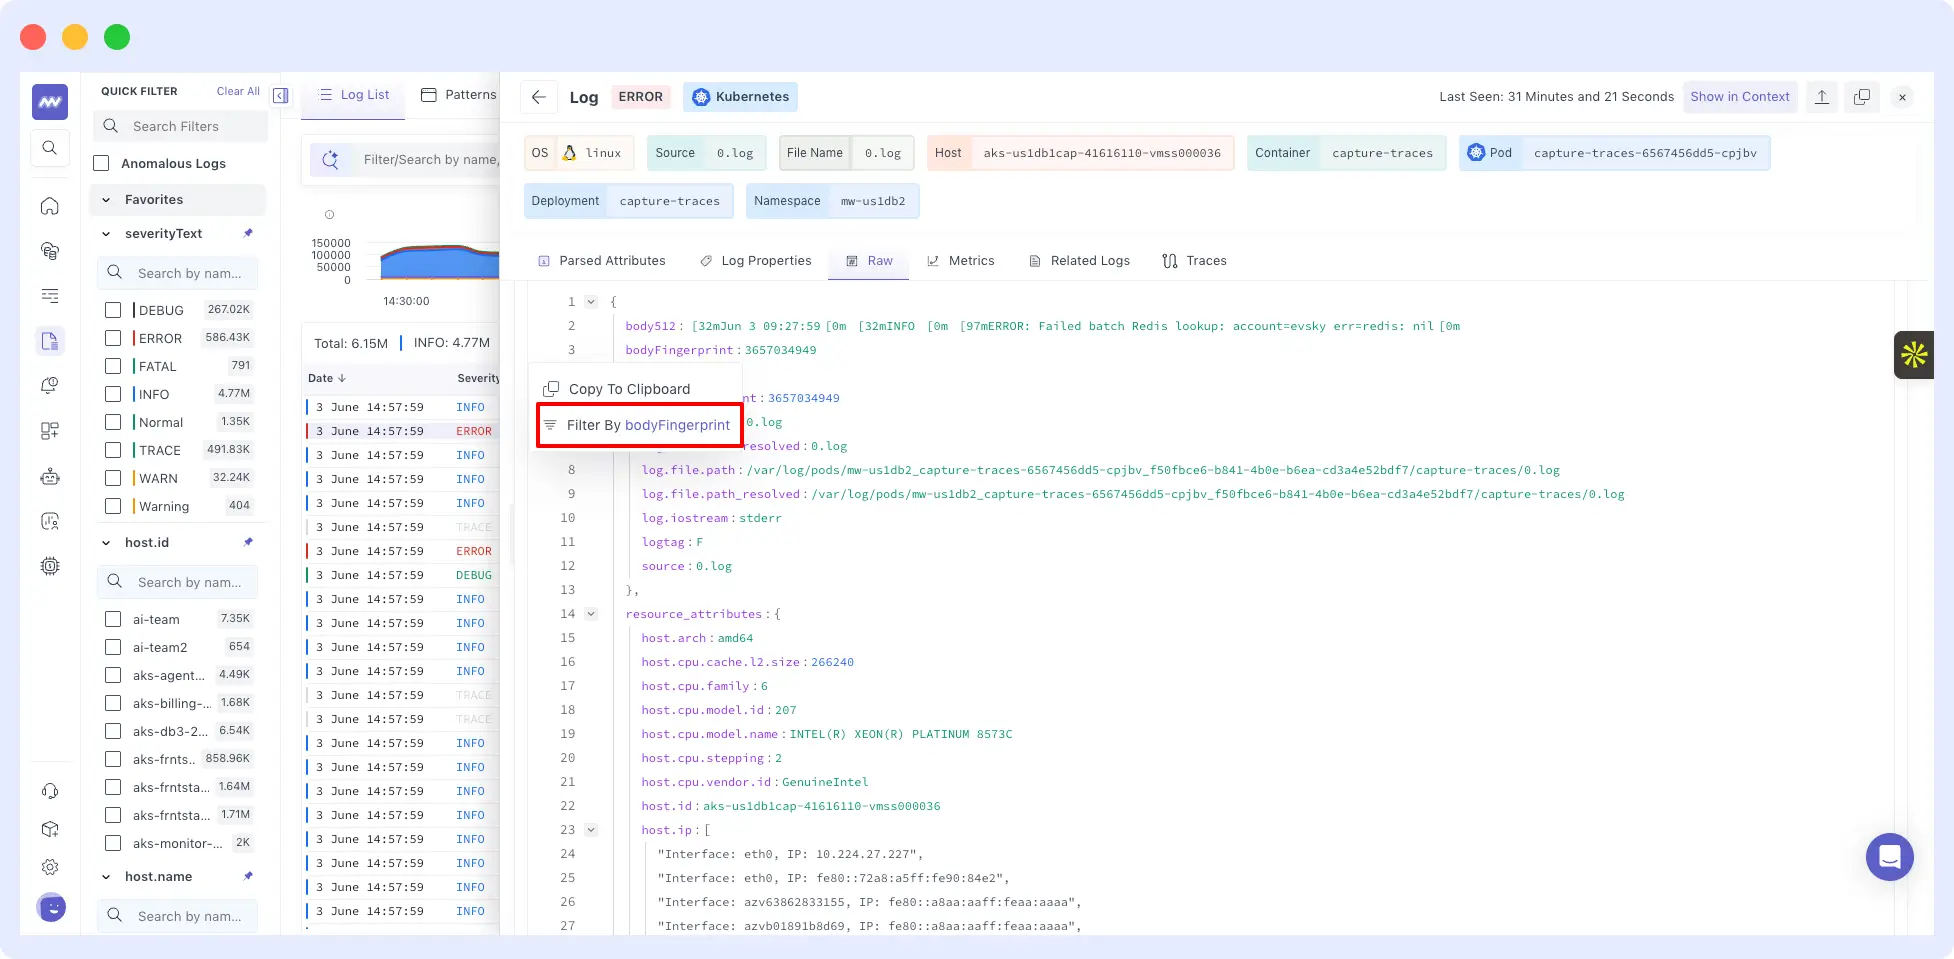
Filter from RAW JSON
You can now apply filters directly from the RAW JSON view using parsed attributes, making log exploration much faster.
Log Anomaly Detection
Detect anomalies such as:
- Count spikes
- Behavior drift
- Pattern inactivity
- Other unexpected log behavior
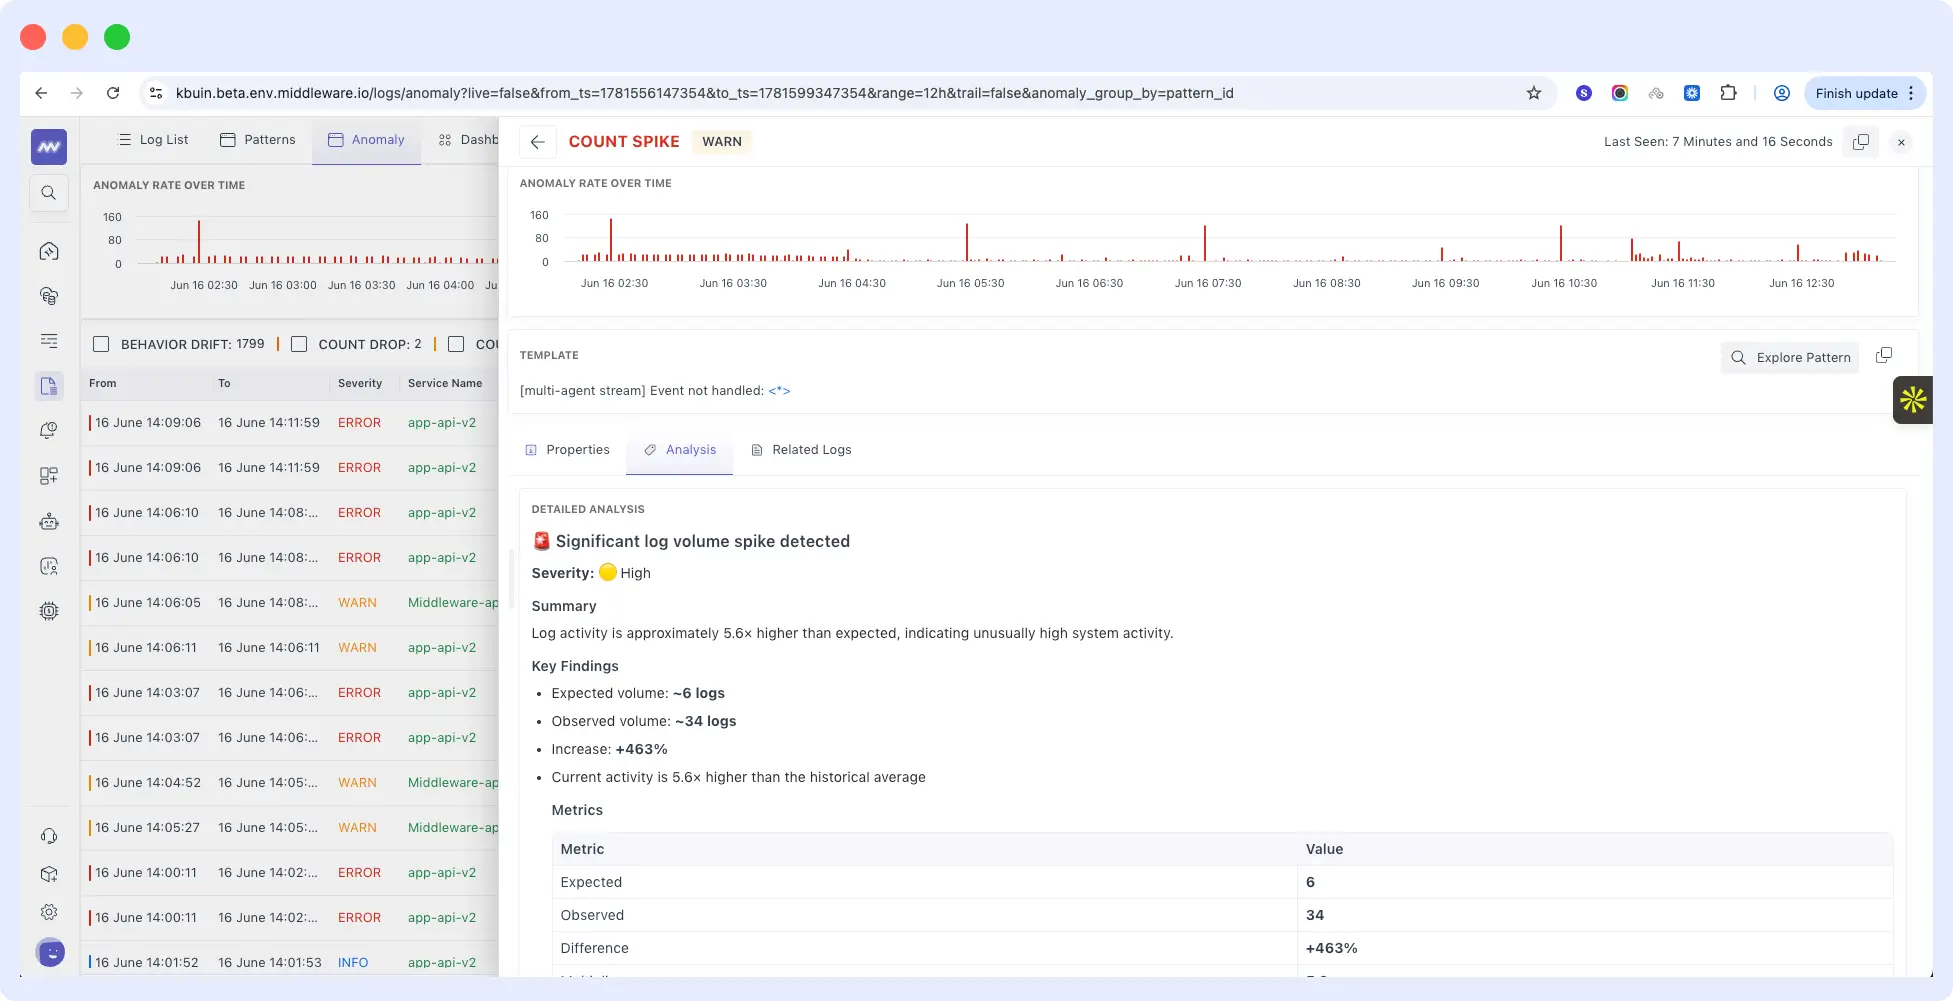
Each anomaly includes a dedicated detail view showing:
- Related log properties
- Matching logs
- AI-generated analysis and insights
🧠 LLM Observability – Major Upgrade
We’ve significantly expanded our LLM Observability capabilities.
Richer LLM Traces
LLM trace details now include:
- Total tokens per request
- Cost
- Model information
- Span details
- Stack traces
- Chat input
- Related logs
Giving complete visibility into every LLM request.
Playground
Experiment with different LLM configurations directly inside Middleware.
You can:
- Choose different models
- Define output schemas
- Add tools
- Test prompts interactively
before deploying them into production.
LLM as a Judge (Evaluation)
Evaluate prompts automatically using another language model.
Configure:
- Evaluation model
- Acceptance criteria
- Scoring rules
- Evaluation scope
OpsAI will judge each prompt and measure its quality against your configured rules.
LLM Dashboard
A brand-new dashboard provides comprehensive visibility into your AI workloads.
Monitor over 50+ charts, including:
- Token usage
- Cost
- Latency
- Error rate
- LLM calls
- Evaluations
- Tool usage
- Request duration
🎮 GPU Monitoring
Monitor GPU infrastructure with detailed device-level insights.
Track metrics including:
- GPU utilization
- Occupancy
- Memory usage
- Temperature
- Power consumption
- Bandwidth
- Running processes
Ideal for AI and ML workloads running on GPU-enabled infrastructure.
🐧 Linux Instrumentation
The Linux Instrumentation experience is now more streamlined.
You can configure:
- Detected databases
- Integrations
directly from the Linux Instrumentation screen without navigating to the Integrations page.
🔌 Kafka Integration
Kafka monitoring now supports Kubernetes deployments.
Monitor Kafka clusters running inside Kubernetes with native integration support.
☁️ S3 Routing
You can now route observability data directly to your own AWS S3 bucket.
Supported data types include:
- Metrics
- Logs
- Traces
A new Settings → S3 Routing page lets you configure:
- AWS Account ID
- Bucket name
- AWS Region
making it easy to archive or export observability data to customer-managed storage.