
AWS CloudWatch is an essential tool for monitoring, analyzing, and acting on key metrics, not only within your AWS environment but also for external applications and services running on-premises or in other cloud platforms. It offers valuable insights into how each AWS service performs, helping you effectively manage and fine-tune your resources.
The purpose of this guide is to provide clear, actionable guidance on using CloudWatch metrics to maintain a well-monitored AWS environment. From configuring alarms to utilizing advanced features like CloudWatch’s custom dashboards, we’ll explore everything CloudWatch offers to keep your infrastructure running at its best.
Understanding AWS CloudWatch
AWS CloudWatch goes beyond basic monitoring—it’s a comprehensive service that helps you gain deep insights into your AWS infrastructure.
One of CloudWatch’s core strengths is its ability to gather data from a wide range of sources, including AWS services and external applications. Whether you’re monitoring the performance of your EC2 instances, tracking database connections in RDS, following Lambda invocations, or collecting metrics from on-premises servers and third-party services via OpenTelemetry, CloudWatch consolidates all these metrics, giving you a centralized view of your entire infrastructure.
Beyond simply collecting metrics, CloudWatch offers an alerting feature. You can set up alarms that notify you when certain thresholds are reached, allowing you to respond to potential issues before they escalate.
These features give you more control and understanding of your AWS environment, offering the insights needed to troubleshoot problems as they occur and maintain a well-functioning infrastructure.
The importance of CloudWatch metrics in AWS resource management
CloudWatch metrics are essential because they provide live data on how both your AWS and non-AWS resources are performing. They help you monitor various aspects of your infrastructure, giving you insights into resource usage and potential problem areas.
For example, metrics like CPU Utilization in EC2 instances, provided by CloudWatch, indicate when a server is experiencing high demand. This can signal the need to either scale up your resources or redistribute traffic to avoid any slowdowns. Similarly, Freeable Memory for RDS, which is tracked by CloudWatch, helps you determine if your database instance requires resizing to handle your workloads more effectively.
CloudWatch is also valuable for managing costs. By examining usage patterns, you might notice that certain instances are consistently running at a fraction of their capacity. For example, if you see that an EC2 instance’s CPU usage never exceeds 10%, it might be an indicator that you’re over-provisioned, and you could switch to a smaller instance type to save on costs.
In comparison to other cloud platforms, AWS CloudWatch stands out with its seamless integration with the entire AWS ecosystem. For instance, Google Cloud uses Cloud Monitoring, and Azure has Azure Monitor—both effective tools but lacks the level of integration CloudWatch offers with AWS-specific services. This tight integration means CloudWatch not only monitors but can also trigger actions (like Auto Scaling) based on the metrics it tracks, making it a more cohesive option for managing AWS resources.
How AWS CloudWatch works
AWS CloudWatch functions by collecting metrics, logs, and events from various sources, including AWS services like EC2, RDS, and Lambda, as well as from on-premises servers, external cloud services, and applications instrumented with OpenTelemetry. These metrics are gathered and made accessible, allowing you to monitor performance and set alarms based on specific thresholds across your entire infrastructure.
Think of CloudWatch as a monitoring hub for your AWS infrastructure. It captures data from different services and translates it into actionable insights, which you can then visualize through dashboards or use to trigger automated actions.
For instance, you can customize CloudWatch Dashboards to display metrics that are crucial for your organization’s operations, such as CPU utilization for EC2 instances or request counts for a load balancer. Alarms can be set to notify you when these metrics reach predefined thresholds. These alarms can also initiate automated responses, like scaling an Auto Scaling group or executing a Lambda function, ensuring that your infrastructure responds promptly to changing conditions without requiring manual intervention.
Core metrics to monitor in AWS CloudWatch
When monitoring your environment, whether it’s on AWS or beyond, several key metrics provide valuable insights into the performance and health of your services. While the metrics mentioned here are essential, always remember that the importance of metrics can vary based on your specific AWS setup and workloads.
- EC2 Metrics: Monitor CPU Utilization and Disk Read Ops to evaluate how well your instances are handling workloads. Consistent high CPU utilization might indicate the need for scaling, while spikes in Disk Read Ops can highlight potential bottlenecks in data access.
- RDS Metrics: Pay close attention to Database Connections and Freeable Memory. These metrics help you understand how your databases are performing and whether they need resizing or optimization to prevent issues like connection throttling.
- Lambda Metrics: Track Invocations and Errors to measure how effectively your serverless functions are executing. Sudden increases in errors can indicate problems with your code or triggers.
- EKS Metrics: Since EKS often contributes significantly to AWS bills, monitoring CPU and Memory Utilization per Pod, Cluster Node Capacity, and Request latency is crucial. These metrics help ensure your Kubernetes clusters are running efficiently and that workloads are evenly distributed across your pods.
CloudWatch allows you to create custom dashboards that visualize these metrics, offering a clear view of your services’ performance and enabling you to quickly identify and address any issues. This comprehensive monitoring ensures that your infrastructure is functioning as expected, reducing the chances of unexpected downtimes or performance degradations.
Hands-on: Creating and using CloudWatch alarms
Monitoring an EC2 instance using CloudWatch helps you keep track of how well your server is handling workloads and enables you to quickly identify and resolve potential issues such as high CPU usage or network traffic. Here’s a comprehensive, step-by-step guide on how to set this up:
Launch your EC2 Instance
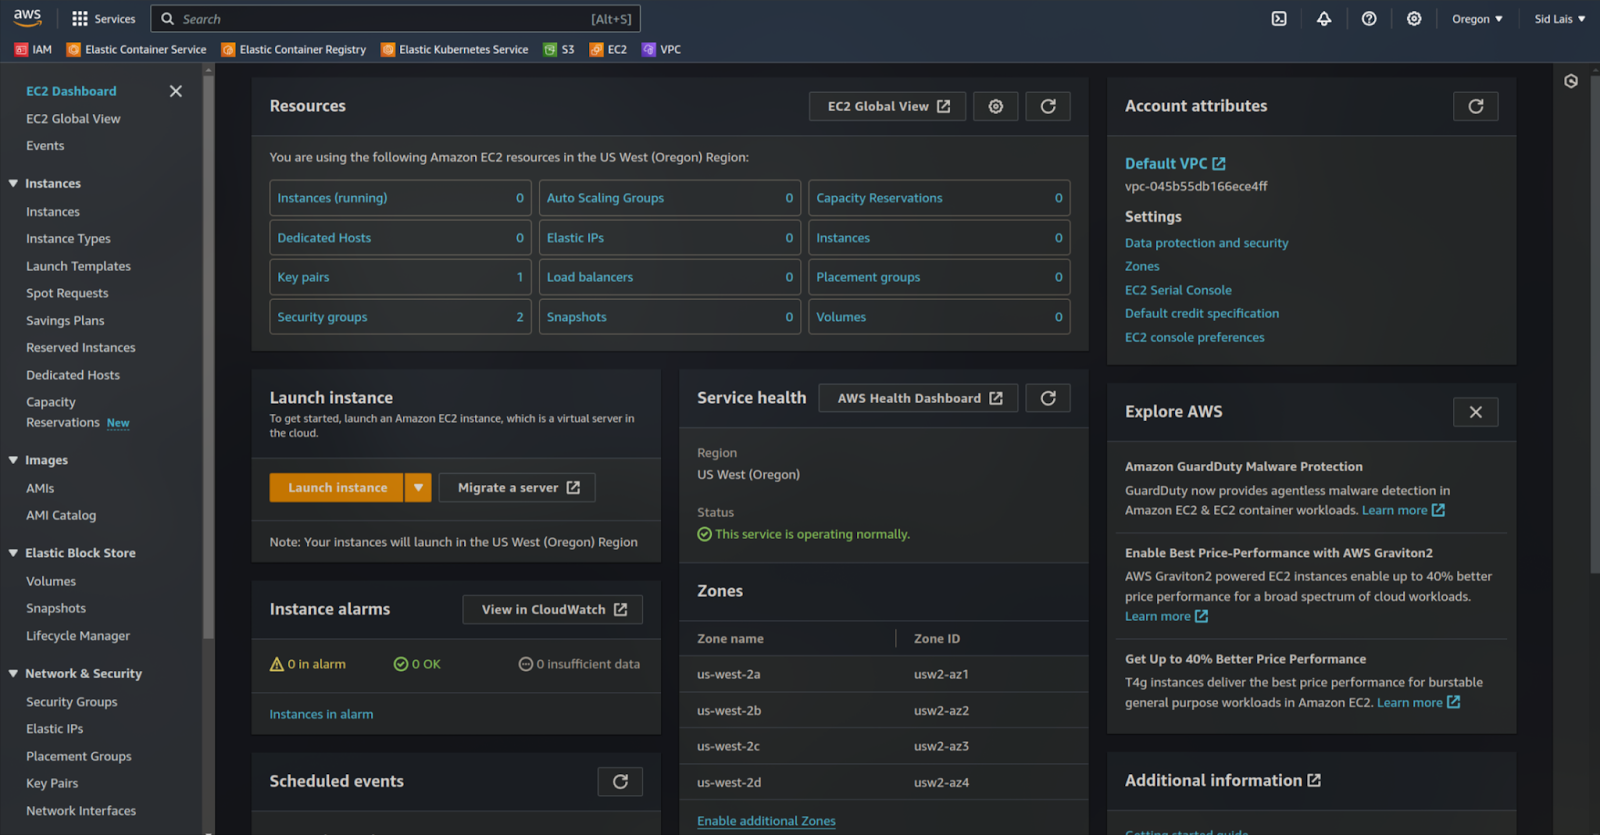
- Start by logging in to the AWS Management Console and navigating to the EC2 service.
- Click on Launch Instance and follow the setup process:
- Choose an Amazon Machine Image (AMI): Select the appropriate AMI, such as Amazon Linux 2 or Ubuntu.
- Instance Type: Choose the instance type that fits your workload, e.g., t2.micro (eligible for the free tier).
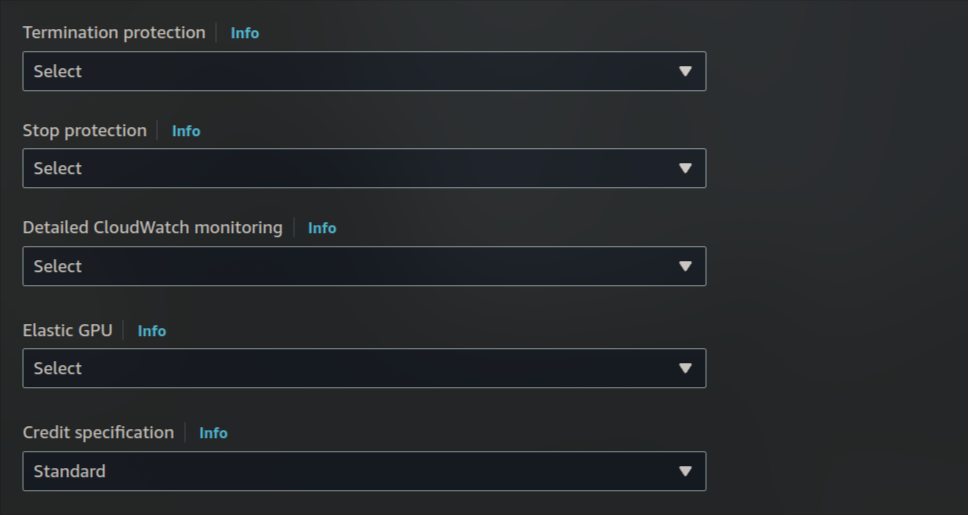
- Configure Instance Details:
- Scroll down to the Monitoring section and enable the Detailed Monitoring checkbox. This option ensures that CloudWatch collects data at 1-minute intervals instead of the default 5-minute intervals, which is essential for catching any sudden spikes in resource usage.
Once your EC2 instance is running, you can proceed to monitor it using CloudWatch.
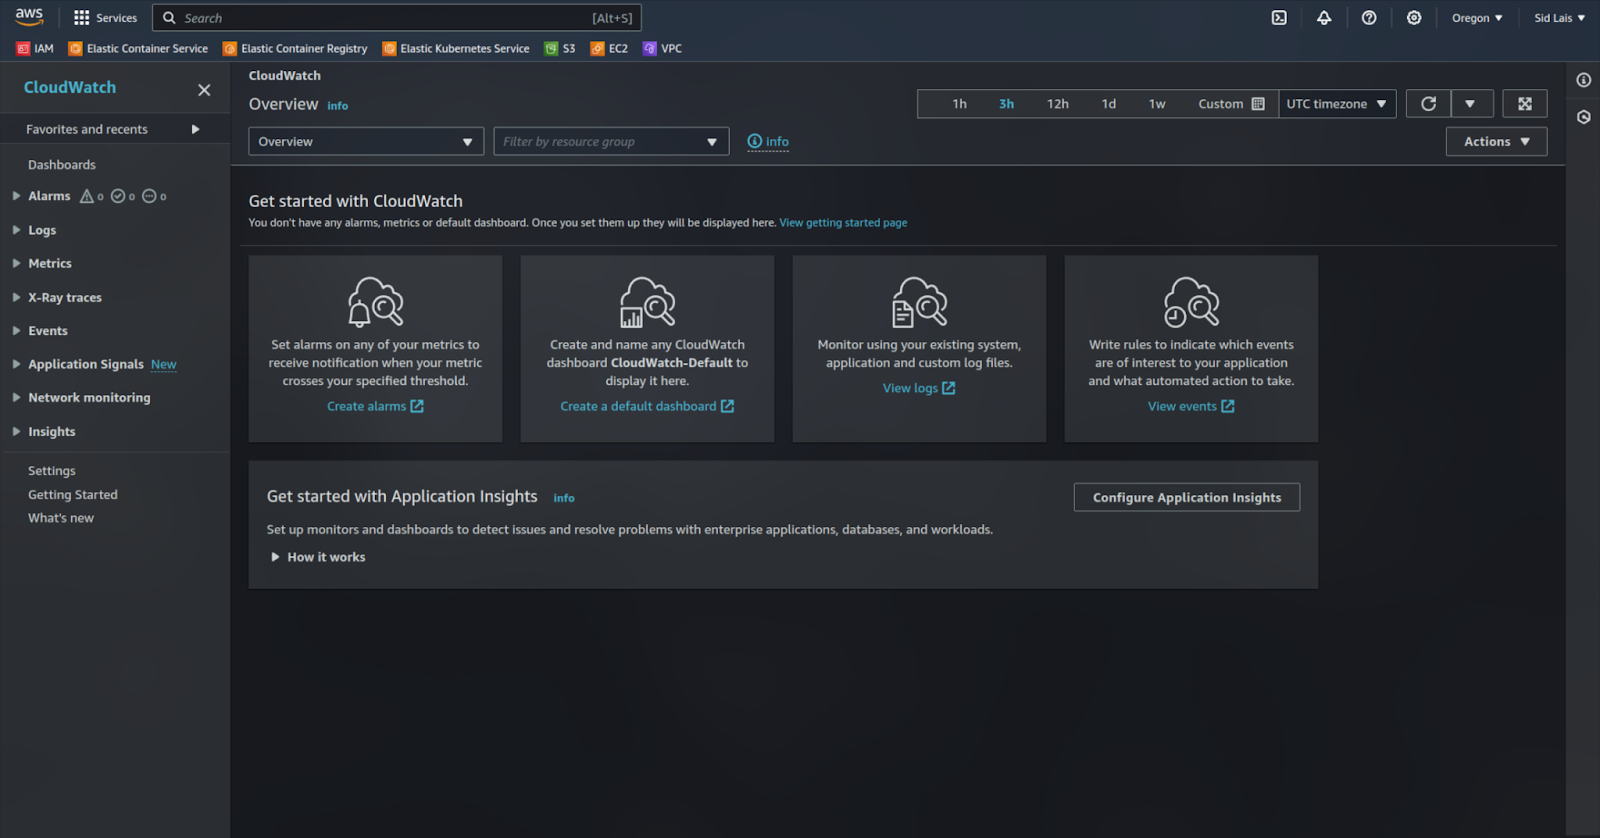
Access CloudWatch from the AWS Console
- After launching your instance, go to the AWS Management Console and open CloudWatch from the list of services. This is your main hub for tracking all the metrics related to your EC2 instance’s performance.
Viewing metrics for your EC2 Instance
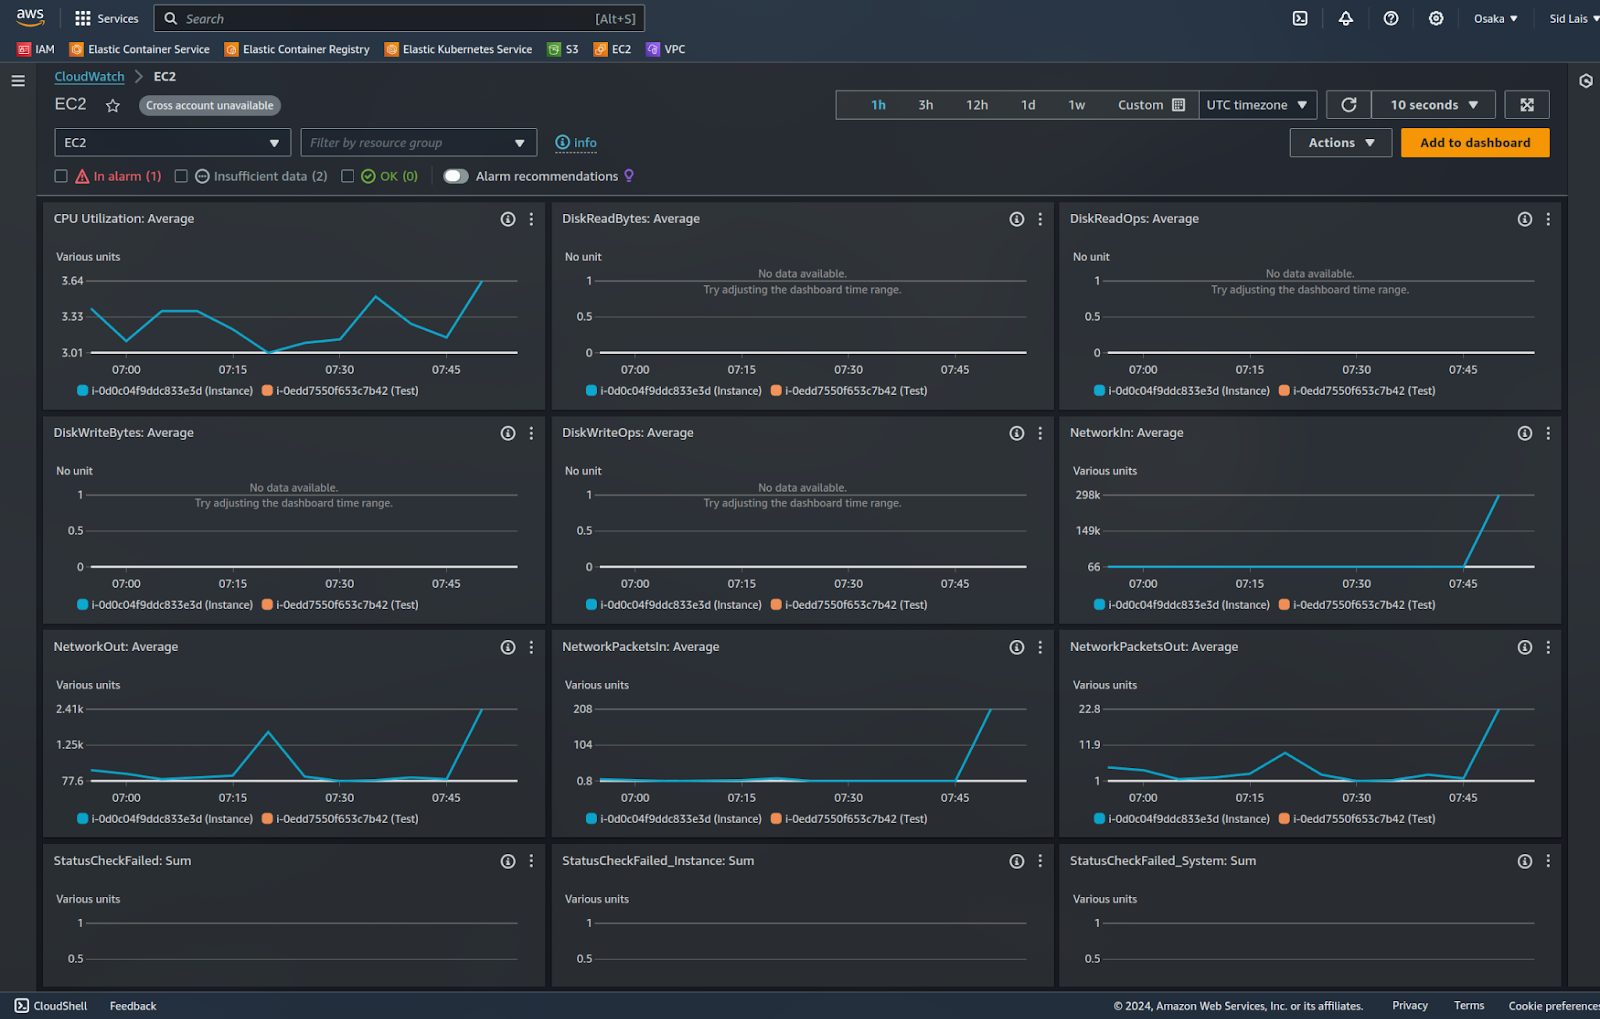
- In CloudWatch, go to the Metrics section and select EC2.
- Click on Per-Instance Metrics to view a list of metrics for your instance.
- Select your instance to see live data for metrics like CPU utilization, network traffic, and disk activity.
Understanding key metrics to monitor
CloudWatch offers a variety of metrics for EC2 instances, but let’s focus on the most important ones:
- CPU Utilization: This metric indicates the percentage of CPU capacity currently in use. For example, if you notice consistently high CPU usage (e.g., above 80%), it may indicate that your instance is struggling with the workload, and you might need to consider upgrading your instance type or optimizing your applications to handle the load more efficiently.
- NetworkIn / NetworkOut: These metrics track the volume of data being received and transmitted by your instance. High values here could indicate increased traffic, which may be normal during peak periods, or unexpected activity if there’s a sudden spike. Monitoring these metrics helps you understand if your application is experiencing heavy traffic or if there’s a potential issue, such as unauthorized data access.
- Disk Read Ops / Disk Write Ops: These metrics show how often your instance reads from or writes to the disk. For instance, Disk Read Ops represents read operations, and Disk Write Ops represents write operations. High values might mean that your application is heavily interacting with data stored on the disk, which can cause slower response times if not managed properly. If your instance is running a database, for example, a spike in these metrics might indicate an increase in read/write queries.
Setting up alarms to monitor your metrics
Once you have a good understanding of these metrics, it’s important to set up alarms to notify you when they go beyond acceptable limits:
- Create an alarm: In the CloudWatch console, navigate to Alarms and click Create Alarm.
- Choose a metric: Select the metric you want to monitor (e.g., CPU Utilization).
- Set a threshold: Define when the alarm should trigger. For example, set the alarm to activate when CPU usage exceeds 80%. This threshold can be adjusted based on your specific needs.
- Configure notifications:
- Use Amazon Simple Notification Service (SNS) to send alerts. SNS is a messaging service that sends notifications to multiple endpoints like email, SMS, or Lambda functions.
- Create an SNS topic (e.g., “EC2-High-CPU-Alert”) and subscribe to it with your email address to receive notifications.
Testing and validating your CloudWatch alarms
To ensure your alarms are functioning correctly, you can simulate the load on your EC2 instance:
- Install the stress Tool:
- If you’re using an Amazon Linux 2 instance, install it using
sudo yum install stress -y - For Ubuntu, use
sudo apt-get update && sudo apt-get install stress -y
- If you’re using an Amazon Linux 2 instance, install it using
- Run a Test Load:
- Execute the following command to generate CPU load for 5 minutes:
stress –cpu 4 –timeout 300 - This command will push your CPU utilization up, allowing you to check if your alarm triggers correctly in CloudWatch.
- Execute the following command to generate CPU load for 5 minutes:
Why this monitoring matters
Monitoring your EC2 instance isn’t just about observing metrics; it’s about understanding how your infrastructure behaves. This process provides valuable insights into the performance and stability of your instance. For example, if your instance shows consistently high CPU usage, it could indicate that it’s struggling to handle the workload. Similarly, a sudden increase in disk activity might signal that your application is generating more data than expected, which could lead to running out of storage space.
By consistently monitoring these metrics, you’ll be well-equipped to take timely action, whether that involves scaling up resources to meet demand, fine-tuning your application to improve efficiency, or investigating any unusual spikes in traffic or resource usage. This proactive approach ensures that your AWS environment remains reliable and responsive to changing conditions.
Use Middleware to monitor AWS CloudWatch metrics
Middleware is a full-stack cloud observability platform that integrates with AWS CloudWatch and offers pre-built dashboards. It simplifies cloud management by making metrics more accessible and actionable for your team. Middleware is known for its straightforward setup and smooth integration with CloudWatch, allowing you to gain deeper insights into your AWS infrastructure’s performance.
Key features:
- Ready-to-use dashboards designed for AWS environments, helping you visualize your data without extensive setup.
- Quick and easy integration with CloudWatch for a complete overview of your AWS environment.
Best practices for using AWS CloudWatch metrics
To truly leverage AWS CloudWatch and ensure effective monitoring, consider the following advanced practices:
Set alarms with appropriate thresholds and anomaly detection
- Use dynamic alarms: Instead of setting static thresholds (e.g., CPU > 80%), use anomaly detection to create alarms that adapt to normal patterns of your workload. This helps reduce false positives and catch unusual behavior more accurately.
- Create multi-condition alarms: Set up composite alarms that trigger only when multiple conditions are met, such as high CPU utilization and low available memory. This prevents unnecessary alerts and ensures that you only get notified about significant issues.
Monitor custom metrics for business-critical data
- Collect custom metrics: Use CloudWatch’s ability to collect custom metrics relevant to your specific application or business logic, such as transaction latency, user login counts, or payment failures. This ensures that you monitor aspects beyond the basic system metrics.
- Set up custom dashboards: Create dashboards that include a mix of AWS service metrics and your custom metrics, offering a complete picture of your application’s health.
Enable detailed monitoring of critical resources
- Go beyond basic monitoring: Enable detailed monitoring (1-minute intervals) for critical resources such as production EC2 instances and RDS databases. This provides more granular visibility and helps quickly identify short-lived performance issues.
- Use high-resolution metrics: For highly dynamic or high-traffic resources, leverage high-resolution metrics (with 1-second granularity) to capture even the smallest fluctuations in performance.
Implement log monitoring and analysis
- Utilize CloudWatch Logs Insights: Regularly use CloudWatch Logs Insights to run SQL-like queries against your log data. This helps identify patterns, troubleshoot issues, and gain insights without having to transfer logs to a different service.
- Centralized log management: Collect logs from multiple sources (EC2 instances, Lambda functions, on-premises servers) into a single CloudWatch Logs group. This provides a unified view, making it easier to monitor and debug across the entire application stack.
Combine CloudWatch with automation tools
- Use AWS Systems Manager automation documents: Create automation documents in Systems Manager that CloudWatch can trigger in response to alarms, such as restarting services, clearing caches, or scaling up resources automatically.
- Automate responses with AWS Lambda: Set up Lambda functions to respond to CloudWatch Alarms for routine tasks like archiving logs when storage is low, clearing disk space, or performing automated recovery actions.
- Integrate with OpenTelemetry for Non-AWS monitoring: Use OpenTelemetry to collect metrics, logs, and traces from non-AWS applications and infrastructure, allowing you to send this data to CloudWatch. This integration helps you gain a unified view of your entire environment, making CloudWatch even more effective as a centralized monitoring solution.
Use resource-level permissions for CloudWatch access
- Implement fine-grained access control: Configure IAM policies to grant CloudWatch access only to the specific resources and metrics each team or service needs. This helps maintain security and prevents unauthorized access to sensitive metrics.
- Segment dashboards by role: Create role-specific dashboards for different teams (e.g., DevOps, Security, Developers), so they only see the metrics relevant to their responsibilities.
Enable CloudWatch Contributor Insights
- Identify usage patterns: Enable CloudWatch Contributor Insights to analyze the top contributors to performance bottlenecks, high traffic, or errors in your environment. This tool helps you pinpoint which resources or clients are driving the most activity and focus your troubleshooting efforts accordingly.
Regularly review and clean up CloudWatch alarms and dashboards
- Avoid alarm tatigue: Periodically review and adjust your alarms to ensure they remain relevant and reduce unnecessary alerts. Remove alarms for resources that are no longer in use.
- Archive and rotate logs: Implement log retention policies that automatically archive or delete old logs to manage costs and ensure that CloudWatch Logs remain manageable.
By incorporating these best practices, you’ll gain deeper insights into your AWS environment, automate routine responses to issues, and maintain tighter control over your infrastructure’s health. This approach ensures that your monitoring strategy is both effective and tailored to the needs of your applications and business.
Conclusion
AWS CloudWatch metrics are an essential tool for managing and optimizing your AWS and non-AWS resources. They provide real-time visibility into your infrastructure’s performance and allow you to take action before problems arise.
Looking ahead, integrating CloudWatch with machine learning services like SageMaker can help predict anomalies and optimize resource usage automatically. Additionally, leveraging AWS Lambda for automated responses to CloudWatch alarms can help you further streamline operations.
What is AWS CloudWatch for?
AWS CloudWatch is a monitoring and observability service that provides real-time insights into your AWS infrastructure and applications. It collects and tracks metrics, monitors log files, sets alarms, and helps you respond to changes in your AWS environment, making it easier to maintain the health and performance of your resources.
What is CloudWatch vs CloudTrail?
AWS CloudWatch and CloudTrail serve different purposes:
CloudTrail tracks and logs all API activity across your AWS account, offering an audit trail of who did what, when, and where in your AWS environment. It’s primarily used for auditing and security purposes.
CloudWatch focuses on monitoring AWS resources and applications, providing metrics, logs, and alarms for performance and operational health.
Is CloudWatch a monitoring service?
Yes, AWS CloudWatch is a comprehensive monitoring service designed to track metrics, monitor logs, and set up alarms for AWS resources and on-premises infrastructure. It helps you gain visibility into the health and performance of your environment, enabling proactive management.
What is the use of CloudWatch Logs?
CloudWatch Logs allows you to collect, monitor, and analyze log data from your AWS resources and applications in real time. You can use it to troubleshoot issues, track application behavior, set alarms based on log patterns, and even retain logs for compliance and auditing purposes.