AI SRE tools/agents are software systems that use large language models(LLMs) and observability data to detect anomalies, investigate root causes, and automate remediation during production incidents.
SRE agents integrate with telemetry sources such as APM, logs, and infrastructure metrics to correlate signals across services. In practice, they automate work that SRE teams traditionally perform manually, including alert triage, failure tracing in distributed systems, and generating or executing fixes.
TL;DR
- AI SRE tools are software agents that use LLMs and observability data to automatically detect incidents, investigate root causes, and fix production issues, reducing the manual work traditionally done by SRE teams.
- This blog compares the 10 best AI SRE tools in 2026 across detection, investigation and remediation capabilities:
- OpsAI by Middleware: best end-to-end tool; goes from detection to code-level fix and automated PR in one flow, built natively on full-stack observability
- Bits AI by Datadog: a strong investigation agent for teams already in the Datadog ecosystem
- Plus 8 others, including Resolve AI, PagerDuty AIOps, Grafana IRM, and more
- Bottom line:Most tools do one or two stages well (detect or investigate). OpsAI by Middleware is one of the few that handles all three, detection, root cause analysis, and automated code fix, within a single platform, without stitching tools together.
How AI SRE Tools Work
An AI SRE agent is a software layer that sits between your observability data and your engineering team. It uses large language models to automate three stages of incident response:
- Detection: Continuously monitor APM traces, infrastructure metrics, logs, and error rates to surface anomalies before manual triage
- Investigation: Correlate signals across services, deployments, and logs to identify probable root causes and separate real issues from noise
- Remediation: Generate suggested fixes, pull requests, or infrastructure commands depending on the tool’s capability
Unlike traditional monitoring, which focuses on collecting and displaying data, AI SRE agents act on that data. They connect signals across systems, identify patterns, and guide or automate the path to resolution.
This guide reviews the 10 best AI SRE tools available in 2026, what each one actually does well, where it falls short, and which teams it’s genuinely right for.
10 Best AI SRE Tools & Agents in 2026
1. OpsAI by Middleware
Type: Full-stack AI SRE — Detection → Investigation → Code-level Fix
Middleware is a full-stack observability platform, and OpsAI is its AI SRE agent layer built directly on top of that data. Instead of relying on integrations with external monitoring tools, it operates on a unified telemetry pipeline across metrics, logs, traces, infrastructure, and Real User Monitoring (RUM). That native access is what makes its analysis accurate and its fixes actionable.
OpsAI works in three stages. It continuously monitors your application stack, including APM traces, RUM, Kubernetes, and alerts from tools like Datadog and Grafana and surfaces issues across frontend and backend without waiting for manual triage. When an issue is detected, it pulls in alert data, identifies the affected service, and correlates logs, metrics, and traces to separate real regressions from noise.
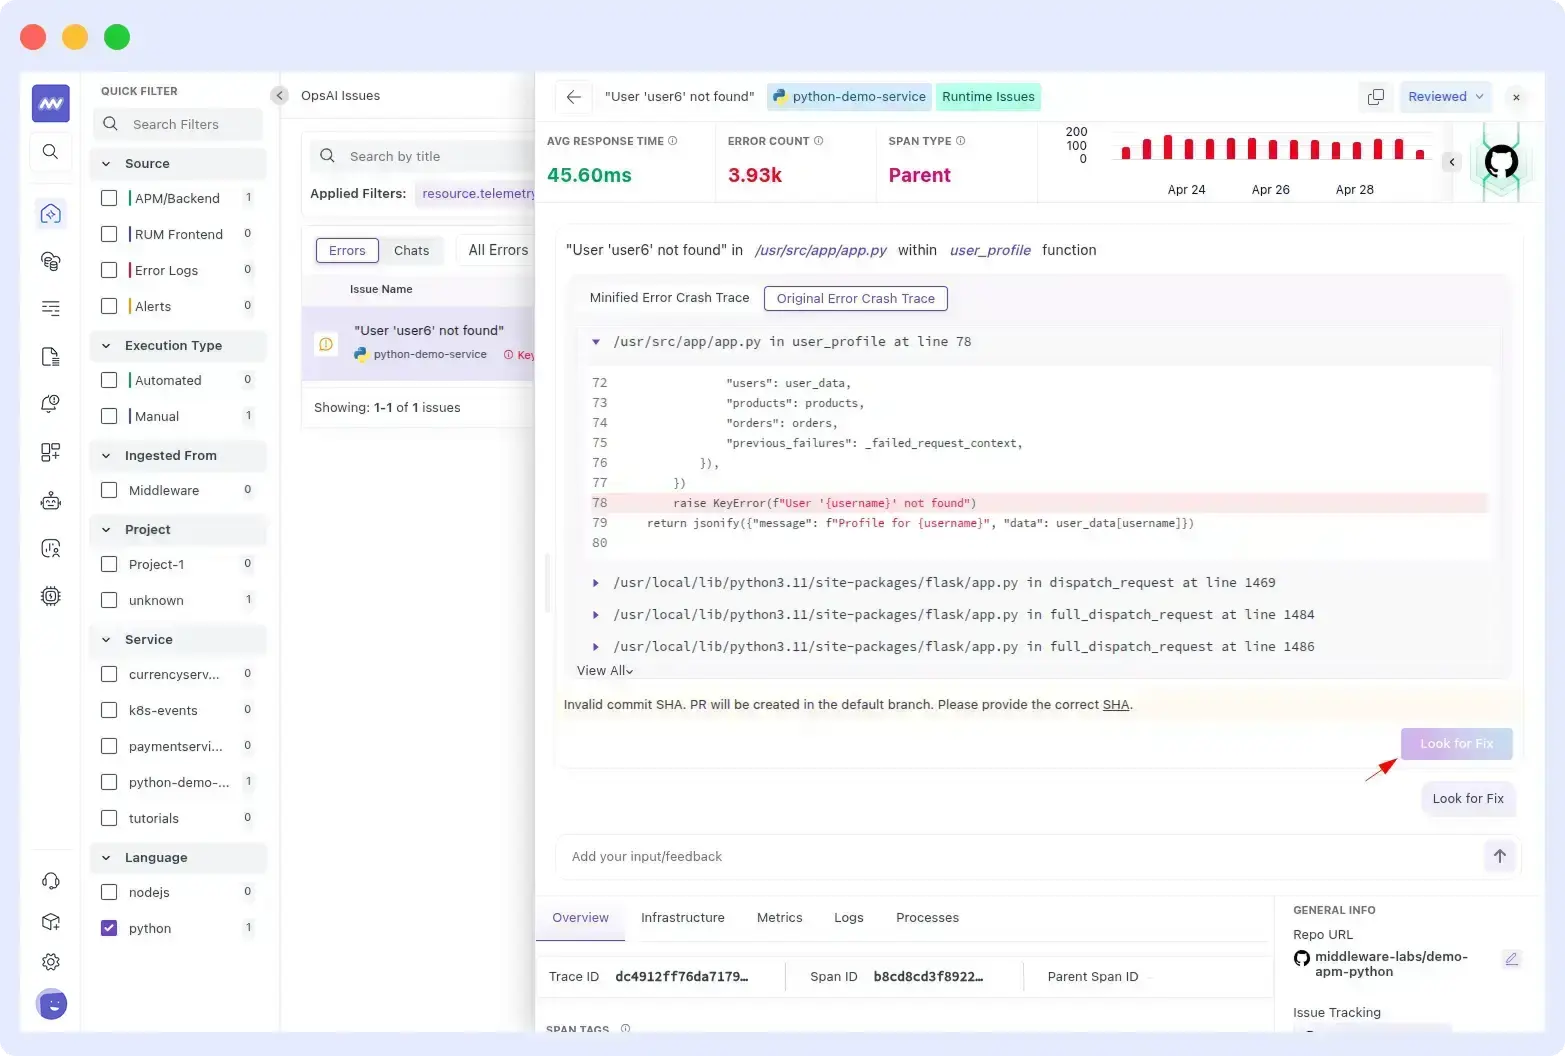
It then pinpoints the exact file and line in your codebase using stack traces, error metadata, and source code from your connected GitHub repository. From there, it generates a candidate fix, presents a side-by-side diff, and opens a pull request for review, reducing the need for immediate on-call intervention. In internal benchmarks, OpsAI has auto-resolved more than 80% of production issues and achieved a detection-to-resolution rate above 90% in customer beta accounts.
For setup, see the Middleware OpsAI documentation.
What it’s good at:
- Full-stack coverage across APM, RUM, logs, infrastructure, and Kubernetes from a single platform
- Ingests alerts from third-party tools, including Datadog and Grafana, not just Middleware’s native monitors
- Code-level root cause analysis that links directly to the file and line in your codebase
- Automated PR generation with a 95% confidence threshold, so it only acts when it is certain
- Two Kubernetes remediation modes: Auto RCA for human-reviewed fixes, and Auto Fix for direct remediation of clear-cut infrastructure issues
- Built on OpenTelemetry, so you’re not locked into a single vendor for instrumentation
- Works across multiple languages like Java, Node.js, Python, and Go, with a simple setup
Explore how Middleware OpsAI helps engineering teams reduce MTTR with AI-powered incident response: Read more about Middleware OpsAI SRE Agent
Limitations
- Needs GitHub integration to unlock its full code-level analysis and automated PR workflow
- Automatic fixes are currently limited to Kubernetes; application-level changes still go through pull request review
Best For
Engineering and SRE teams that want detection, root cause analysis, and code-level fixes within a single platform, without managing multiple tools.
Pricing
Available to all Middleware users. 14-day free trial with 2M OpsAI tokens, no credit card required. See the Middleware pricing page for full details.
Middleware resolved time spend on debugging and resolving issues by nearly 90%
Nico Laqua, CEO at Corgi
Verdict
OpsAI is one of the few tools that goes from detection to an actual code-level fix in one flow. If your goal is to reduce incident resolution time without stitching together multiple tools, it’s a solid place to start. Start a 14-day free trial, no credit card required.
2. Bits AI by Datadog
Type: Investigation agent — native to the Datadog ecosystem
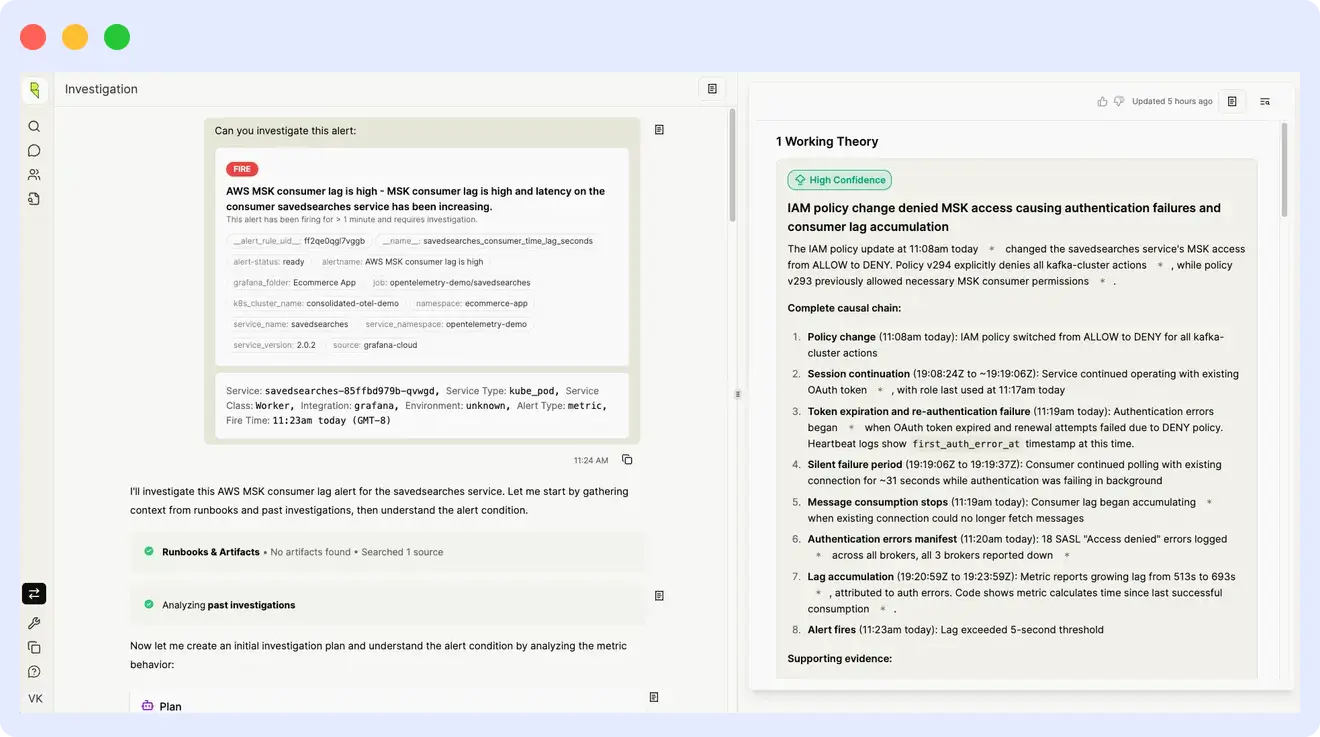
Bits AI is Datadog’s autonomous incident investigation agent built directly into the Datadog platform. When an alert fires, Bits AI rapidly analyzes runbooks, telemetry, and change tracking data to separate signal from noise, uncover probable root causes, validate its findings, and deliver conclusions to third-party collaboration tools all before on-call responders log in.
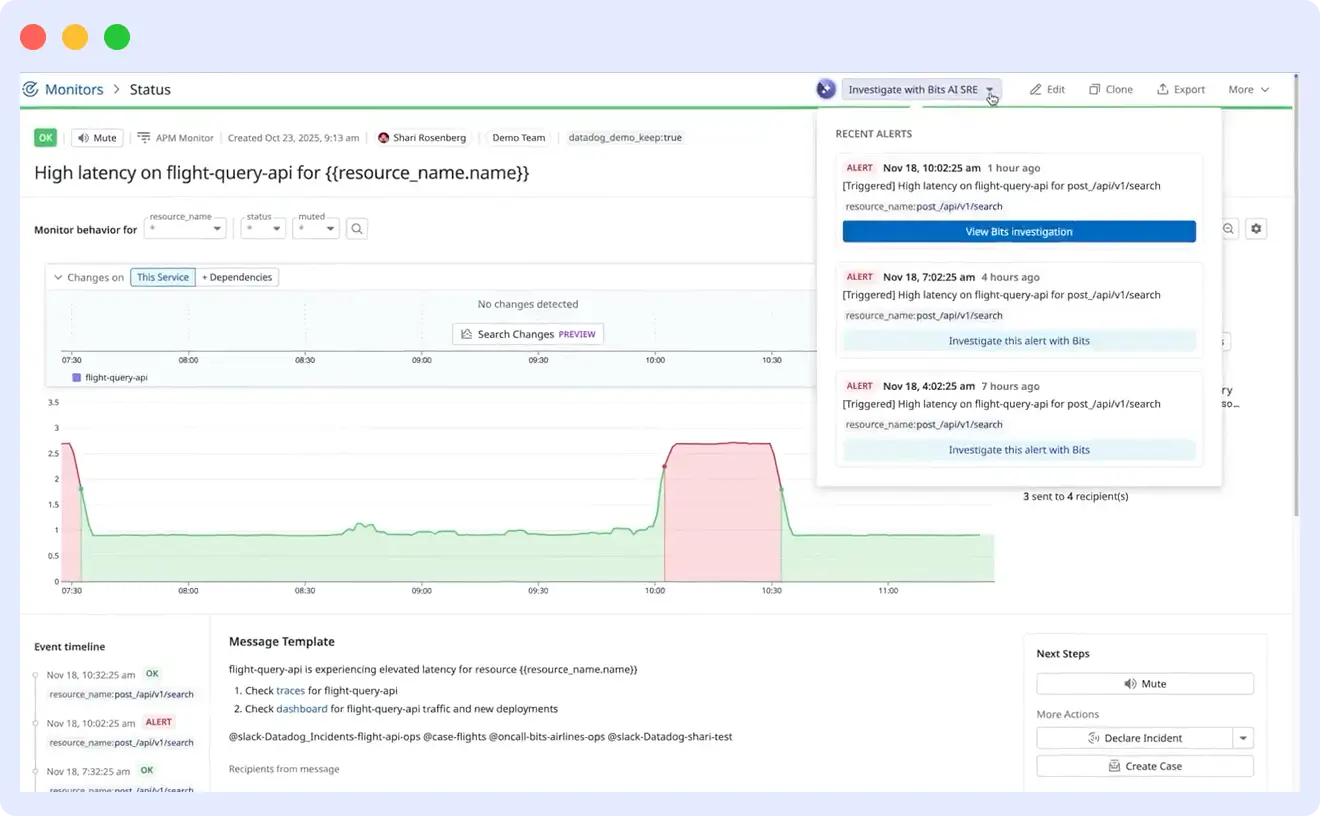
What sets Bits AI apart from many other AI SRE tools is the depth of data it operates on. Datadog processes observability data from tens of thousands of organizations across every industry, architecture, and scale. Bits AI is trained against that breadth of real-world telemetry rather than abstracted examples or synthetic failure modes.
What it’s good at:
- Automatically launches investigations the moment an alert fires, with no manual prompting required
- Operates across the full Datadog telemetry stack, including APM, logs, metrics, RUM, database monitoring, and change tracking
- Third-party integrations with tools such as GitHub, ServiceNow, Grafana, Splunk, Dynatrace, and Sentry to pull in telemetry data for root cause analysis
- Transparent reasoning via an Agent Trace view, so engineers can follow exactly how it reached its conclusions
- Remediation capabilities in active development, including code fix generation through the Bits AI Dev Agent
Limitations
- It can only investigate what is already visible to Datadog, which makes it a poor fit for teams with telemetry spread across tools outside the Datadog ecosystem
- Third-party integrations like Grafana, Splunk, and Sentry are still in preview and not yet available for production use
- Investigations are metered, so costs can escalate quickly in environments with high alert volumes
Ideal For
Teams already using Datadog who want faster incident investigation without changing their observability stack
Pricing
Prices start at $500 per 20 investigations/month
Verdict
Bits AI SRE is a strong option for teams already standardized on Datadog. The depth of native telemetry access gives it an investigative advantage that third-party overlay tools cannot easily replicate. For teams with a mixed observability stack, however, its value drops significantly since its analysis is only as complete as the data Datadog can see.
3. Davis AI by Dynatrace
Type: Causal AIOps — enterprise-grade root cause analysis
Davis AI is Dynatrace’s core AI engine, built to power its observability and AIOps capabilities. It is designed to automatically detect problems, trace their cause, and explain what is happening across complex systems without requiring manual investigation.
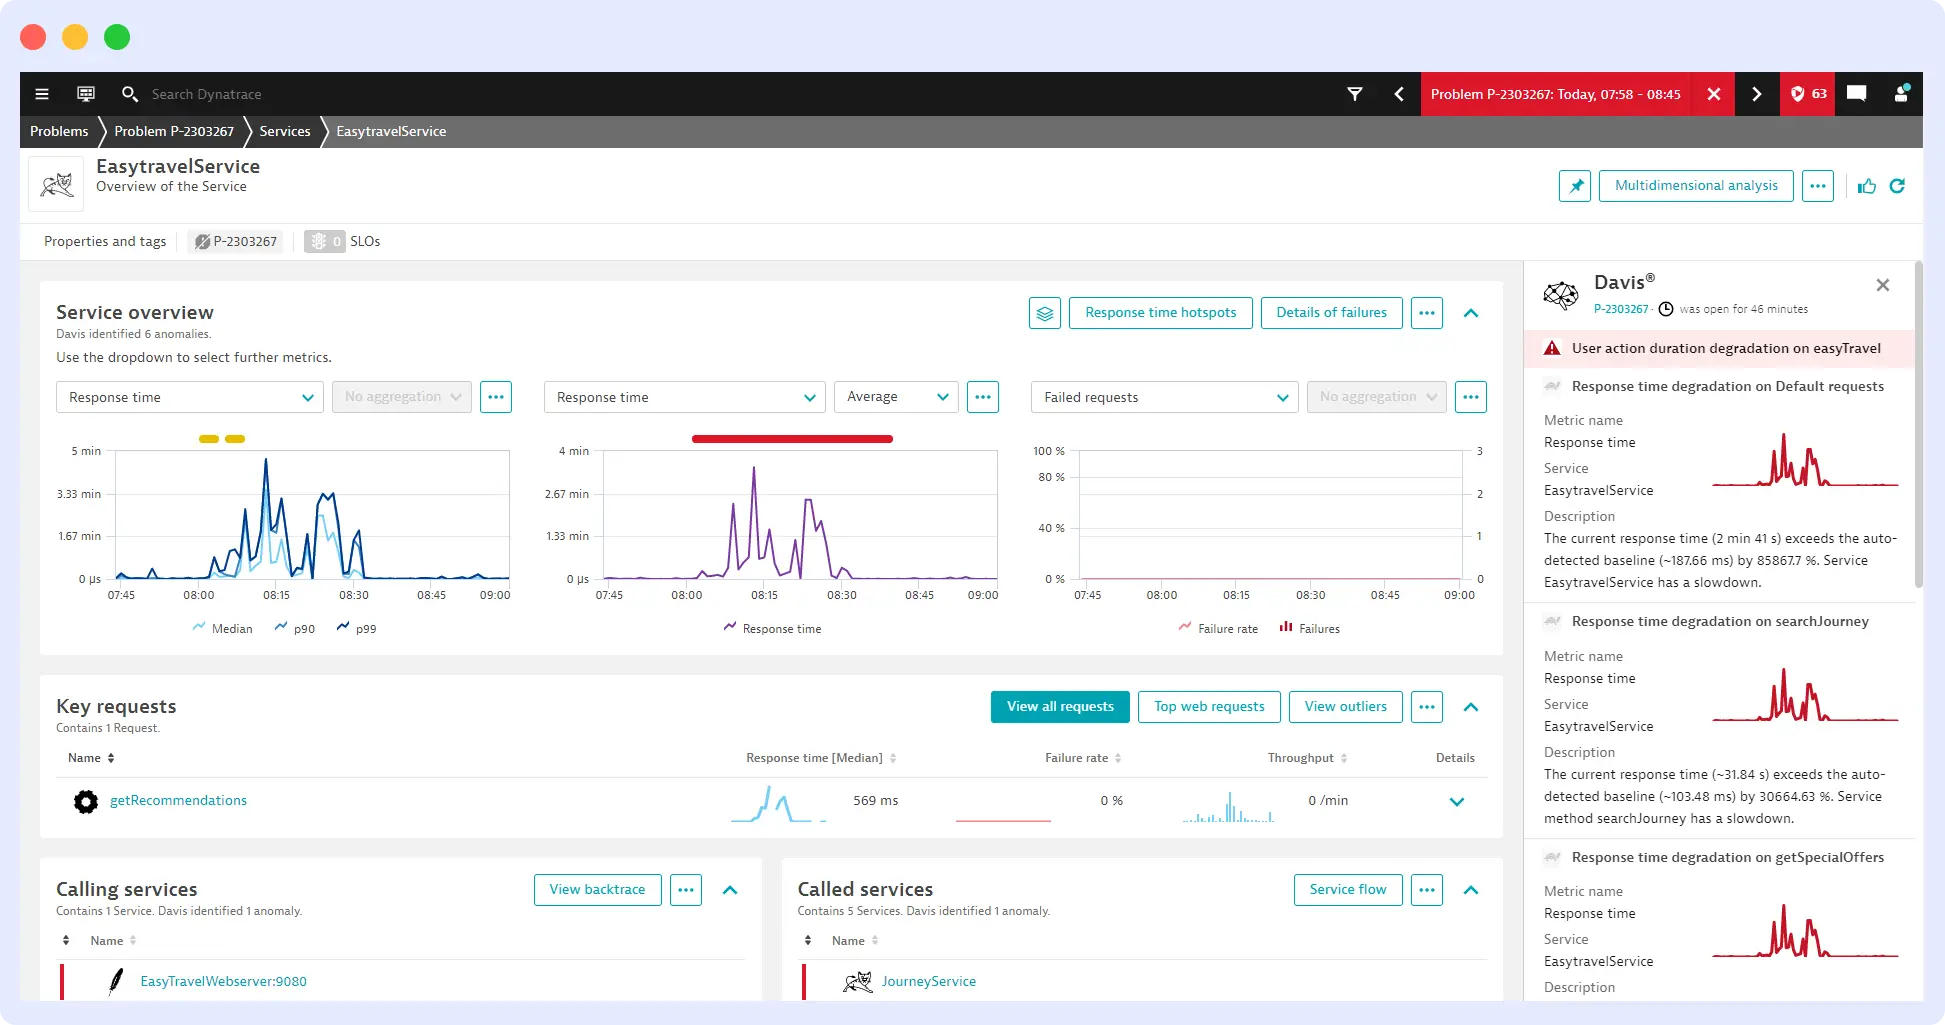
Unlike tools that rely on simple correlations, Davis AI uses causal analysis, which means it continuously maps relationships among services, infrastructure, and user experience data to understand how one change affects another. This allows it to go beyond surface-level alerts and identify the actual root cause of an issue.
What it’s good at:
- Automated root cause analysis using causal AI instead of basic correlation
- Continuous dependency mapping across applications, services, and infrastructure
- Natural language querying through Davis CoPilot for faster investigation without learning a query language
- Role-based AI agents for SRE, developers, and security teams that can work across domains
- Deep integration with the Dynatrace full-stack observability platform
Limitations
- Setup and configuration can be time-consuming, especially in large environments
- Enterprise-focused pricing makes it less accessible for smaller teams
- Works best when Dynatrace is the primary observability tool; mixed stacks reduce effectiveness
Ideal For
Large enterprises running complex hybrid or multi-cloud infrastructure that need consistent, explainable root cause analysis at scale.
Pricing
Pricing is based on the Dynatrace platform modules used. Contact Dynatrace for a quote.
Verdict
Davis AI is built for large-scale, complex environments where manual incident investigation does not scale. Its strength lies in causal reasoning, helping teams move from alert to root cause with less manual correlation.
4. Resolve AI
Type: Autonomous agent — parallel investigation + broad remediation
Resolve AI is a native AI incident response and engineering automation tool that helps teams resolve production incidents faster. It connects to your observability stack, code repositories, and incident management tools to investigate issues as they happen rather than just surface information.
During an incident, Resolve AI first ingests signals from logs, metrics, traces, and alerts, then runs multiple agents in parallel to test different failure hypotheses instead of following a single linear investigation path. It correlates this with deployment history, code changes, and past incidents to narrow down the most likely root cause. Once identified, it can suggest fixes or generate actions such as pull requests, scripts, or kubectl commands depending on the configuration.
What it’s good at:
- A multi-agent architecture that investigates multiple hypotheses at the same time rather than sequentially
- A multi-agent architecture that runs parallel investigations across system signals to identify potential root causes
- Vendor-neutral and pulls data across observability tools, cloud infrastructure, code repositories, and communication platforms
- Automated remediation that goes beyond suggestions, generating PRs, scripts, and kubectl commands
- Separate agents for incident response, cloud cost optimization, and feature development with production context
- Learns from past incidents by ingesting runbook documentation and previous incident resolutions. Over time, when a similar failure pattern is detected, Resolve AI surfaces the past resolution as a recommended action rather than starting from scratch
Limitations
- The platform is only as effective as the integrations feeding it data; gaps in observability coverage lead to weaker analysis
- As a newer tool, it has a shorter track record than more established platforms
- Limited public documentation makes it harder to evaluate capabilities before committing to a trial
Ideal For
Teams that want high automation across investigation and remediation, and are willing to invest in setup and integrations
Pricing
Not publicly listed; Contact the sales team for pricing
Verdict
Resolve AI is built for teams that want a high degree of automation and are willing to invest in the integration work needed to get there. The trade-off is that it takes time to set up properly and depends heavily on the quality of the data it can access.
Want to see how Resolve AI compares against Middleware OpsAI in real-world SRE workflows?
Read the full OpsAI vs Resolve AI benchmark comparison
5. Rootly AI SRE
Type: Incident coordination — AI-assisted workflow management
Rootly AI SRE is an AI-native incident response layer built into the Rootly incident management platform. It aims to improve how teams manage the entire incident management process from detection and response to resolution and incident review with AI embedded directly into your workflows.
As an incident management platform, Rootly already has a lot of context about incidents. That means it doesn’t have to rely heavily on the complex external integrations you often see in AI SRE tools. The AI agent can draw on knowledge of previous incidents, incident responses, and team actions to help manage incidents in real-time.
What it’s good at:
- Covers the full incident lifecycle from alert to post-mortem in one platform
- Has direct access to past incident history, so AI suggestions are based on real patterns
- Tight Slack integration, making it a natural fit for teams already managing incidents there
- Includes on-call scheduling, escalation flows, and clear incident role management
- Connects with over 100 tools across monitoring, alerting, and communication
- Human-in-the-loop design, where engineers review and approve AI suggestions before actions are taken
Limitations
- Does not collect or store logs, metrics, or traces directly; relies on external observability tools, so AI quality depends on integration depth
- Does not support autonomous remediation like pull request generation or automated fix execution
- Can feel less valuable for teams that already have a mature incident management system in place
- Rootly AI SRE does not generate pull requests, execute kubectl commands, or perform automated remediation. It is an incident coordination and workflow tool, not an autonomous fix engine. Teams requiring automated remediation need a separate tool.
Ideal For
Teams that already have structured incident workflows (especially Slack-based) and want AI layered into coordination and response
Pricing
Contact the sales team for pricing
Verdict
Rootly AI SRE is a good fit for teams looking to add AI to their existing incident management process without altering their current workflow. But it does not support in-depth analysis of observability data or autonomous remediation, as other AI SRE platforms do.
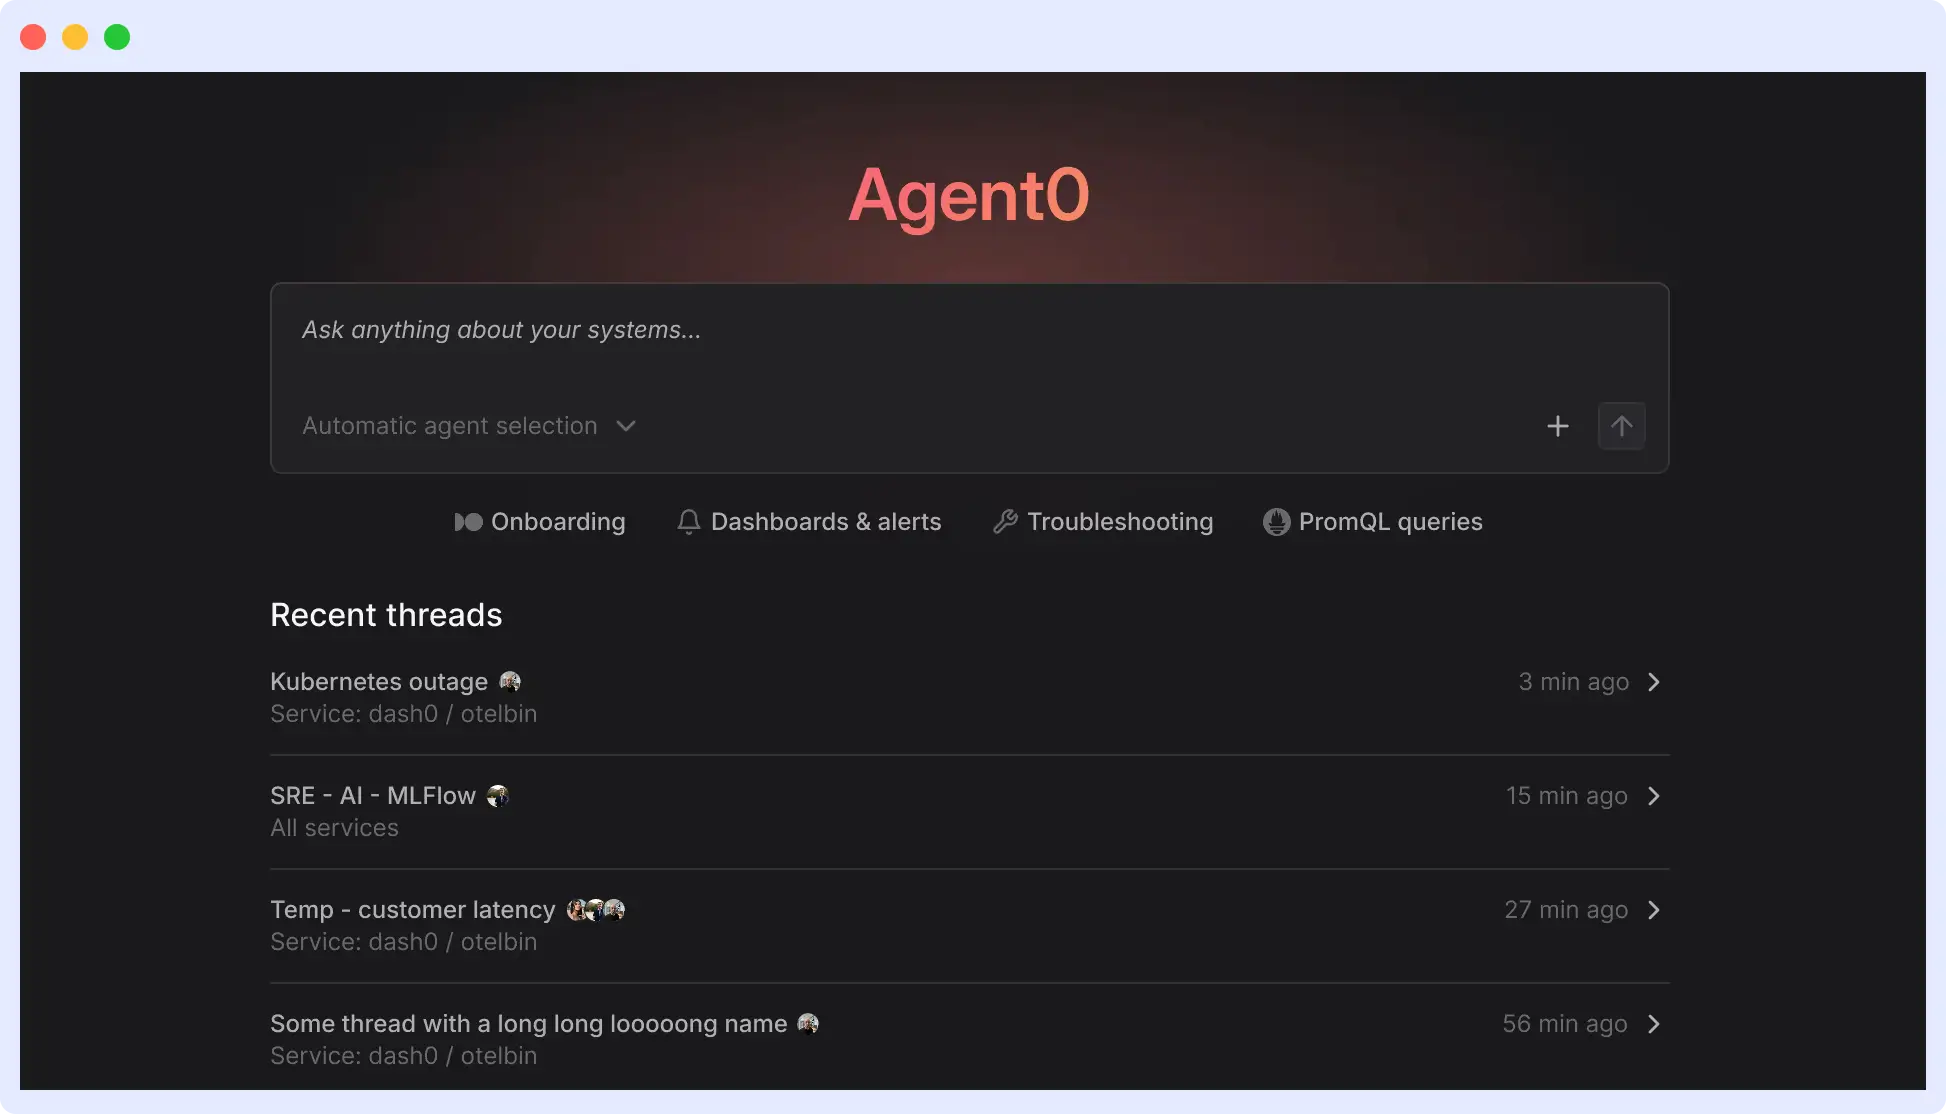
6. Agent0 by Dash0
Type: OTel-native augmentation — structured, transparent investigation
Dash0 is an OpenTelemetry-native observability platform, and Agent0 is its AI layer built as a set of specialized agents that support different parts of the observability workflow. Instead of a single assistant, it delegates work across multiple focused agents:
- Seeker — investigates incidents and correlates telemetry to identify likely root causes
- Oracle — helps generate and explain queries for logs, metrics, and traces
- Threadweaver — analyzes distributed traces to understand service dependencies and failure paths
- Pathfinder — assists with service onboarding and OpenTelemetry instrumentation
- Artist — builds dashboards and visualizations from telemetry data
Each agent operates on a specific part of the observability lifecycle, making investigations more structured and transparent.
What it’s good at:
- A multi-agent architecture where different agents handle specific observability tasks
- Built on OpenTelemetry, making it flexible across different environments
- Strong focus on trace-based root cause analysis and dependency mapping
- Natural language querying across logs, metrics, and traces
- Clear reasoning paths that show how conclusions are derived from data
- Supports both incident response and observability tasks like dashboards and instrumentation
Limitations
- Primarily an augmentation tool, not an autonomous system it will not rewrite configs in production or perform automated remediation
- Best value is within the Dash0 platform; teams not already using it may need to migrate their observability stack
- Fewer large-scale enterprise case studies compared to more established tools in this category
Ideal For
Teams that prioritize transparency, OpenTelemetry-native observability, and step-by-step reasoning over full automation
Pricing
Usage-based pricing tied to the Dash0 platform
Verdict
Dash0 Agent0 is built for teams that want structured AI support across observability workflows without moving into full automation. Its strength is in breaking down complex telemetry into understandable steps rather than directly fixing issues.
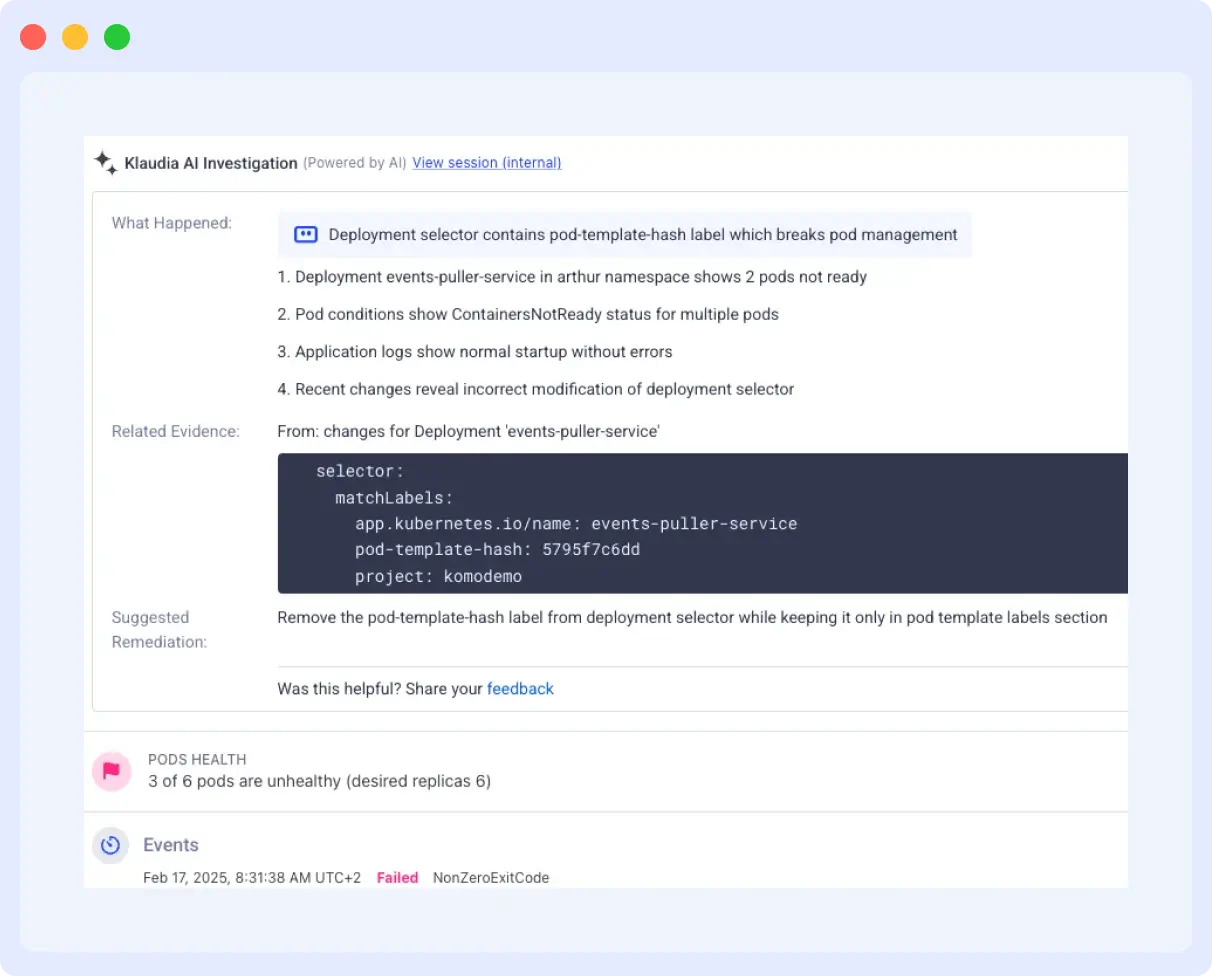
7. Klaudia AI by Komodor
Type: Kubernetes AI SRE — deep cluster-level specialization
Komodor is a Kubernetes-focused observability and troubleshooting platform, and Klaudia AI is its AI SRE layer built specifically for cloud-native environments. It is designed to help teams detect, investigate, and resolve Kubernetes issues faster by combining real-time cluster context with historical operational data.
Unlike general-purpose AI SRE tools, Klaudia works directly on Kubernetes-native signals such as cluster state, events, deployments, and configuration changes. This allows it to track exactly what changed in the cluster, such as a rollout, scaling event, or config update, and correlate that with failures. By combining this with historical incident data, it can match current issues to past patterns and surface likely root causes more precisely than tools that rely only on metrics, logs, and traces.
What it’s good at:
- Deep Kubernetes specialization, with strong accuracy across real-world incident scenarios
- Multi-agent architecture covering Kubernetes, GPU workloads, networking, storage, and cloud services
- An extensible framework that allows teams to bring their own agents, tools, and workflows into investigations
- Self-learning memory that improves over time based on environment-specific patterns and past incidents
- Supports both autonomous remediation and human-in-the-loop workflows, depending on team preference
Limitations
- Strongly Kubernetes-specific; not designed as a general observability AI layer
- Klaudia AI is designed exclusively for Kubernetes environments. Teams with significant non-containerized infrastructure or application-level incidents outside the cluster layer should evaluate a broader platform alongside Komodor.
- Focuses more on investigation and remediation guidance than full autonomous execution
Ideal For
Teams running Kubernetes at scale that need deep cluster-level visibility and faster root cause analysis
Pricing
Enterprise pricing; not publicly listed
Verdict
Komodor Klaudia AI is best suited for teams running Kubernetes at scale. Its deep specialization gives it an edge in cloud-native environments, but that focus also means it covers less outside Kubernetes compared to broader platforms.
8. Sherlocks.ai
Type: Knowledge graph agent — institutional memory for recurring incidents
Sherlocks.ai focuses on capturing and reusing incident knowledge across your organization. It builds a knowledge graph by ingesting three types of data: live telemetry, such as metrics, logs, and traces; structured incident records, such as postmortems and resolution notes; and team conversations from Slack or incident channels.
When a new incident occurs, it searches this graph for similar past events based on symptoms, affected services, and error patterns, then surfaces relevant fixes and context alongside the current investigation.
It also runs multiple domain-specific agents in parallel, each focused on areas like Kubernetes or databases, enabling more targeted investigation while keeping data within your environment.
What it’s good at:
- Builds an institutional knowledge graph from past incidents, postmortems, and team conversations
- Domain-specific agents for more focused investigation across different parts of the stack
- Keeps telemetry within your VPC, avoiding external data transfer
- Native Slack and Microsoft Teams integration for in-workflow investigation
Limitations
- Sherlocks.ai’s knowledge graph requires historical incident data to deliver meaningful results; teams with limited incident history may see slower initial value.
- Depends on the quality of past incident documentation and team workflows
- Less focused on automated remediation compared to tools that generate or execute fixes
Ideal For
Teams where incident knowledge is fragmented or concentrated among a few engineers, and recurring issues require historical context to resolve efficiently
Pricing
Free trial available. You have to contact the sales team for custom pricing.
Verdict
Sherlocks.ai stands out by focusing on institutional knowledge rather than just telemetry. For teams that repeatedly solve the same problems, it helps surface past fixes and context that would otherwise be lost.
9. Lightrun AI SRE
Type: Runtime debugger — live instrumentation during incidents
Lightrun AI SRE is an incident response tool built around on-demand runtime instrumentation. Unlike most AI SRE tools that rely on existing telemetry such as logs, metrics, and traces, Lightrun injects instrumentation directly into running applications during an incident. This allows engineers to capture missing runtime data without redeploying services, closing visibility gaps that static observability tools cannot resolve.
What it’s good at:
- On-demand runtime instrumentation without redeployment
- Live data collection from running applications during incidents
- Evidence-based root cause analysis using real execution data
- Pre-deployment validation of fixes in live environments
- Automated postmortem generation with incident timeline and resolution context
Limitations
- Requires a Lightrun agent installed in each service you want to instrument, which adds setup overhead in large environments
- Less useful for infrastructure-level incidents where the failure is outside application code
- Newer product with a smaller track record compared to more established tools in this list
Ideal For
Teams that need deep runtime visibility and verification of issues at the code execution level, rather than relying only on existing observability data
Pricing
Not publicly listed
Verdict
Lightrun is not a full AI SRE platform. It is strongest as a debugging and verification layer that fills runtime visibility gaps other tools do not cover.
10. Harness AI SRE
Type: CI/CD intelligence — deployment risk detection and release safety
Harness AI SRE is an intelligence layer within the Harness platform that helps engineering teams detect, prevent, and resolve issues across the software delivery lifecycle. Instead of focusing only on incident response, it analyzes deployment pipelines, service behavior, and runtime metrics to identify problems early, often before they become full incidents.
It works by continuously evaluating deployments and production signals to detect anomalies, regressions, and performance degradation. When issues are found, it can flag risky releases, suggest rollback actions, or provide insights into what changed during deployment that likely caused the problem.
What it’s good at:
- AI-driven deployment verification and anomaly detection
- Integration with CI/CD pipelines for real-time feedback
- Correlation of deployment changes with production incidents
- Built-in on-call scheduling, escalation policies, and alert routing
- Native integrations with Datadog, Dynatrace, PagerDuty, Jira, ServiceNow, and GitHub
Limitations
- Less focused on deep code-level investigation compared to tools with runtime instrumentation
- AI SRE is a newer addition to the Harness platform and may lack the depth of standalone incident response tools
Ideal For
Teams already using the Harness platform for CI/CD or feature flags, where connecting deployment changes to incidents is the primary bottleneck in incident investigation.
Pricing
Contact sales for pricing.
Verdict
Harness is best positioned as a release intelligence and CI/CD safety tool. It is less effective as a deep incident investigation or AI SRE system compared to more observability-native platforms.
Which AI SRE Tool Is Right for You
Most AI SRE tools overlap across multiple use cases. The difference is in how far they go and where they are strongest.
| Your Primary Need | Best Tool Fit | Why |
| Detection + investigation + code-level fixes in one platform | OpsAI by Middleware | Tool that closes the full loop from alert to PR |
| Deep investigation within Datadog ecosystem | Bits AI by Datadog | Native telemetry access; no integration overhead |
| Enterprise-scale causal root cause analysis | Davis AI by Dynatrace | Strongest causal reasoning; built for complex hybrid infrastructure |
| Kubernetes-specific cluster RCA | Klaudia AI by Komodor | Deepest Kubernetes context; cluster history tracking |
| Incident workflow coordination with AI overlay | Rootly AI SRE | Best fit for Slack-based incident management teams |
| High autonomy parallel investigation | Resolve AI | Multi-agent hypothesis testing; widest remediation scope |
| OpenTelemetry-native transparency | Agent0 by Dash0 | Best reasoning visibility; portable across environments |
| Institutional knowledge and recurring incident patterns | Sherlock.ai | Knowledge graph approach; best for teams with recurring incidents |
| Runtime-level debugging in production (no redeploy) | Lightrun AI SRE | Captures live runtime data during incidents |
| Deployment safety and CI/CD risk detection | Harness AI SRE | Detects and prevents issues during releases |
How to Choose the Right AI SRE Tool
Before you start comparing tools, consider where your team spends the most time during incidents – triage, investigation or remediation. Each tool tends to focus on one of these processes, so make sure you get the tool that targets your bottleneck.
Then, filter by these criteria:
- Data access: tools that can read your observability data will be more useful than having to integrate data from different data sources
- Remediation support: Some tools only include analysis, others add suggestions, and very few go as far as execution; you will need to decide how far down the path you want to go
- Transparency: if a tool cannot explain how it reached a conclusion, it will be harder to trust during high-pressure incidents
- Learning over time: tools that learn from past incidents and your system behavior become more useful the longer you use them
- Vendor lock-in: check whether the tool keeps your data and workflows portable or ties you into its own ecosystem
- Total cost: look beyond pricing and consider setup time, integration effort, and ongoing maintenance
Get Started with Middleware OpsAI
If you are looking for a starting point, Middleware OpsAI covers the full loop from detection to code-level fix within a single platform, without requiring a separate observability stack or complex setup. It is built for engineering teams that want to move faster on incidents without adding more operational overhead.
It is available to all Middleware users and can be set up in minutes to start analyzing your environment.
FAQs
What is an AI SRE agent?
An AI SRE agent is a system that uses large language models and machine learning to assist with incident response. It can detect issues, investigate root causes, and in some cases suggest or execute fixes without requiring manual effort at every step.
Can AI SRE tools fix issues automatically?
Some tools suggest fixes, and a few can execute them. Most teams start with recommendations and gradually introduce automation with approval workflows.
Are AI SRE tools production-ready?
For triage, noise reduction, and root cause analysis, yes. For autonomous remediation, it depends on the tool and the environment. Most teams still use human approval for execution, especially in critical systems.
Do AI SRE tools replace SRE engineers?
No. They reduce repetitive investigative work, allowing engineers to focus on higher-impact tasks like system design, reliability strategy, and capacity planning.
What observability data do AI SRE tools need?
Most tools work best with metrics, logs, traces, and deployment data. The more context they have, the more accurate their analysis becomes.
How do AI SRE tools differ from traditional AIOps platforms?
Traditional AIOps platforms correlate and display alert data. AI SRE agents act on it — generating or executing fixes rather than just surfacing information for a human to interpret.