
Debug logging enables developers to track what their code is doing while it executes. It involves adding logs (messages) that demonstrate what occurs within the program. These messages help you monitor the app’s operation, verify variable values, and identify potential app trouble spots.
🛠️Want to learn how to quickly identify and fix app performance issues? Check out our guide on Fixing Application Performance Issues for practical tips and tools.
Logging is not just about debugging. We also have different log levels that group messages by their importance. For example:
- Error logs show serious issues that need fixing
- Warning logs point out things that might cause big problems.
- Info logs record normal events like when a service starts or a user successfully logs in.
Identifying issues in your code can be challenging without proper logging. However, through proper logging, developers can keep things running smoothly, identify bugs more quickly, and gain a deeper understanding of how their apps behave.
Why Debug Logging Matters
Here are some of the main reasons and aims of debug logs that every developer should know about:
- Debug logs make it easy to find bugs by keeping track of what happens. This will help you identify and correct errors in your code.
- By displaying every action the program takes while running, debug logs allow you to see how an application flows.
- Debug logs will provide you with specific information that will help you identify the issue when it occurs.
- Developers can identify issues more quickly and more effectively by using the detailed information provided by debug logs.
Implementing Debug Logging
Different methods exist for debug logging. The approach you take depends on the project size and control needs.
Prerequisite:
A basic knowledge will help you understand the code. Also, install Node.js and npm on your computer.
Node.js App:
const express = require('express');
const app = express();
const PORT = 3000;

// user database.
const users = {
  1: { id: 1, name: 'Jane Doe', email: 'jane@example.com' },
  2: { id: 2, name: 'John Smith', email: 'john@example.com' },
};

app.get('/user/:id', (req, res) => {
  const userId = req.params.id;
  const user = users[userId];

  if (!user) {
    return res.status(404).json({ error: 'User not found' });
  }

  res.json(user);
});

app.listen(PORT, () => {
  console.log(`Server running at http://localhost:${PORT}`);
});
High-traffic Node.js applications can experience error spikes that affect users.
⚡ Reduce errors and boost performance in your Node.js apps! Learn how to monitor, detect, and resolve issues in high-traffic applications before they affect your users.
1. Using console.debug()
You don’t have to set up console.debug() for it to work. It does the same thing as console.log(). It works well for minor projects and learning.
Example:
app.get('/user/:id', (req, res) => {
  const userId = req.params.id;

  console.debug(`Request received for user ID: ${userId}`);

  const user = users[userId];

  if (!user) {
    console.error(`User with ID ${userId} not found`);
    return res.status(404).json({ error: 'User not found' });
  }

  console.debug(`User found:`, user);
  res.json(user);
});
Run the app:
Go to /user/1 route using Postman or your browser. The debug messages will appear on your terminal.
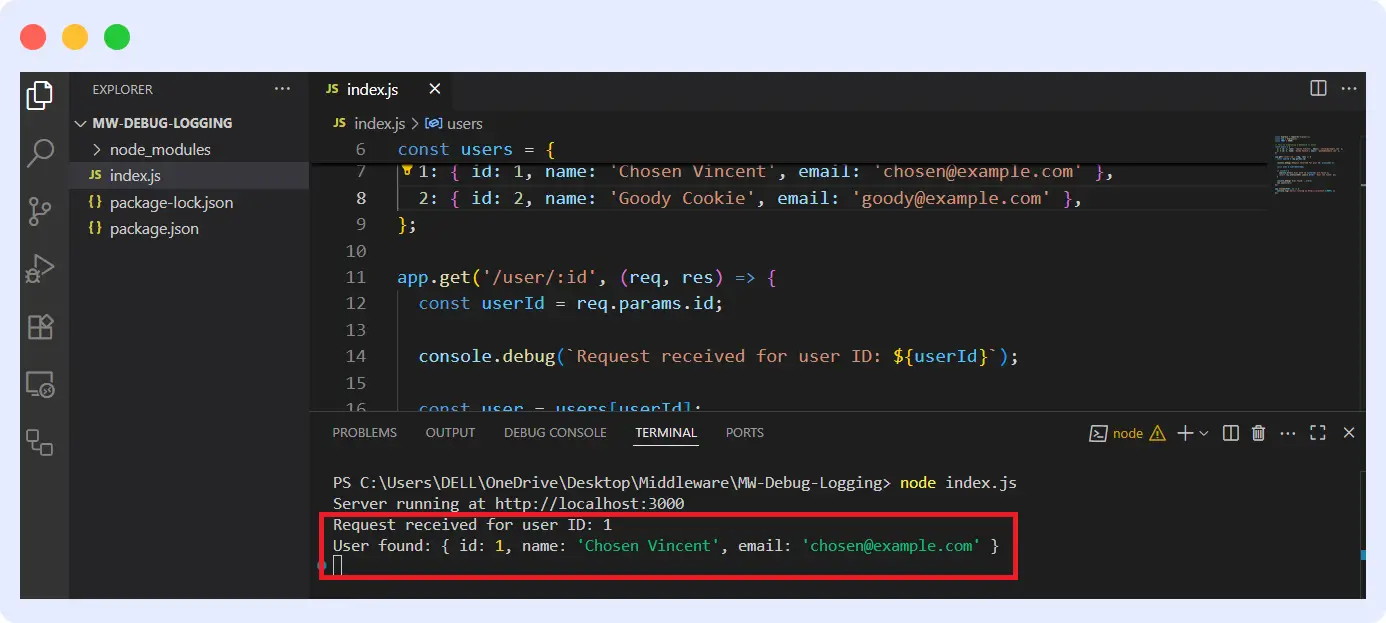
When to use console.debug():
- For quick tests or very small scripts.
- When you don’t need log filtering, log formatting, or saving logs to files.
- In small or personal projects.
2. Using Winston
Winston is a popular logging tool. It gives you more control with log levels, formatting, and transports (like files or external services), and more
1. First, install Winston:
2. Set up Winston:
const winston = require('winston');

const logger = winston.createLogger({
  level: 'debug',
  format: winston.format.simple(),
  transports: [
    new winston.transports.File({ filename: 'app.log' })
  ]
});
Let’s understand this:
- “
const logger = winston.createLogger({...})” create a new logger instance. - “
level: ‘debug’” will capture logs from debug level. - “
format: winston.format.simple()” makes logs readable in plain text. - “
transports” sends logs toapp.loginstead of the console.
3. Include Winston logs in your application:
app.get('/user/:id', (req, res) => {
  const userId = req.params.id;

  logger.debug(`Request received for user ID: ${userId}`);

  const user = users[userId];

  if (!user) {
    console.error(`User with ID ${userId} not found`);
    return res.status(404).json({ error: 'User not found' });
  }

  logger.debug(`User found:`, user);
  res.json(user);
});
Output:
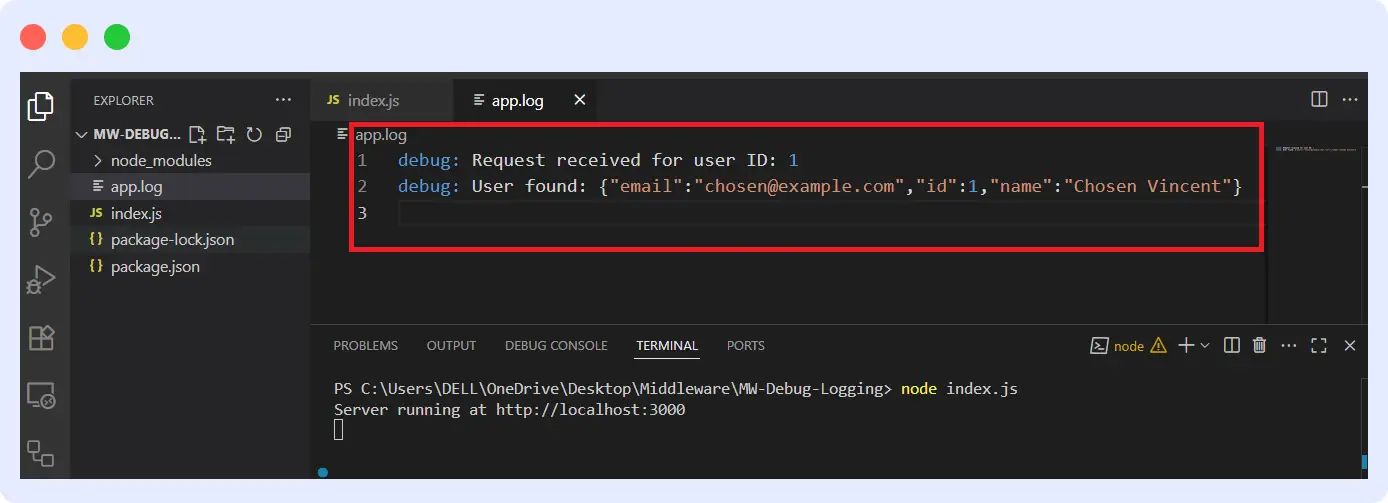
All log messages are written to app.log.
When to use:
- In a production environment.
- When you need structured logging and log files
- When your team needs consistent and readable logs across the app.
3. Using Middleware to Monitor and Analyze Logs
Winston allows changing the log format and level, and sending logs to the console or local storage. However, finding and combining logs from different environments with other system events is still necessary, especially in production.
That’s where Middleware comes in. It takes the logs and organizes them into a format that can be searched and used by multiple people.
With Middleware, you can:
- Collect logs from multiple sources
- Monitor live activities through dashboards
- Filter and search logs.
Set Up and Configuration in Node.js
To track and analyze logs using Middleware in Node.js application, follow these steps:
1. Install the Middleware APM SDK
Install Middleware Node.js SDK via npm:
2. Initialize Middleware in Your Application
At the top of your entry file (e.g., index.js), initialize the Middleware tracker with your service name and API key. This connects your application to the Middleware platform.
const tracker = require('@middleware.io/node-apm');

tracker.track({
    serviceName: "",
    accessToken: "",
    target: "https://ccang.middleware.io",
});
Replace <SERVICE_NAME> with your desired name and <API_KEY> with your Middleware API key.
3. Logging Using Middleware
Middleware’s logging capabilities enable a direct transfer of logs to the platform, with varying levels of severity.
Example:
app.get('/user/:id', (req, res) => {
  const userId = req.params.id;

  tracker.debug(`Request received for user ID: ${userId}`);

  const user = users[userId];

  if (!user) {
    console.error(`User with ID ${userId} not found`);
    return res.status(404).json({ error: 'User not found' });
  }

    tracker.debug(`User found:`, user);
  res.json(user);
});
Finally, start your server as usual:
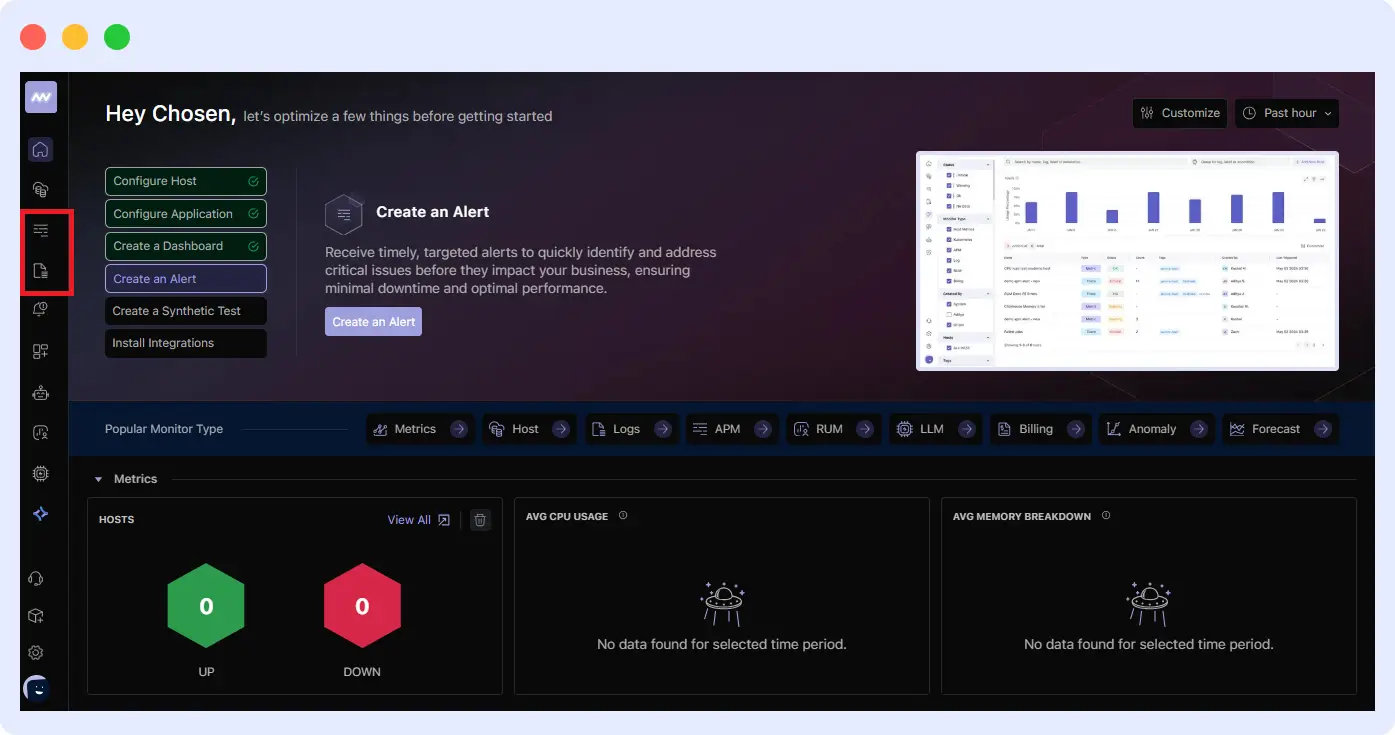
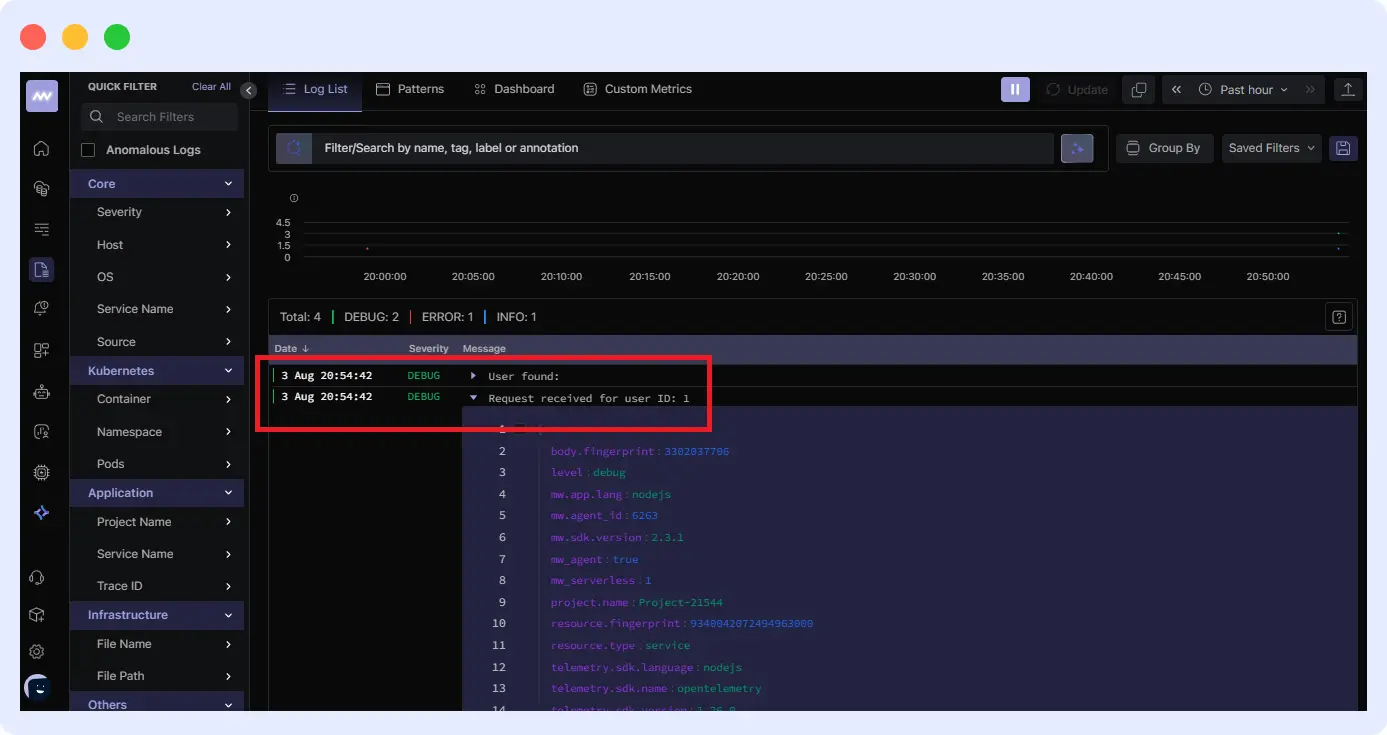
Viewing and Analyzing Logs on Middleware
After sending requests to your application, go to the Middleware Dashboard:
1. Navigate to the Logs or APM section.
2. Use filters to view logs by:
- Severity (debug, error, etc.)
- Time range
- Service or route
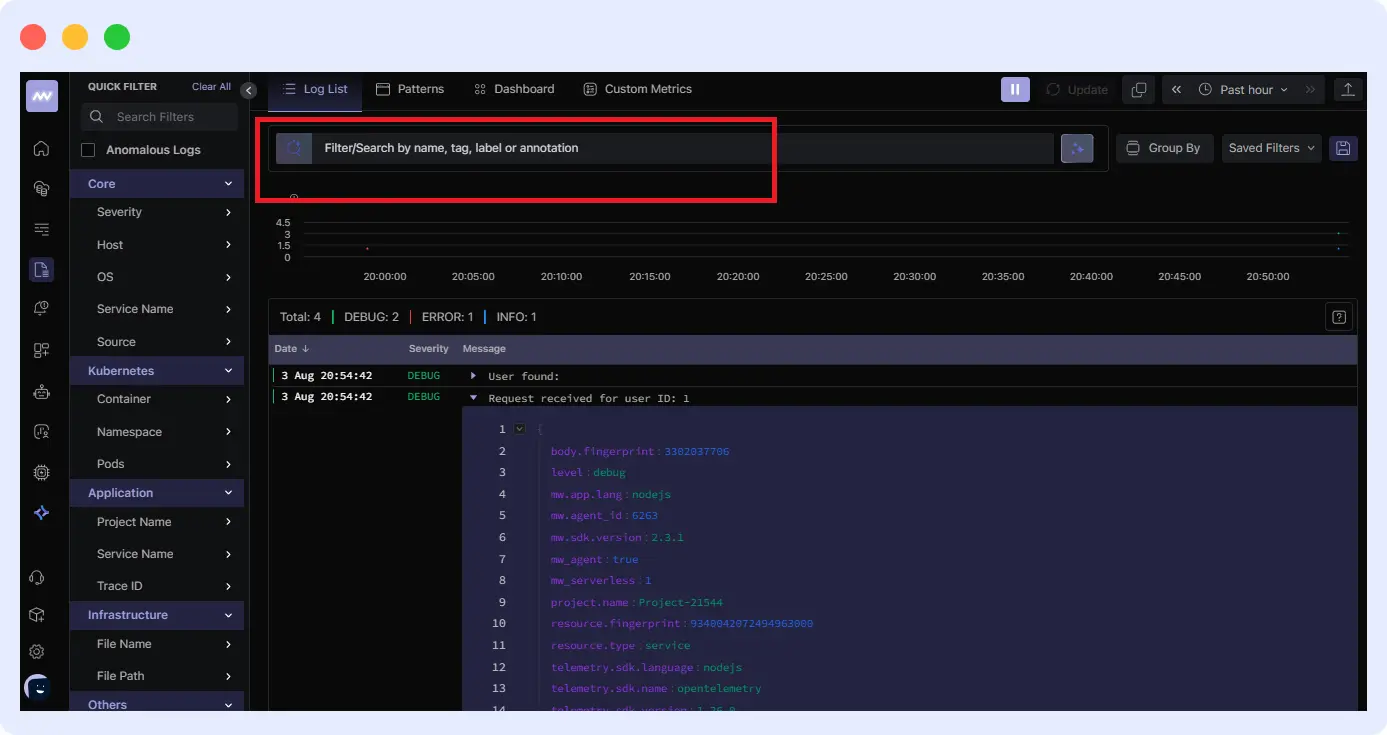
3. Click any log entry to inspect its metadata and JSON payload.
You can still set up alerts for error spikes or performance issues.
Use Case: Finding and fixing performance problems with APIs
What if the /user/:id The endpoint in your staging environment suddenly started to slow down? You can use Middleware to filter debug logs for that route.
When you look at the logs, you see that the app only slows down when you request another service. Maybe taking longer than 2 seconds to respond.
You can set up an alert in Middleware to make sure that delays like these don’t go unnoticed again.

For instance:
“Let me know if response times for /user/:id go over 2 seconds more than 5 times in a minute.”
You’ll find the issues next time before they worsen or are exploited.
Common Mistakes to Avoid
There are some mistakes you’ll make that can reduce its entire purpose or even cause problems. Avoiding these mistakes will make you create more effective logs.
1. Over-logging Every Single Line
Your logs may become overflowing with information if you log every single operation. This makes it challenging to figure out the actual issue. Performance may also be impacted by excessive resource usage.
For instance:
app.get('/user/:id', (req, res) => {
  console.debug('Entered /user/:id route');

  const userId = req.params.id;
  console.debug(`Extracted userId: ${userId}`);

  console.debug('Attempting to access users object');
  const user = users[userId];
  console.debug(`User lookup complete: ${JSON.stringify(user)}`);

  if (!user) {
    console.error(`User with ID ${userId} not found`);
    return res.status(404).json({ error: 'User not found' });
  }

  console.debug('Preparing response...');
  res.json(user);
  console.debug('Response sent');
});
Record just the crucial actions, significant variable values, or unforeseen circumstances. Pay attention to the important details that enable you to understand the program’s flow.
2. Logging After the Error Has Already Happened
Many people only write logs after an error, so they miss the important steps that were taken before the error occurred. This way, you can’t determine what went wrong.
app.get('/user/:id', (req, res) => {
  const userId = req.params.id;
  const user = users[userId];

  if (!user) {
    console.debug('User not found');
    return res.status(404).json({ error: 'User not found' });
  }

  res.json(user);
});
This tells you nothing about which user ID was requested or whether the code ran properly. Instead, you can insert logs before and during risky operations to capture the state and inputs that cause issues.
3. Using Debug Logs in Production Without Any Filters
You shouldn’t keep debug logs on in production without any filters. It can cause performance issues, generate a large number of logs, and sometimes display confidential information.
Debug logging should only be enabled for a short period or for specific parts as needed, and the appropriate log levels should be configured for production.
4. Unclear Messages
It is challenging to determine the issue when logs are not appropriately formatted or contain insufficient information, such as user IDs and request IDs.
Use well-organized logging with clear messages and information about the issue.
logger.debug("User authentication failed", extra={"user_id": user.id, "reason": "invalid password"})
Best Practices for Efficient Debug Logging
Your logs will be simple to read and maintain if you adhere to recommended practices. It enables you to fix problems faster without compromising system performance or security.
1. Be Descriptive
Your debug message should clearly tell what your code is doing. Include critical information, such as the name of the currently running function and the values of relevant variables.
Example:
This message clearly explains what the program is doing and for whom, facilitating the identification of issues related to specific data.
2. Keep your Messages Short and Simple
Your log messages should be descriptive, yet concise and straightforward. When logs get huge, it can be challenging to read the messages. Aim for concise language that conveys the primary concept without adding unnecessary information.
Example:
// Good: clear and concise
logger.debug(`User login succeeded: ${user.username}`);

// Avoid: verbose messages
logger.debug(`User login attempt was successful for username: ${user.username} at time ${new Date().toISOString()}`);
Use other parts of the logging system (such as timestamps) rather than including everything in the message.
3. Use Consistent Formatting
You must be consistent so that your logs are easy to read and parse. It is best to utilize a consistent message style and include similar types of information in a specific order, such as operation names, IDs, or error codes.
Structured logging (like logging in JSON) can help search and analyze logs programmatically.
Example of consistent formatting:
4. Avoid Logging Sensitive Data
Always consider security when building. Passwords, credit card numbers, authentication tokens, and other private user information should never be logged. Logs should be deleted to prevent privacy issues, as they may be retained for an extended period and accessed by multiple teams.
5. Don’t Overload Logs
We discussed this earlier while talking about the mistakes you shouldn’t make. Too many logs can overwhelm both developers and system resources. Don’t log everything. Focus on meaningful events and avoid logging inside very tight loops.
Conclusion
In conclusion, debug logging is important when it comes to building reliable applications. It helps you trace issues, understand app behavior, and make troubleshooting faster, especially in complex projects.
You should start using debug logs during development if you haven’t already. Middleware also adds value by centralizing and analyzing your logs on a large scale.
FAQ
What is debug logging?
Debug logging captures messages regarding what your app is doing. It allows you to understand the code better and identify mistakes. It is very beneficial during development and testing.
How is Debug Logging Different From Error or Info Logging?
Debug logs record general events that show regular operation.
Info logs record general events that show normal operation.
Error logs highlight serious problems that need fixing.
What Should I Avoid Logging at the Debug Level?
Avoid logging sensitive data or information that is not too important. Only log details that help with troubleshooting.
Does Debug Logging Affect Application Performance?
Yes! It can, especially when you log too much. Debug logs are typically blocked or filtered by log level in production.
How Can I Use Debug Logs to Troubleshoot Issues?
Check the debug logs to follow what your app was doing before a problem happened. The detailed messages help you trace steps and find out exactly where or why something went wrong.
📚 Also Read:
- ⚡ Latency Reduction: Strategies and best practices for reducing latency and optimizing performance in your applications.
- 🐍 Python Logging: Learn how to implement effective logging in Python applications.
- ☸️ Kubernetes Logging: Discover best practices for logging and monitoring Kubernetes clusters.
- 🛡️ Audit Logs: Understand the role of audit logs in tracking system events, ensuring compliance, and maintaining operational integrity.
- 🔍 Search Logs Effectively with Log Management: Learn strategies for efficiently searching and filtering logs using log management tools.
- 📘 Application Logs: Explore the importance of application logs in monitoring user interactions and understanding system behavior.


