Docker monitoring tools track the performance, health, and resource usage of Docker containers, images, and hosts in real time. Teams use them to detect issues before containers crash, optimize resource consumption, and maintain reliable containerized applications.
These tools range from single-purpose log viewers to full-stack observability platforms. What makes them different is the signals they collect (metrics, logs, traces, events), how they handle container lifespan, and what they cost at scale. This article compares 13 production tools, evaluating their strengths, limitations, pricing, and fit across standalone Docker hosts, Compose stacks, Swarm, and Kubernetes.
TL;DR
- Docker monitoring tools track container health, performance and resource usage in real time, but they vary widely in what signals they collect, how they handle container lifespan and what they cost at scale.
- This blog compares 13 Docker monitoring tools across standalone Docker hosts, Compose stacks, Swarm and Kubernetes environments, covering metrics, logs, traces and events.
- Tools range from single-purpose log viewers to full-stack observability platforms. Choosing the wrong one for your stack means either missing critical signals or overpaying for features you don’t need.
- Middleware tops the list as the best fit for teams running Docker on Kubernetes, offering unified observability across metrics, logs, traces and APM with native OpenTelemetry support.
- Other tools covered include Datadog, Grafana, Prometheus, cAdvisor, Portainer, Sematext and more, each evaluated on strengths, limitations and pricing.
- The right Docker monitoring tool depends on your stack size, budget and the signals you need. This guide maps each tool to the teams it actually fits.
If you’re new to containers, start with our guide to the Docker ecosystem before diving in.
1. Middleware
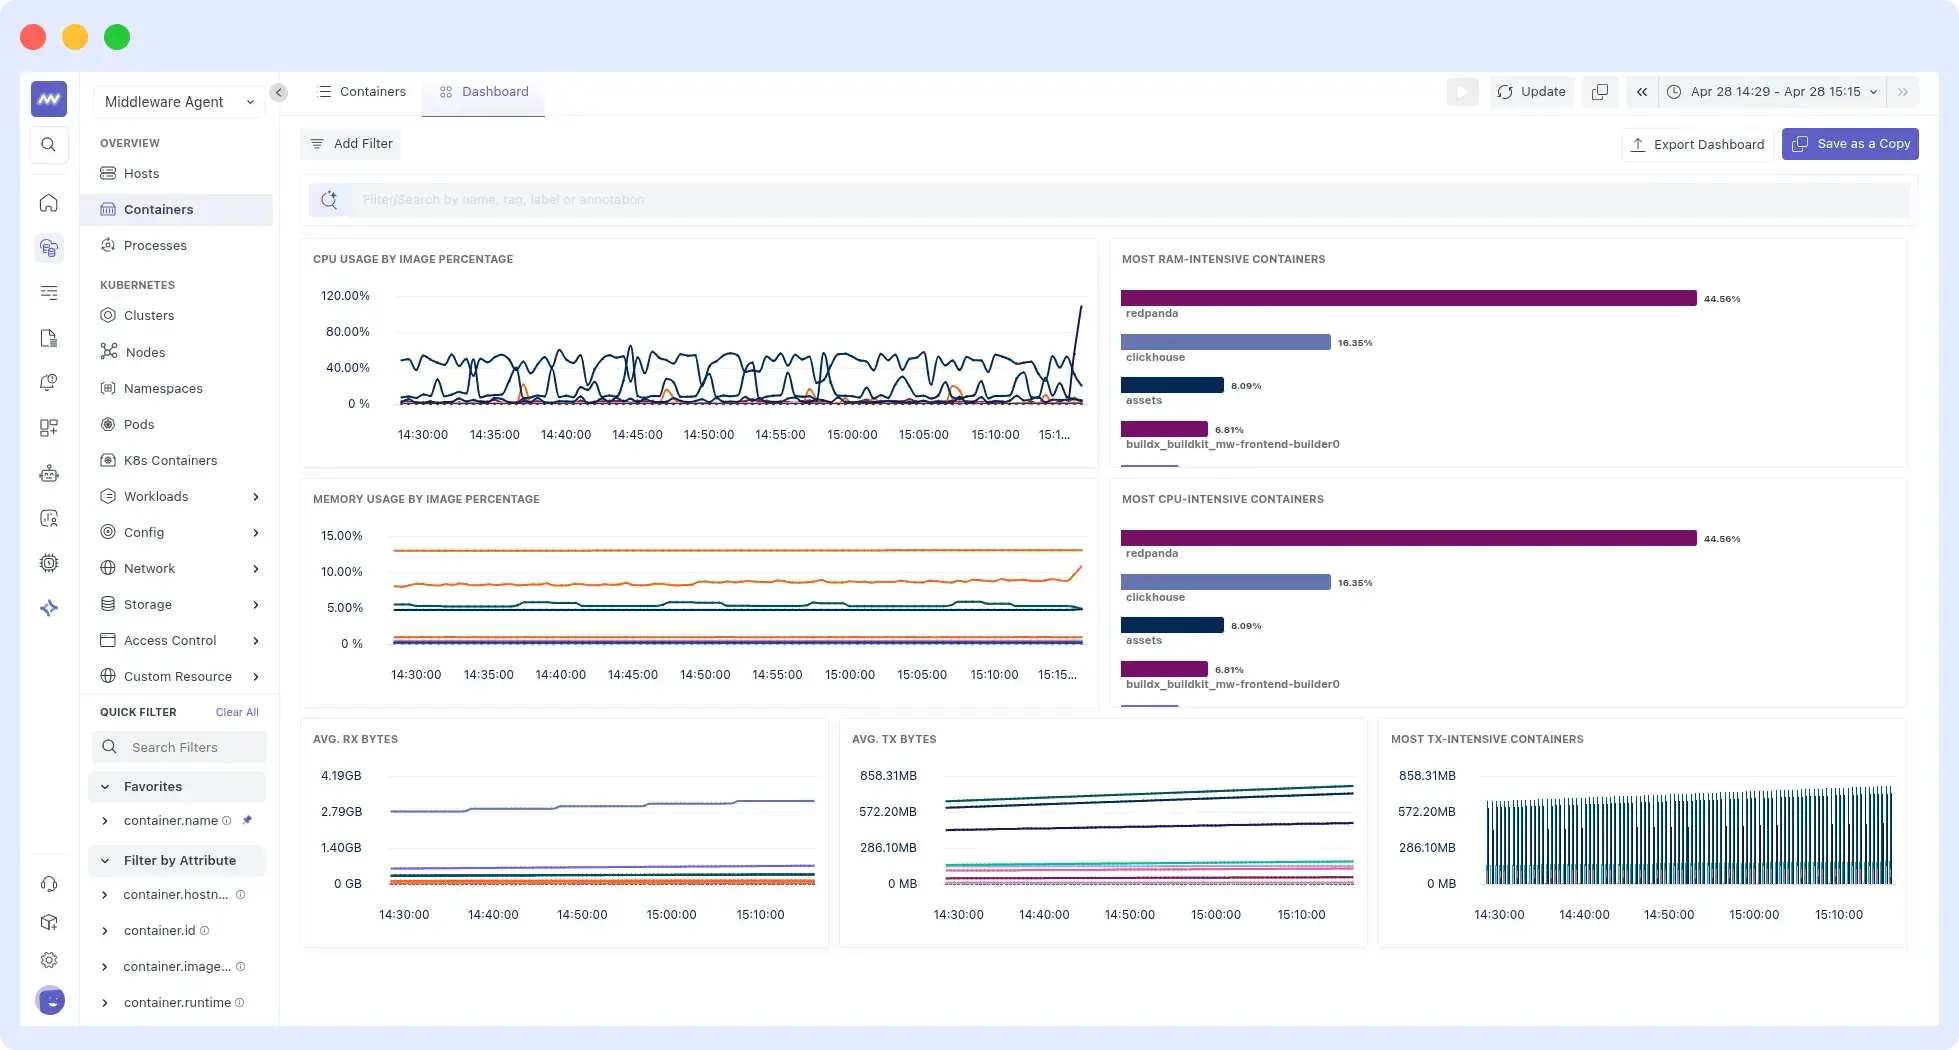
Middleware is a full-stack observability platform, best for teams running Docker on Kubernetes who want unified observability across metrics, logs, traces, and APM with OpenTelemetry support and predictable pricing.
It uses OpenTelemetry as its native collection layer, so telemetry stays in OTel format end-to-end rather than being converted into a proprietary schema. For Docker monitoring, the agent runs as a container, auto-discovers all containers on the host, and tracks lifecycle events such as restarts and OOM kills. It handles Docker on Kubernetes with orchestration-aware correlation across pods and services. See the Docker agent setup guide to get started.
Strengths
- Single UI for container metrics, logs, traces, APM, and RUM. A failing container can be traced back to the upstream service or deployment that caused it, especially useful in microservices architectures built on Docker.
- Usage-based pricing with a free trial covering metrics, logs, and traces up to 100 GB per month. No per-host charges that scale with the number of containers.
- OpsAI automatically analyzes metrics, Docker Container logs, and traces to pinpoint root causes and help fix issues in real time.
Limitations
- Integration library (450+) is smaller than Datadog’s or Dynatrace’s. Verify niche SaaS or database integrations are supported before committing.
- Best-fit for teams adopting multiple signal types. If you only need basic container metrics and already run Prometheus, Middleware is more than you need.
Pricing
- Free forever: $0, up to 100 GB data, 14-day retention.
- Pay As You Go: $0.30 per GB of metrics, logs, and traces. 30-day retention, SSO, OpsAI root cause analysis (token-based).
- Enterprise: Custom pricing with on-premise or bring-your-own-cloud deployment, custom retention, and 24/7 support. See full pricing details.
Verdict
Pick Middleware if you want unified observability across Docker and Kubernetes with OpenTelemetry support, predictable pricing, and AI-driven root cause analysis. Skip it if Prometheus alone covers your needs.
Start monitoring your Docker containers for free. No per-host charges, no credit card required.
2. Datadog
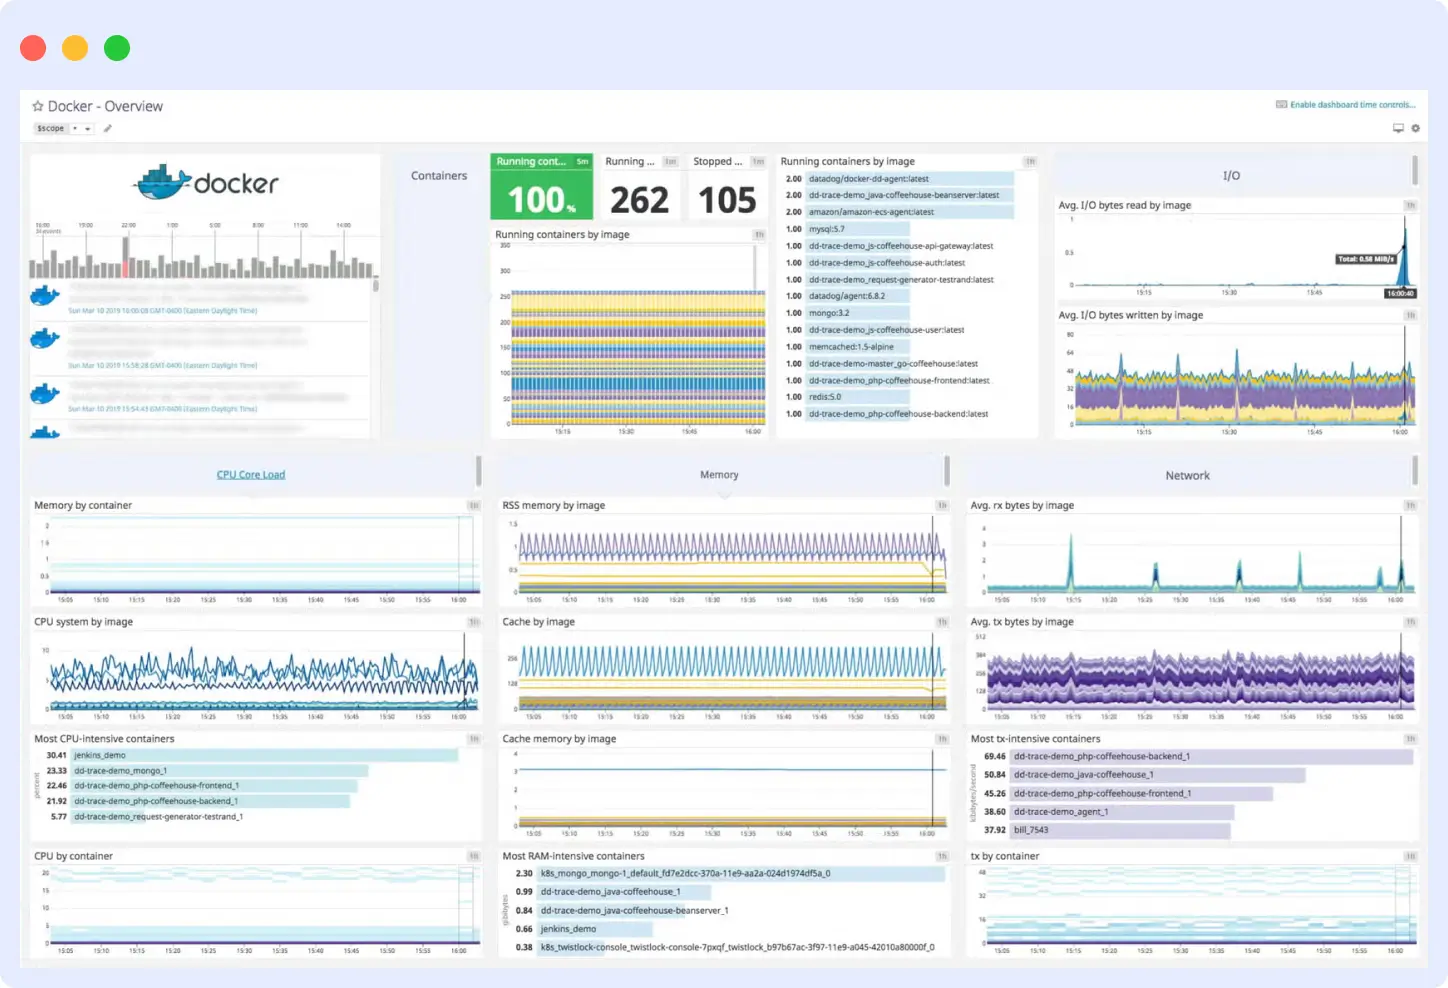
Datadog is a SaaS observability platform, best for large teams that want one vendor for infrastructure monitoring, APM, logs, and security, and can manage usage-based billing across multiple product lines.
It uses eBPF for kernel-level container visibility across Docker, Compose, Swarm, Docker-on-Kubernetes, and AWS Fargate, running the agent once per host without per-container configuration. It combines infrastructure monitoring, APM, log management, and security into a single product.
Strengths
- 1,000+ integrations. Covers most databases, cloud services, and SaaS tools with no extra configuration needed.
- Mature full-stack UI that unifies infrastructure, APM, logs, and security with strong cross-product correlation.
- Watchdog AI detects anomalies automatically across your infrastructure and applications without manual threshold configuration.
Limitations
- Pricing splits across separate product lines: infrastructure, APM, logs, custom metrics, and indexed spans each bill separately. Monthly costs often exceed initial estimates in environments with fluctuating host counts.
- Datadog converts OpenTelemetry data into its proprietary schema on ingestion, which creates switching costs if you move to a different backend later.
Pricing
- Infrastructure Pro: $15/host/month (annual) or $18 on-demand. Includes 5 containers per host.
- Infrastructure Enterprise: $23/host/month (annual) or $27 on-demand. Includes 10 containers per host.
- APM: $31/host/month (with Infrastructure attached).
- Log Management: $0.10/GB ingested plus $1.70/million events indexed (15-day retention).
- AWS Fargate APM: $2.60/task/month. See Datadog’s pricing for more details
Verdict
Pick Datadog for the broadest integrations, eBPF container visibility, and mature full-stack observability. Skip it if you’re a startup with under 20 hosts, need OpenTelemetry portability, or expect monthly bills under $200.
3. Dynatrace
Dynatrace is an enterprise observability platform, best for teams that want automated root cause analysis, live topology mapping, and a single agent across Docker and Kubernetes without writing correlation rules.
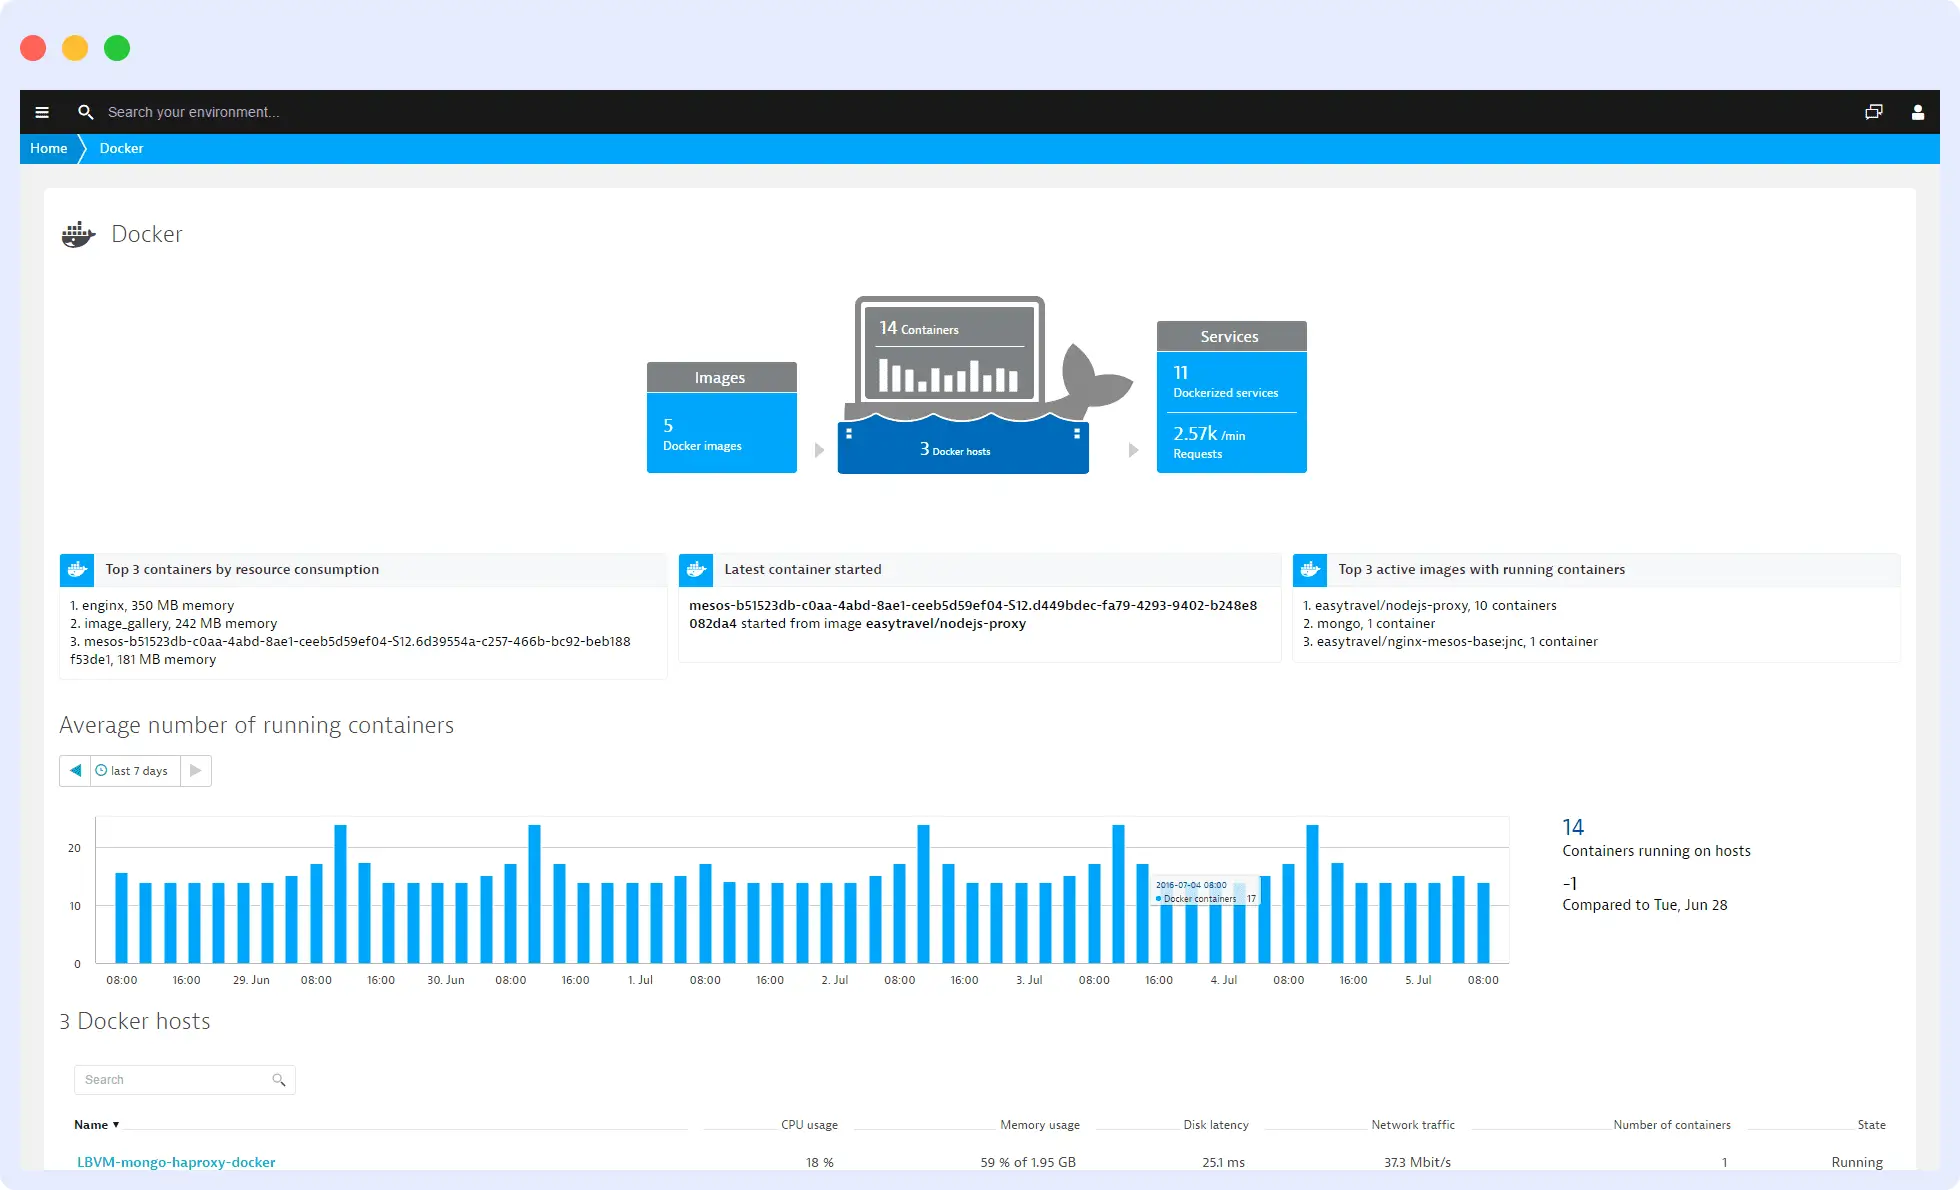
It uses OneAgent, a single host agent that monitors infrastructure, applications, logs, and security across 715+ technologies. That includes Docker, Kubernetes, cloud platforms, and serverless workloads. No code changes required.
Strengths
- Dynatrace Intelligence correlates metrics, traces, logs, and topology changes to identify the actual cause of an incident, not just the symptom. Analysis runs against baselines built from your environment, so you don’t write correlation rules.
- Smartscape builds a live dependency map of every container, process, and service as soon as they start running. Troubleshooting becomes a visual trace through the map rather than a search through logs.
Limitations
- Pricing ties to host memory size. Full-Stack Monitoring bills per 8 GiB of host memory, which makes budgeting difficult for workloads with dynamic memory allocation.
- OneAgent and Dynatrace Intelligence rely on a proprietary data model. OTel data is supported, but auto-correlation and root cause analysis work fully only with Dynatrace’s own instrumentation.
Pricing
- Foundation & Discovery: $7 per host per month. Basic infrastructure monitoring only.
- Infrastructure Monitoring: $29 per host per month. Adds process, memory, disk, and network analysis.
- Full-Stack Monitoring: $58 per 8 GiB host per month. Adds APM, Kubernetes monitoring, OpenTelemetry support, and 10 days of trace retention.
- Kubernetes Platform Monitoring: $1.40 per pod per month. Included free with Full-Stack.
- Log Analytics: $0.20 per GiB ingested, plus query and retention charges.
Verdict
Pick Dynatrace for automatic root cause analysis, live topology mapping, and a single agent across Docker and Kubernetes. Skip it if you need OpenTelemetry portability, run memory-optimized workloads where per-GiB billing is unpredictable, or can’t justify enterprise pricing for a small team.
4. New Relic
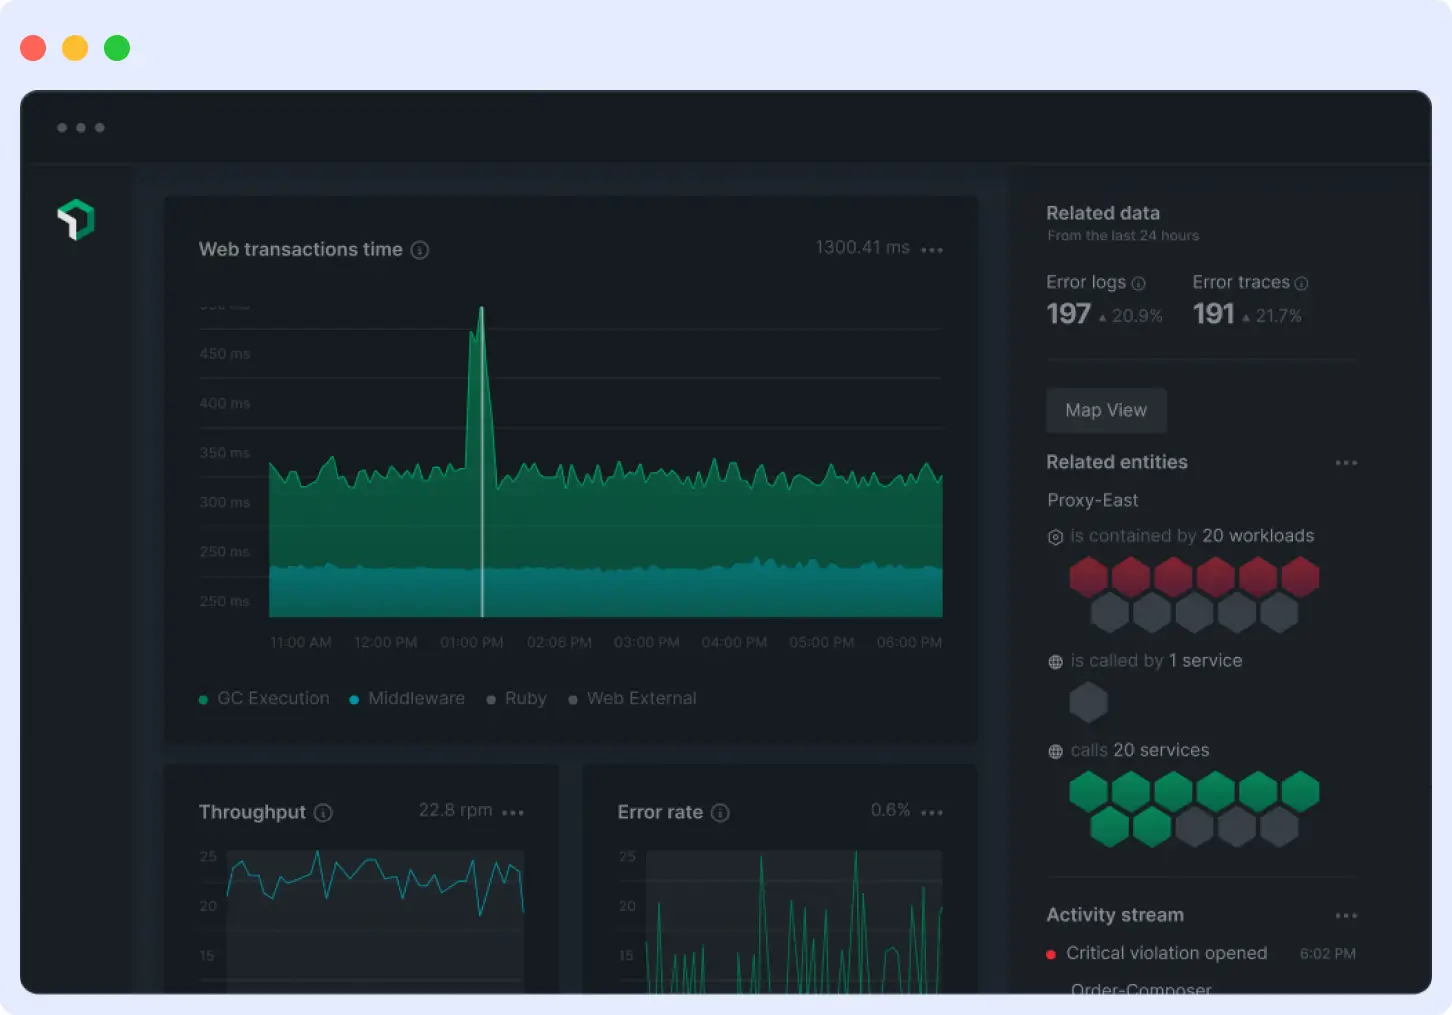
New Relic is a full-stack observability platform, best for teams that want full-stack observability without per-host pricing, where container counts scale freely, and billing tracks data volume instead of infrastructure size.
It is priced by data volume, not infrastructure size. Hosts, containers, and AWS Fargate tasks are unlimited at no extra cost. It covers infrastructure monitoring, APM, log management, Kubernetes, and digital experience monitoring with native OpenTelemetry support.
Strengths
- Free tier that includes 100 GB of data ingest per month, unlimited basic users, one full-platform user, and access to 50+ platform capabilities.
- 780+ integrations covering Kubernetes, AWS, Azure, Google Cloud, and Prometheus.
- User-based access tiers (basic, core, full platform) let you give dashboards and alerts to non-engineers for free, without paying for full platform seats.
Limitations
- Data-ingest pricing means costs rise with telemetry volume. High-cardinality container workloads that generate large log and trace volumes can exceed the 100 GB free tier quickly.
- Full-platform users cost $349 per month on annual Pro commitments, or $418.80 pay-as-you-go. This adds up fast for teams where many engineers need full access.
Pricing
- Free: 100 GB data ingest, unlimited basic users, one full-platform user, 8-day default retention.
- Standard: $0.40 per GB beyond 100 GB. $10 for the first full-platform user, $99 per user for additional (maximum 5).
- Pro: $0.40 per GB beyond 100 GB. $349 per user annual, $418.80 pay-as-you-go. Unlimited full-platform users.
- Enterprise: Custom pricing with FedRAMP Moderate and HIPAA eligibility via Data Plus.
- Data Plus option: $0.60 per GB for extended retention and compliance features. See New Relic’s pricing for more details.
Verdict
Pick New Relic if you want billing that scales with data volume rather than infrastructure size. Skip it if most engineers on your team need full-platform access, your workloads generate high log and trace volumes, or you expect to exceed the free tier regularly.
5. Sysdig
Sysdig is a cloud security and monitoring platform, best for security-sensitive teams that need runtime threat detection, compliance coverage, and container monitoring in a single platform.
It splits into two products: Sysdig Secure for runtime threat detection and posture management, and Sysdig Monitor for Kubernetes and cloud monitoring with managed Prometheus. Coverage spans Docker, Kubernetes, Linux, and Windows servers, and serverless workloads.
Strengths
- Falco-powered runtime threat detection. Sysdig created Falco and donated it to the CNCF, making runtime security a first-class feature, not an add-on.
- Managed Prometheus with full PromQL support. Existing dashboards and alerts migrate without rewriting queries.
- Single platform for cloud-native and traditional infrastructure. No separate tools for containers, VMs, and serverless workloads.
Limitations
- No public pricing. Both Secure and Monitor require a sales quote, making upfront budgeting difficult.
- Security-first focus. Teams that only need container monitoring may end up paying for bundled security features they don’t use.
Pricing
Sysdig does not publish pricing on its website. Licensing is based on:
- Sysdig Secure: number of hosts (compute instances for CSPM).
- Sysdig Monitor: host-based or time-series-based licensing.
- Cloud log detections: per events processed.
Verdict
Pick Sysdig for runtime threat detection, compliance, and container monitoring in one platform. Skip it if you want published pricing upfront, only need container monitoring without security bundling, or prefer a self-service purchase process.
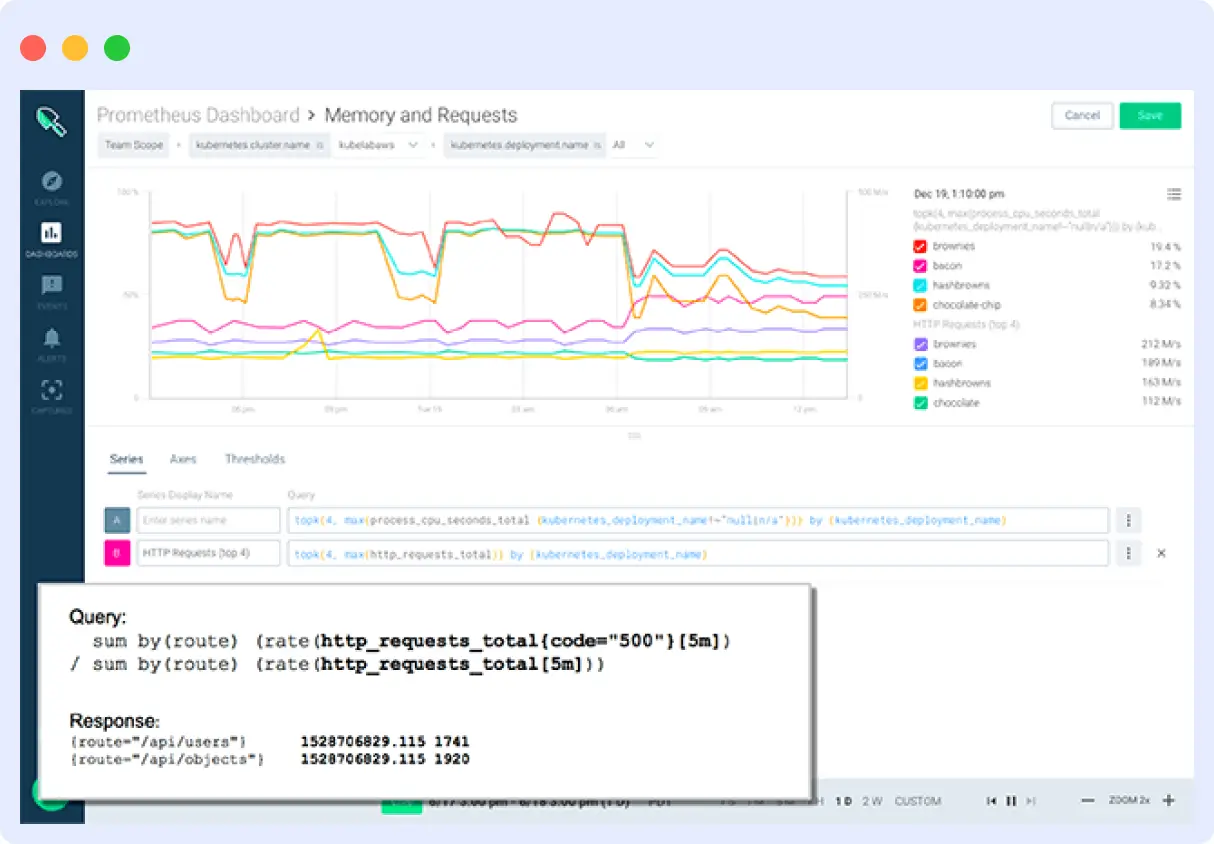
6. Prometheus + Grafana
Prometheus and Grafana are open-source tools most teams deploy together as a Docker monitoring stack. They’re best for teams that want full control over their monitoring stack, prefer self-hosted open-source over managed SaaS, and have the operational capacity to maintain multiple components.
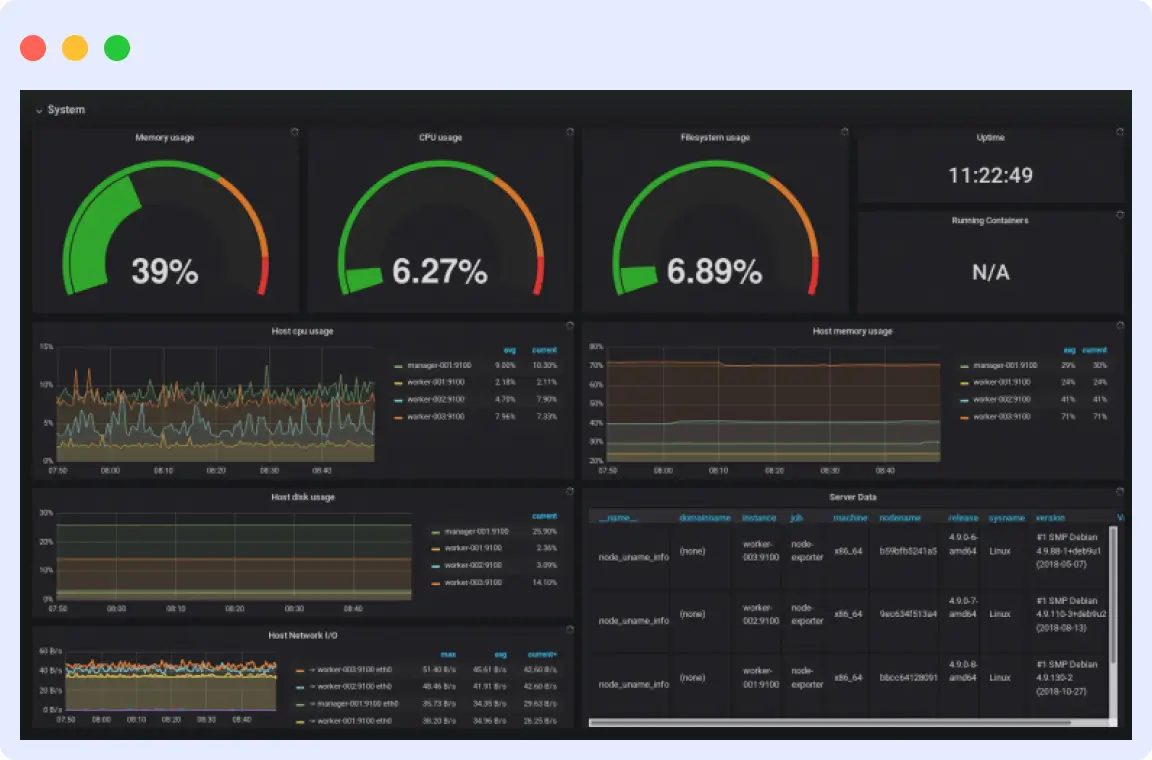
Prometheus collects and stores time-series metrics by scraping HTTP endpoints. Grafana queries those metrics and renders them as dashboards. Together, they cover metrics, logs via Loki, (see our Docker logging tutorial for setup) and traces via Tempo, with no vendor lock-in and no licensing cost.
Strengths
- PromQL is the industry-standard metrics query language. Borrow proven community dashboards instead of building from scratch.
- Grafana supports 150+ data sources. Combine Prometheus metrics with logs from Loki, traces from Tempo, and data from PostgreSQL or Elasticsearch in one dashboard.
- Your data stays on your own infrastructure. You can modify or extend either tool without vendor restrictions.
Limitations
- Self-hosting adds operational overhead. You maintain Prometheus, Grafana, exporters like cAdvisor and `node_exporter`, and Alertmanager yourself, including patching, scaling, and high availability.
- Prometheus doesn’t scale horizontally. Large deployments need Thanos or Mimir, and each signal type requires a separate backend.
Pricing
- Prometheus: Free, Apache 2.0 license.
- Grafana OSS: Free, AGPLv3 license.
- Grafana Cloud: Free tier (10K metrics, 50 GB logs, 50 GB traces, 3 users). Usage-based paid tiers available.
Verdict
Pick Prometheus + Grafana for full control and self-hosted open-source monitoring. Skip it if you don’t have DevOps capacity to maintain multiple components, need unified logs and traces included by default, or want alerting and dashboards ready without assembly.
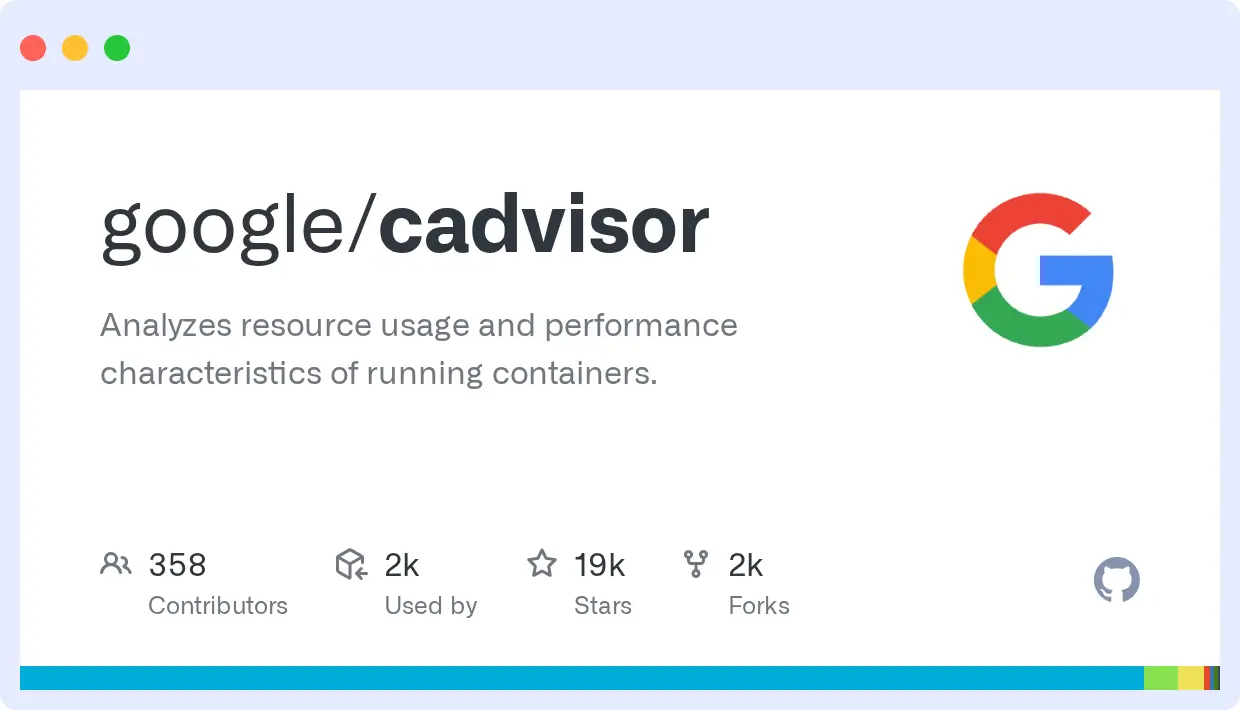
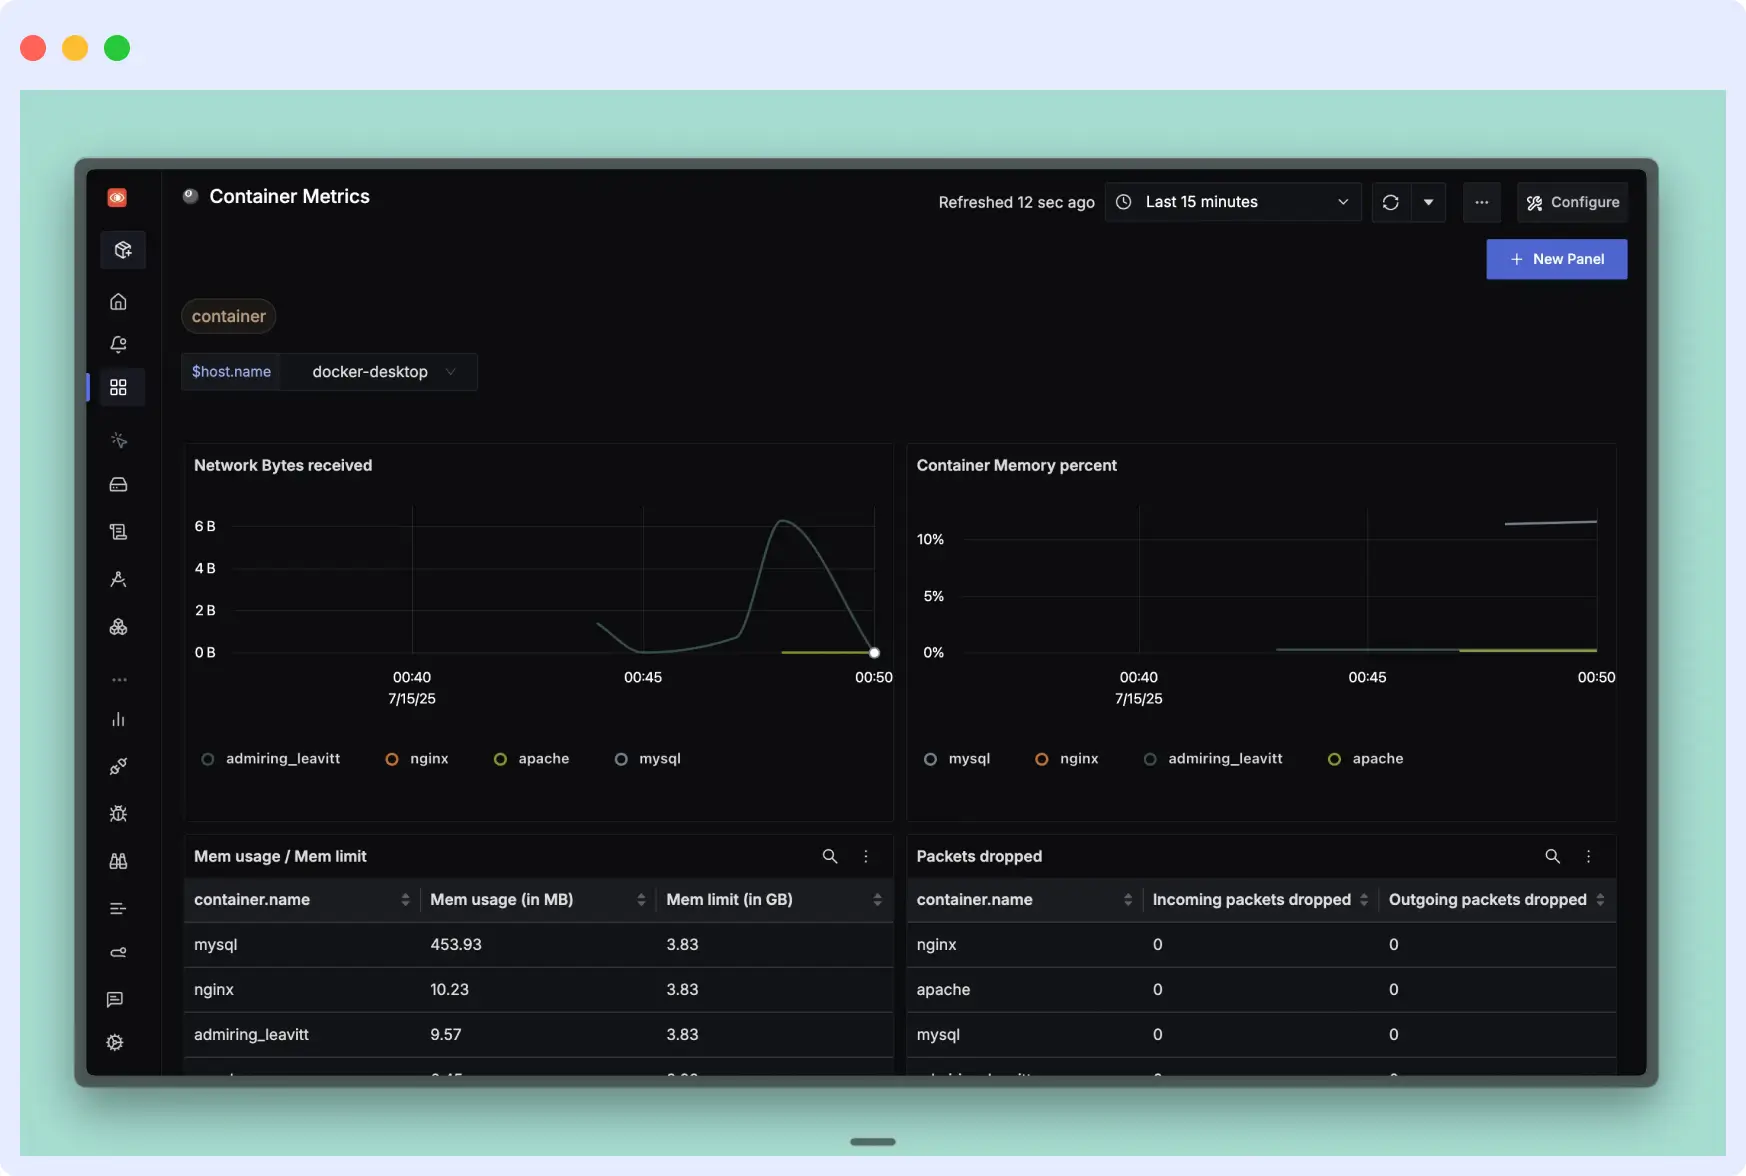
7. cAdvisor
cAdvisor (Container Advisor) is an open-source container metrics collector. It is best for teams building a self-hosted monitoring stack that needs a dedicated, zero-config container metrics collector to pair with Prometheus.
It runs as a daemon that tracks CPU, memory, network, and disk usage for every container on a host. It auto-discovers Docker containers through the Docker socket and exposes metrics on a `/metrics` endpoint in Prometheus format with no configuration required.
Strengths
- No adapters or exporters needed between cAdvisor and Prometheus. Metrics are available on a `/metrics` endpoint.
- Ships as a single container that runs with one `docker run` command. Maintained by Google under the Apache 2.0 license.
- Lightweight and purpose-built. It adds no overhead beyond what’s needed to collect and expose container resource metrics.
Limitations
- Metrics only. cAdvisor doesn’t handle logs, traces, alerting, or long-term storage. You need a separate backend like Prometheus and a visualization tool like Grafana.
- No container health tracking. cAdvisor reports resource usage but can’t tell you whether a container is functioning correctly.
Pricing
cAdvisor is free and open-source under the Apache 2.0 license. The official container image is hosted at `ghcr.io/google/cadvisor`. See the GitHub repository for installation details.
Verdict
Pick cAdvisor to pair with Prometheus or another backend for container metrics. Skip it if you need logs, alerting, health checks, or a complete monitoring solution in one package.
8. SigNoz
SigNoz is an open-source observability platform, best for teams that want to self-host or use managed cloud for unified observability without per-host or per-user charges.
It uses ClickHouse as its datastore and covers Docker, Kubernetes, and any workload that emits OTLP data. Both the self-hosted and cloud versions run on the same codebase, so dashboards and queries carry over without changes.
Strengths
- OpenTelemetry-native from day one. Your instrumentation stays vendor-neutral and works with any OTel-compatible backend if you switch later.
- Logs, metrics, and traces in one application. SigNoz correlates all three automatically, so you can jump from a slow trace to its related logs without switching tools.
Limitations
- Self-hosting requires running ClickHouse, which adds operational overhead. Teams without DevOps capacity may prefer the cloud version.
- Smaller integration library than older vendors. Verify niche SaaS or database integrations before committing.
Pricing
- Community (self-hosted): Free, AGPL-3.0 license.
- Cloud Teams: $49/month. Includes 163 GB logs and traces or 490M metric samples. Unlimited members and hosts.
- Usage above base: $0.30/GB for logs and traces. $0.10/million metric samples.
- Enterprise: From $4,000/month. Dedicated cloud, bring-your-own-cloud, or self-hosted with support.
Verdict
Pick SigNoz for OTel-native unified observability with usage-based pricing. Skip it if you need a large integration library, can’t run ClickHouse in self-hosted mode, or need enterprise support below the $4,000/month threshold.
9. Netdata
Netdata is an open-source monitoring platform, best for small to mid-size teams and homelab operators who want zero-config, per-second monitoring with data stored on their own infrastructure.
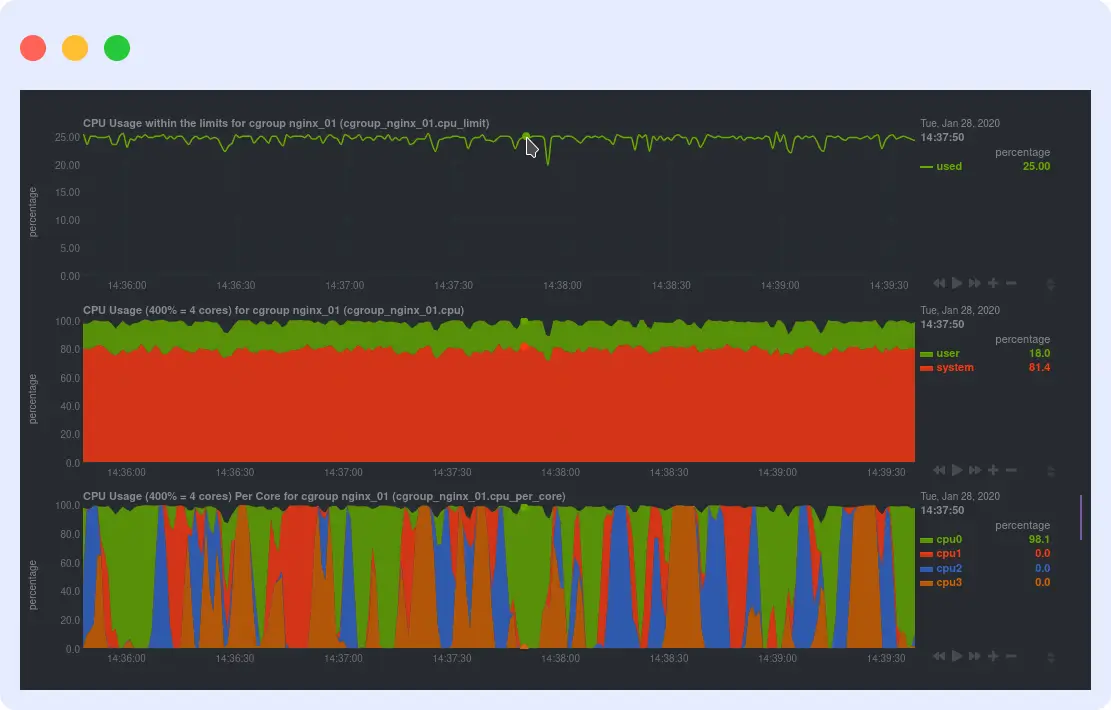
It installs on each host, auto-discovers containers and services, and builds dashboards without manual setup. It covers Docker, Kubernetes, Linux, and Windows workloads, with a cloud control plane for dashboards and team access.
Strengths
- Per-second metric granularity. Most tools collect every 10 to 60 seconds. Netdata collects every second, catching short-lived spikes that other tools miss.
- Data stays on your infrastructure. Netdata Cloud handles dashboards and team access, but never ingests your raw metrics.
Limitations
- Per-node pricing adds up for large environments. At $4.50/node/month, teams with hundreds of hosts may pay more than with data-volume tools.
- Distributed storage model requires adjustment. Data stays on each host, so cross-host queries rely on the cloud control plane to aggregate results.
Pricing
- Community: Free. Up to 5 nodes, 1 custom dashboard.
- Homelab: $90/year.
- Business: $4.50/node/month (billed annually). Unlimited metrics, logs, users, and retention. 14-day free trial.
- Enterprise On-Premise: Custom pricing.
Verdict
Pick Netdata for per-second visibility, zero configuration, and unlimited data volume per node. Skip it if you manage hundreds of hosts where per-node pricing exceeds data-volume alternatives, or need centralized data storage and cross-host queries without a cloud control plane.
10. Dozzle
Dozzle is a self-hosted, open-source log viewer, best for individual developers and small teams who need instant, browser-based log access across multiple Docker containers without running a full observability stack.
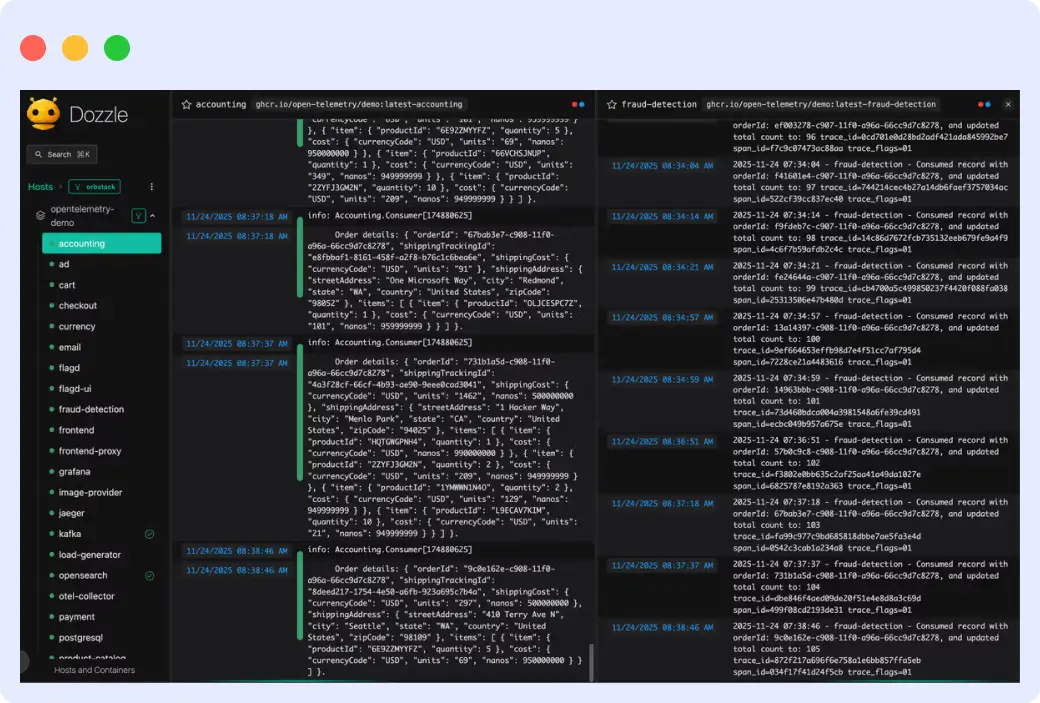
It mounts the Docker socket, auto-discovers containers, and streams live logs with no configuration. It doesn’t store logs, collect metrics, or support distributed tracing.
Strengths
- SQL-based log querying in the browser. Dozzle’s built-in SQL engine runs on DuckDB and WebAssembly. Query live log data without standing up Elasticsearch or a separate backend.
- Multi-host log aggregation via agent mode. Deploy Dozzle as an agent on remote hosts and connect them to a central instance over gRPC.
Limitations
- No log persistence. If a container stops or restarts, its historical logs are gone. Post-mortem analysis requires a separate log backend.
- Alerting requires Dozzle Cloud. AI-powered summaries, pattern clustering, and multi-channel notifications are not available in the self-hosted version.
Pricing
- Self-hosted (MIT license): Free. No event limits, no log retention.
- Dozzle Cloud Free: $0. 500 events/month, 24-hour retention, 10 assistant chats/month.
- Dozzle Cloud Pro: $10/month. 10,000 events/month, 14-day retention, 200 assistant chats/month, remote container control.
- Dozzle Cloud Team: $39/month. 50,000 events/month, 30-day retention, 1,000 assistant chats/month.
Verdict
Pick Dozzle for zero-config log visibility without a full monitoring stack. Skip it if you need log persistence, production alerting, metrics, or post-mortem analysis without paying for Dozzle Cloud.
11. Portainer
Portainer is a container management platform, best for DevOps teams and platform engineers who need a single interface to deploy, operate, and control containers across Docker, Swarm, and Kubernetes with built-in access control.
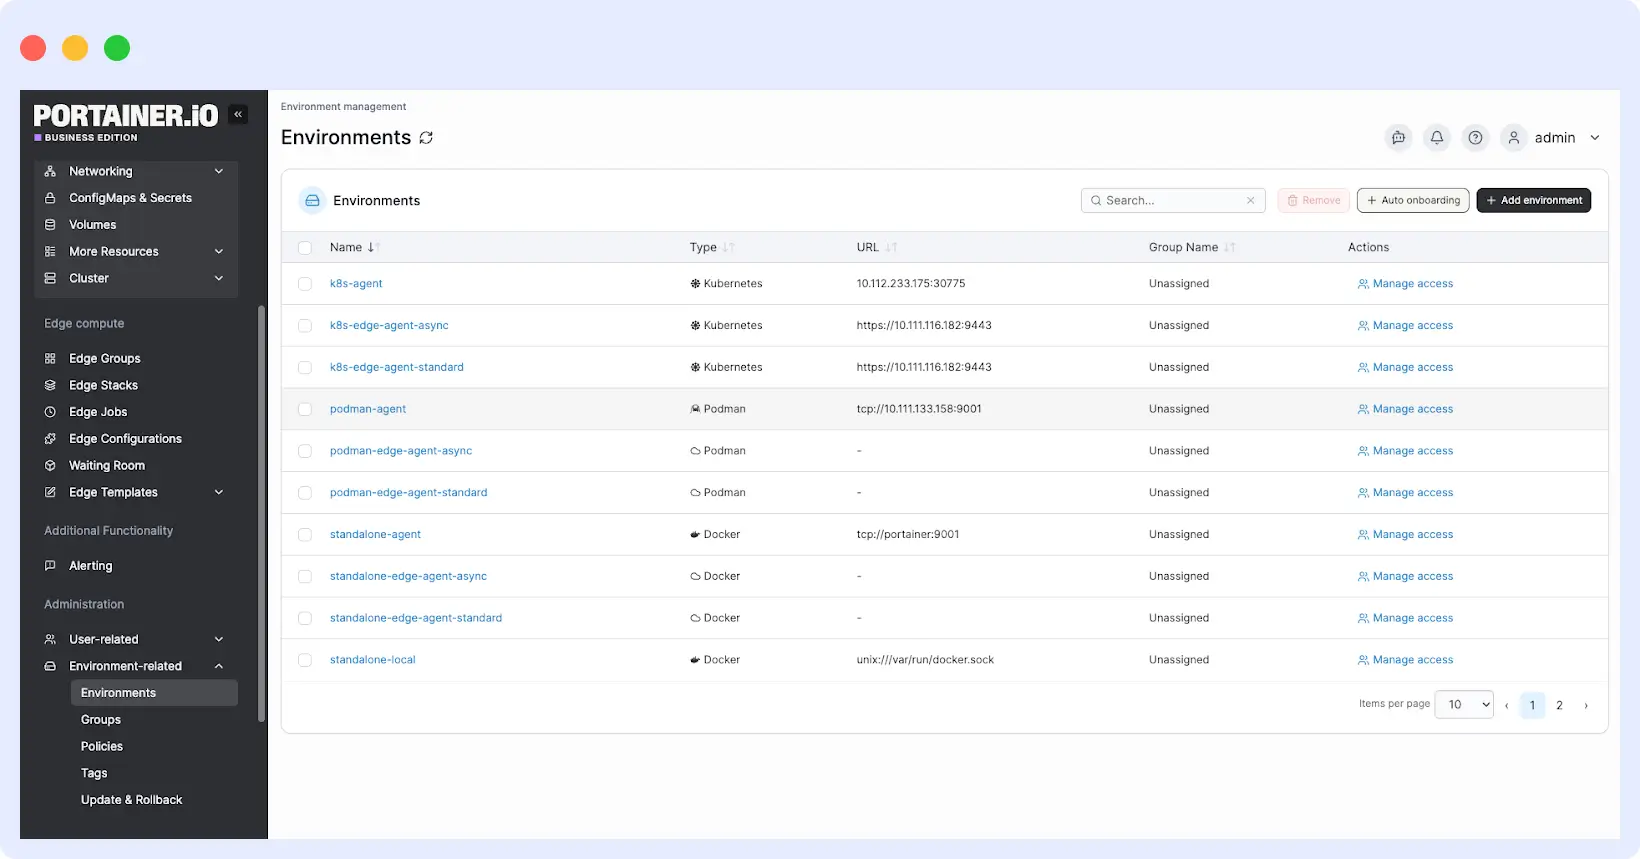
It lets teams deploy a stack and check its health, logs, and resource usage without switching tools. One instance manages Docker, Swarm, and Kubernetes environments from the same interface.
Strengths
- Deploy and operate from the same interface. Launch containers, inspect logs, check health, and view resource usage without leaving Portainer.
- RBAC is included in the free Business Edition tier. The first 3 nodes are free with role-based access control, external authentication, and audit logging.
Limitations
- Not an observability platform. Portainer shows live logs and basic resource stats but doesn’t store metrics, support tracing, or send alerts.
- Node-based pricing scales up quickly. Starter plans begin at $99/month for 5 nodes.
Pricing
- Community Edition: Free, open-source. No RBAC or advanced features.
- Business Edition, 3 Nodes Free: $0. Includes RBAC, audit logging, and external authentication.
- Home & Student: $149/year. Up to 15 nodes, non-commercial use only.
- Starter: From $99/month or $995/year. 5, 10, or 15 nodes. Commercial use.
- Scale: From $199/month or $1,995/year. Adds 9×5 support and onboarding.
- Enterprise: Contact sales. Unlimited vCPUs, 24/7 support, assigned support engineer.
Verdict
Pick Portainer for a single interface to deploy and operate containers across Docker, Swarm, and Kubernetes with free RBAC for small teams. Skip it if you need metrics, distributed tracing, alerting, or long-term storage. Portainer is a management layer, not a monitoring stack.
12. Sematext
Sematext is a full-stack observability platform, best for DevOps teams and SREs who want full-stack observability with per-signal pricing, no per-user fees, and broad orchestrator support.
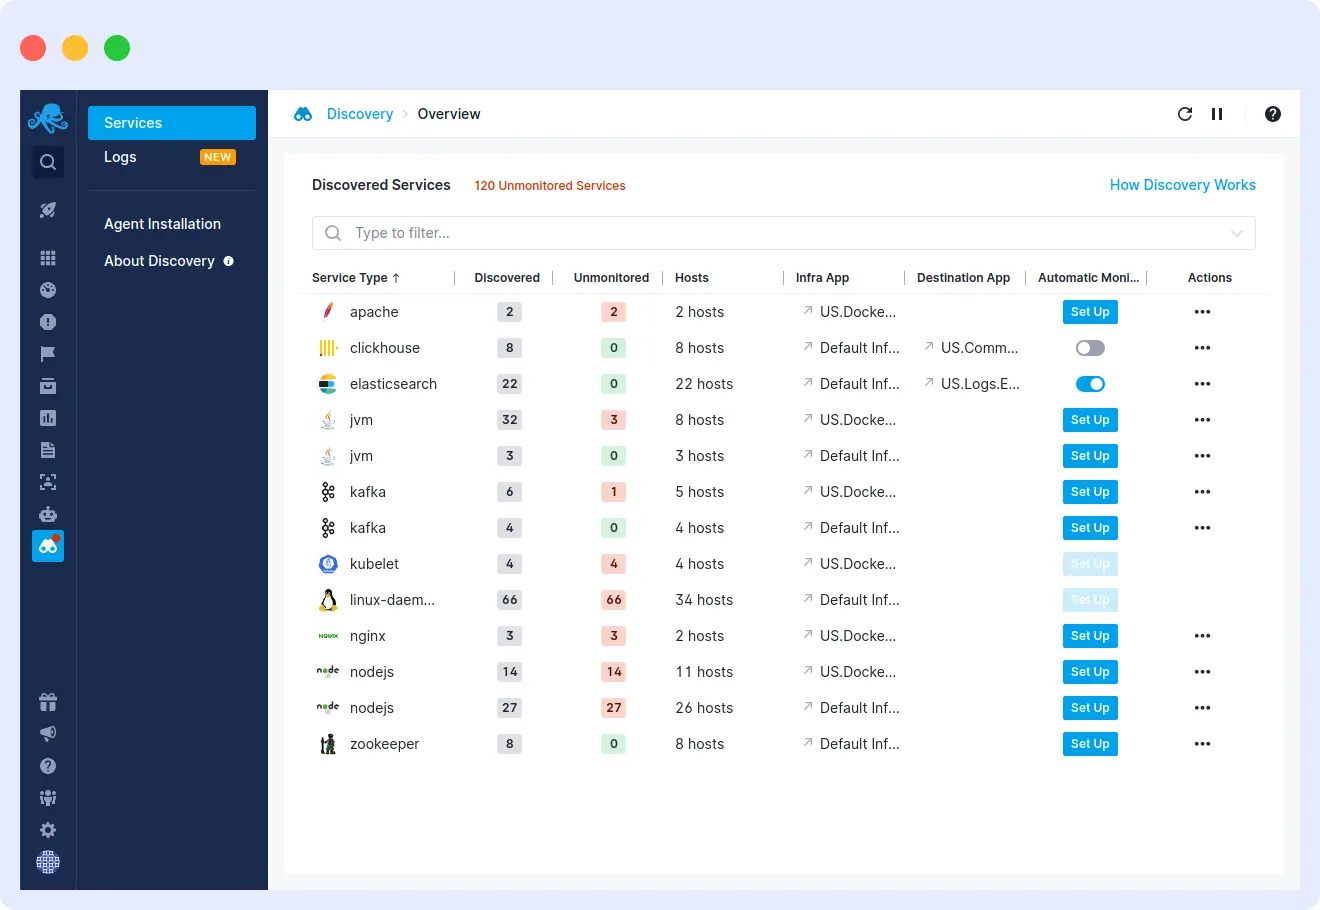
It covers logs, metrics, tracing, real user monitoring, and synthetic monitoring. Its agent auto-discovers containers across Docker, Swarm, Kubernetes, Nomad, and managed cloud environments, with each signal type priced separately.
Strengths
- App-scoped pricing. Each signal type gets its own plan, so you can mix paid and free tiers for different signals on the same host.
- eBPF-powered service discovery. Detects 100+ services from network traffic and maps container connections. No code changes required.
Limitations
- Billing complexity. Each signal type is billed separately for plan, volume, and retention, which makes cost estimation across multiple hosts harder.
- SaaS only for the full feature set. Sematext Enterprise supports on-premises deployment but excludes synthetic monitoring.
Pricing
- 14-day free trial, no credit card required.
- Infrastructure Monitoring: from $2.80/host/month. Docker adds a per-container charge on top of the free container count per host.
- Logs: from $5/month. Free Basic tier: 500 MB/day, 7-day retention.
- Tracing: from $19/month. Based on daily span volume and retention.
- Synthetics: from $2/HTTP monitor/month or $7/browser monitor/month.
- No per-user fees. No fixed data buckets. No overage charges.
Verdict
Pick Sematext for full-stack Docker observability with per-signal pricing and no per-user fees. Skip it if you need a single consolidated bill, require a fully self-hosted deployment with synthetic monitoring, or find per-App billing too complex to estimate at scale.
13. Dash0
Dash0 is an OpenTelemetry-native observability platform, best for teams already using OpenTelemetry who want a managed platform with true OTLP-native storage, PromQL across all signals, and consumption-based pricing with no base fee.
It stores and queries telemetry in OTLP format end-to-end. Every attribute stays intact from collection to query time. The Dash0 Kubernetes Operator handles auto-instrumentation and log collection via a single Helm chart with no code changes required.
Strengths
- Full PromQL across all signals. Query logs, metrics, and traces with PromQL and import existing Prometheus alert rules directly. No proprietary query language to learn.
- No base fee, no per-seat charges. You pay per million metric data points, spans, or log records. Real-time billing visibility is built into the UI.
Limitations
- Still maturing. G2 reviewers note that some convenience features found in older platforms are still in development.
- Standalone Docker requires more work. On plain Docker hosts, you configure the OpenTelemetry Collector yourself.
Pricing
- 14-day free trial, unlimited usage, no credit card required.
- No base subscription fee. No per-seat charges.
- Metric Data Points: $0.20/million. 13-month retention.
- Spans or Span Events: $0.60/million. 30-day retention.
- Log Records: $0.60/million. 30-day retention.
- Synthetic API Check Runs: $0.20/thousand. 13-month retention.
Verdict
Pick Dash0 for fully OTel-native observability with PromQL across all signals and no base fee. Skip it if you need mature feature depth, run most workloads on standalone Docker hosts outside Kubernetes, or need a large integration library from day one.
How to choose a Docker monitoring tool
Start by matching the tool to your infrastructure. Standalone Docker or Compose stacks work well with lightweight tools like Dozzle, cAdvisor, or Netdata. For Kubernetes environments, you need tools with native orchestration support, such as Middleware, Dash0, or Sematext.
If your workloads have compliance requirements, Middleware and Dynatrace cover HIPAA, SOC 2, and GDPR. If security is the priority, Sysdig combines runtime threat detection with container monitoring on a single platform.
For teams that want to avoid vendor lock-in, prioritize OpenTelemetry-native platforms. Middleware keeps your telemetry portable. Prometheus and cAdvisor give you full ownership with no licensing cost.
Start your free trial with Middleware.
FAQs
What is the best free Docker monitoring tool?
For logs only, Dozzle is the best free option in 2026. It deploys as a single container, requires no configuration, and streams live logs in the browser. It doesn’t persist logs, so pair it with Loki if you need retention beyond container restarts. For metrics, cAdvisor paired with Prometheus costs nothing. For unified logs, metrics, and traces, SigNoz Community Edition or Middleware’s free tier (up to 100 GB/month) is the strongest option.
Does Docker have a built-in monitoring tool?
Yes. `docker stats` shows real-time CPU, memory, network, and disk I/O per container. It stores no data and has no alerts, so it works for quick triage but not production monitoring. For keeping your Docker environment lean alongside monitoring, see our Docker cleanup guide.
How do I monitor Docker containers on Kubernetes?
Use a platform with native Kubernetes support. Middleware, Dash0, Sematext, and Datadog deploy via a DaemonSet or Operator, auto-discover pods and nodes, and correlate container metrics with orchestration data.
What’s the difference between Docker monitoring and container monitoring?
Docker monitoring covers containers run by the Docker daemon. Container monitoring is broader and includes any container runtime, such as Containerd or CRI-O, across orchestrators like Kubernetes.
How much should I budget for Docker monitoring?
Small workloads are covered by free tiers and open-source tools. Managed platforms start between $0 and $50/month. Per-host tools like Datadog cost more as infrastructure grows. Data-volume tools like Middleware and Dash0 scale more predictably.
Is Prometheus enough for Docker monitoring?
For metrics, yes. Pair it with cAdvisor and Grafana to collect and visualize container metrics with no licensing cost. It doesn’t handle logs or traces natively, so teams that need all three signals typically add Loki for logs and Tempo for traces. If maintaining multiple components is too much overhead, a unified platform like Middleware or SigNoz covers all three signals in one tool.