
Modern applications generate massive amounts of log data, and traditional log management systems struggle to keep up. Full-text indexing solutions are expensive to run, complex to manage, and often slow to scale. Teams need a better approach that balances powerful querying with operational simplicity and cost efficiency.
Grafana Loki addresses these challenges with a fundamentally different architecture inspired by Prometheus. By indexing only metadata labels instead of full log content, Loki delivers scalable log aggregation without the overhead of traditional systems.
What is Grafana Loki
Grafana Loki is an open-source log aggregation system designed to store and query large volumes of logs with minimal operational overhead. Loki was inspired by Prometheus and was developed by Grafana Labs.
Grafana Loki is not just a standalone logging tool; it is designed to integrate with the Grafana Observability Stack, often called the LGTM(Loki, Grafana, Tempo & Mimir) stack. Together, these four components create a unified observability platform that enables teams to correlate logs, metrics, and traces within a single workflow.
For example, an engineer can start by seeing a spike in error rates in Mimir, drill into a slow request in Tempo, and then jump directly into the exact log lines in Loki that caused the issue, all inside Grafana.
This tight integration is one of Loki’s biggest advantages over traditional logging systems like ELK or Splunk, which treat logs as a separate system rather than a fully connected observability signal.
🔹Teams that want this LGTM-style correlation without managing Grafana infrastructure manually can use Middleware’s Unified Observability Platform, which connects Loki logs, Prometheus metrics, and Tempo traces into a single hosted experience.
How does Grafana Loki Work?
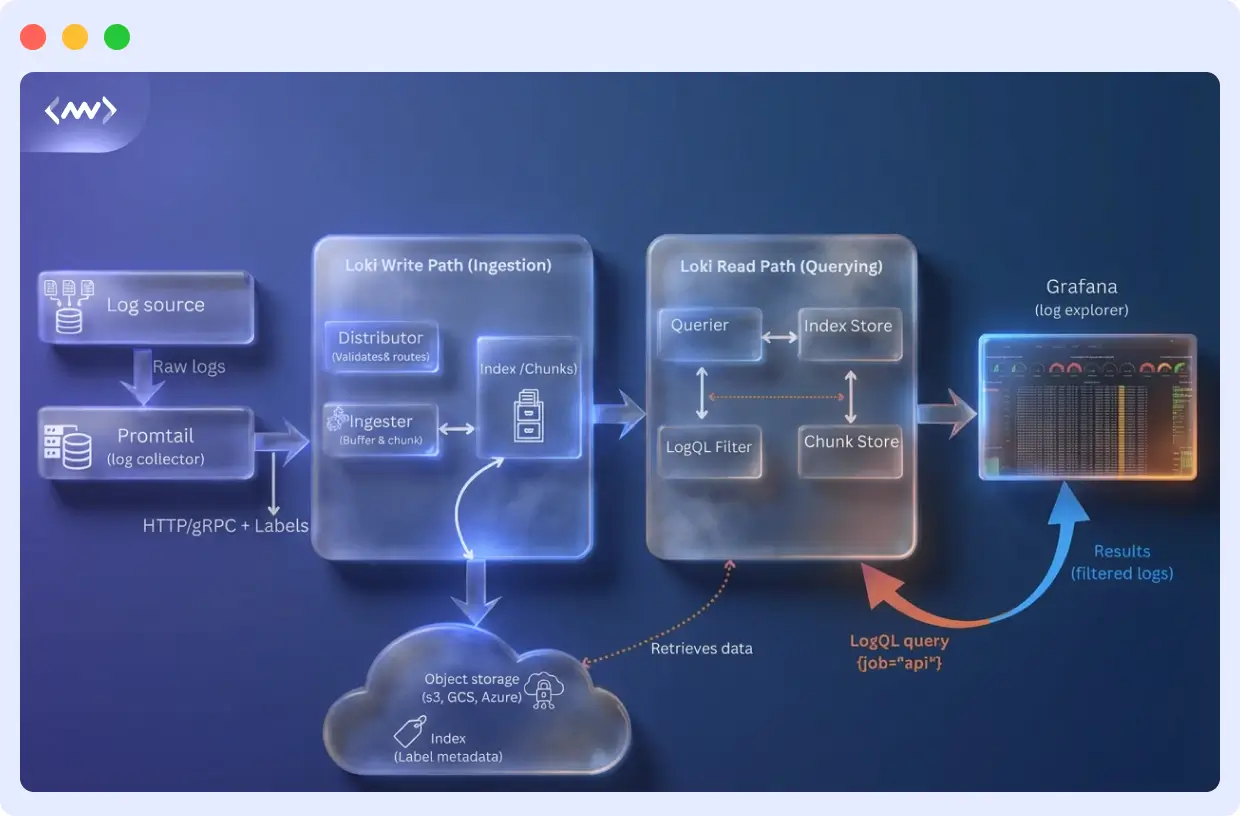
Grafana Loki stores and queries logs without creating operational headaches. The system splits into separate pieces that handle incoming logs, storage, and queries independently.
End-to-End Log Processing Pipeline in Grafana Loki
When logs flow through Loki, they pass through a clear, scalable pipeline designed for high-volume environments such as Kubernetes and microservices.
Here is the complete Loki log pipeline:
Application → Promtail / Fluent Bit → Distributor → Ingester → Object Storage (S3, GCS, Azure) → Querier → Grafana UI
Each stage plays a critical role:
- Promtail or Fluent Bit reads log files or container logs and attaches labels such as
app,namespace, andenvironment. - The distributor validates and routes log streams to the correct ingesters using consistent hashing.
- Ingester buffers logs in memory, compresses them into chunks, and periodically flushes them to object storage.
- Object storage holds the compressed log chunks cheaply and durably.
- Querier uses the label index to find the right chunks, downloads only the relevant data, and returns matching log lines to Grafana.
Because Loki only indexes labels and not the full log text, the pipeline remains fast even when handling millions of log lines per second.
🧩Loki stores logs in compressed chunks and indexes only metadata labels. For example, storing 1TB of logs in S3 with 12:1 compression can cost under $5/day, whereas full-text indexed systems often exceed $100/day at scale.
Label-Based Indexing
Instead of indexing log content, Loki indexes only metadata labels such as service, application, and environment. The raw log lines are stored in compressed chunks without indexing. This reduces storage footprint, keeps indexing light, and speeds up ingestion
⚠️ Avoid high-cardinality labels like user_id or session_id. Instead, use fixed labels like environment=prod, app=webserver, cluster=east. High-cardinality labels increase index size and slow queries.
How Loki Stores Logs at Low Cost
Grafana Loki stores log data in two parts:
- Compressed chunks in object storage
- A small label index that points to those chunks
The raw log lines are compressed and written to object storage such as Amazon S3, Google Cloud Storage, or Azure Blob Storage. Because logs compress extremely well, Loki typically achieves 10:1 to 20:1 compression.
For example:
If your system generates 1 TB of logs per day, Loki may store only 50–100 GB of data after compression.
Using Amazon S3 Standard pricing, storing 100 GB costs only a few dollars per month. In comparison, full-text-indexed systems like Elasticsearch often store multiple copies of data, which dramatically increases storage costs.
The index is also tiny, usually 1–2% of total log size, because Loki only indexes labels like app, cluster, and environment. Not every word inside the logs.
This design allows teams to retain logs for months or years without the runaway costs seen in traditional log platforms.
Log Collection and Querying
Logs are pushed to Loki via agents such as Promtail, which collect logs from applications, apply labels, and forward them to the distributors. Loki also works with other collectors such as Fluentd, Logstash, and Vector.
If you are using Middleware’s Infrastructure Agent, logs are automatically collected, converted to OpenTelemetry format, and forwarded to Loki with full trace and metric correlation built in.
For querying, Loki uses LogQL, a query language similar to PromQL. LogQL supports label filtering, pattern matching, and aggregations. Through Grafana, teams can visualize logs next to metrics and traces during investigations
Example LogQL Snippet to Add:
Real-World Example: Loki in a Kubernetes Cluster
Imagine a Kubernetes cluster running 150 microservices.
Each service sends logs with labels such as:
app=paymentsnamespace=productioncluster=europelevel=error
When an engineer runs this query:
Loki uses the label index to locate only the chunks that contain logs from the payments service in production, downloads those compressed chunks from object storage, and searches only that data.
Instead of scanning terabytes of logs, Loki reads just a few megabytes, making searches fast, cheap, and scalable.
☸️With Middleware’s Kubernetes monitoring, those same logs are automatically linked to pod health, CPU usage, and request traces, so engineers can see the full context of every error without switching tools.
Common Use Cases
Loki handles large amounts of distributed log data without breaking a sweat. It uses labels to organize resources, making it useful for operations, development, and security work.
Centralized Log Management for Microservices
Loki stores logs from all your distributed services in one place. Teams can query by service name, namespace, or pod instead of hunting through individual log files.
Application Debugging
Developers filter logs by labels, patterns, or trace IDs to find errors and performance problems. When you use Loki with platforms like Middleware, you can connect logs directly to metrics and traces.
When you use Loki with Middleware, every log line is automatically linked to the exact trace, container, and service that produced it, eliminating blind debugging and accelerating root-cause analysis.
🐛 Related Read: Learn how to identify and fix application performance issues by correlating logs with metrics:
Infrastructure Monitoring
Loki aggregates logs from servers, network devices, and other infrastructure components. You can collect and analyze logs from Kubernetes nodes, workloads, and system services all in one spot.
🔎 Related Read: What is Infrastructure Monitoring? Learn how to correlate logs with system metrics like CPU, memory, and network performance to diagnose infrastructure issues faster.
Security and Audit Trails
Loki is used by security teams to generate audit trails, detect threats, and generate compliance reports. Frameworks like GDPR, SOC 2, and HIPAA are generally more cost-effective to maintain over the long term with cost-effective object storage.
DevOps and CI/CD Pipelines
Push build logs, deployment records, and system events to Loki. You’ll see what changed, where things failed, and if releases were deployed correctly.
🔄 Related Read: Understand how CI/CD pipelines automate builds, testing, and deployments, and how log visibility helps you catch failures before they reach production.
Integration with the LGTM Stack
Loki forms a part of the LGTM observability suite, delivering a comprehensive approach to modern observability requirements. Every component fulfills a role while operating harmoniously as a whole:
- Loki (Logs): Detailed event records showing what happened
- Grafana (Visualization): Dashboards to view logs alongside metrics and traces
- Tempo (Distributed Tracing): Request flows showing how components interact
- Mimir (Metrics): Aggregated measurements showing system health over time
Loki is highly efficient at storing logs, and its primary strength lies in integrating metrics and traces. For instance, during a problem analysis, you could begin by noticing a spike in Mimir, then follow the unsuccessful requests in Tempo and narrow down logs in Loki by trace ID to pinpoint the exact cause of the failure using Grafana dashboards.
Since Loki uses labels the same way Prometheus does for metrics, connecting data across the stack feels natural and seamless.
How to Get Started with Loki
Getting Loki running is straightforward. Follow these steps to deploy, configure, and start querying logs.
Step 1: Deploy Loki
For quick testing or small deployments:
Run Loki locally with Docker:
This starts Loki in monolithic mode on port 3100, suitable for development and testing.
For production environments:
Deploy on Kubernetes using Helm:
# Add Grafana Helm repository
helm repo add grafana https://grafana.github.io/helm-charts helm repo update
# Install Loki helm install loki grafana/loki \ --namespace loki-stack \ --create-namespace \ --set loki.auth_enabled=false
Pick a deployment mode that matches your workflow. Use monolithic mode for testing, then move to simple scalable or microservices mode when you’re handling more logs.
Step 2: Configure Storage Backend
For production, configure object storage for cost-efficient, durable log retention. Edit your Loki configuration:
storage_config:
  aws:
    s3: s3://region/bucket-name
    s3forcepathstyle: false

  tsdb_shipper:
    active_index_directory: /loki/index
    cache_location: /loki/index_cache

schema_config:
  configs:
    - from: 2024-01-01
      store: tsdb
      object_store: s3
      schema: v13
      index:
        prefix: loki_index_
        period: 24h
Loki supports S3, GCS, Azure Blob Storage, and local filesystem. Object storage keeps costs low while supporting massive log volumes with compression ratios of 10:1 to 20:1.
Step 3: Set Up Log Collection
Deploy Promtail to collect and forward logs to Loki.
For Kubernetes deployments, use Helm:
helm install promtail grafana/promtail \
  --namespace loki-stack \
  --set config.clients[0].url=http://loki:3100/loki/api/v1/push
For manual configuration, create a promtail-config.yml:
server:
  http_listen_port: 9080
  grpc_listen_port: 0

positions:
  filename: /tmp/positions.yaml

clients:
  - url: http://loki:3100/loki/api/v1/push

scrape_configs:
  - job_name: system
    static_configs:
      - targets:
          - localhost
        labels:
          job: varlogs
          __path__: /var/log/*.log
Promtail identifies logs, assigns a label, and sends them to Loki. Depending on your setup you might also utilize other collectors such as Fluentd, Fluent Bit or Logstash
Step 4: Design Your Label Schema
Define labels before ingesting logs at scale. Use low-cardinality labels that represent query dimensions:
Good labels:
- app: service or application name
- environment: prod, staging, dev
- namespace: Kubernetes namespace
- level: info, warn, error
- cluster: cluster identifier
Avoid high-cardinality labels:
- ❌ user_id, request_id, trace_id
- ❌ IP addresses, timestamps, unique identifiers
High-cardinality data should go in the log content itself, not as labels. Keep unique label combinations manageable for optimal performance.
Step 5: Query Logs with LogQL
Loki uses LogQL to query logs. Start with basic label filtering:
Add filters to narrow results:
Parse structured logs and filter on fields:
Create metrics from logs:
Search errors in 5 minutes
Show counts of errors
Extract JSON fields
Correlation with traces
LogQL supports pattern matching, JSON/logfmt parsing, and metric extraction. Use Grafana’s Explore interface to build and test queries interactively.
Step 6: Visualize and Monitor
Connect Loki to Grafana:
- In Grafana, go to Configuration → Data Sources → Add data source
- Select Loki
- Set URL to http://loki:3100 (or your Loki endpoint)
- Click Save & Test
🧭Instead of wiring Grafana, Loki, Tempo, and alerting manually, you can use Middleware’s hosted observability to visualize everything in one place.
After establishing a connection, use Grafana’s Explore interface to search logs, build dashboards that merge logs and metrics, and configure alerts triggered by log patterns. Grafana offers tailing, log panels with filtering capabilities, and connections to associated traces, for full observability.
Loki and Middleware: Unified Observability
Teams using Middleware can send logs through collectors like the Infrastructure Agent, which converts them to OpenTelemetry format.
This lets you connect logs, metrics, and traces directly through the Middleware’s interface. You won’t need to switch between tools when investigating issues, since everything is in one place.
👉 Try it live: Start a free Middleware trial and connect your Loki logs, Prometheus metrics, and traces in under 5 minutes.
After you connect to Middleware, you get these additional features on top of Loki:
Unified Correlation Across Logs, Metrics, and Traces
Middleware links Loki logs to distributed traces and metrics. You can start with a spike in a metric, drill into a trace, then view the exact log entries tied to that trace ID, eliminating the manual work of switching dashboards or copying identifiers across tools.
Context-Rich Log Explorer
The Log Explorer shows more than raw log lines. When you open a log entry, you see related attributes like host, process, and container details. If the log contains a trace ID, Middleware surfaces the related trace, allowing you to jump directly to it and understand the full request context.
Log Pattern Detection
Middleware automatically groups similar logs into patterns, helping teams identify recurring issues and spot unusual behavior without scrolling through thousands of near-identical entries. Pattern detection runs in real time, making it easier to understand trends during active incidents.
Ingestion Control
Middleware lets teams control log volume by filtering or dropping logs during ingestion. You can configure processor rules or trim logs by attributes before they enter the platform, helping manage costs while maintaining signal quality.
Log Exploration Without Deep Query Syntax
While LogQL remains available when needed, Middleware’s UI enables search, filtering, and exploration through point-and-click interactions. This makes log investigation accessible to teams who prefer not to learn specialized query languages.
Dashboards That Connect All Signals
Middleware supports custom dashboards that let teams monitor system health across metrics, traces, and logs. During investigations, you can trace issues back to relevant log data directly from dashboard panels, maintaining context throughout the troubleshooting process.
Together, they provide Loki’s efficient log storage with Middleware’s unified observability experience, making it easier and faster for engineering teams to understand and resolve issues.
Conclusion
Loki reduces logging costs by indexing labels rather than full text. If your team already runs Prometheus, Grafana, or Tempo, adding Loki is straightforward because it integrates with the LGTM stack.
Organizations seeking unified observability can use Loki with platforms such as Middleware. You get cost-effective log storage and can correlate logs with metrics and traces without switching between tools. This combination reduces tool switching, accelerates troubleshooting, and gives engineering teams complete visibility into their systems.
See how engineering teams move from scattered tools like Grafana, Loki, and Prometheus to a single unified observability platform with zero downtime and full visibility. Start your 30-day migration →
From centralizing microservices logs to debugging applications and building compliance-ready audit trails, Loki provides a solid foundation that scales with your needs.
What makes Loki different from ELK?
Loki indexes only metadata labels versus full text indexing in ELK, reducing cost and complexity.
Is Loki suitable for Kubernetes logs?
Yes, Loki excels at Kubernetes logs with low-cardinality labels tied to pods, namespaces, and clusters.
How does Loki store logs long-term?
Logs are stored in compressed chunks in object storage (S3, GCS, Azure Blob Storage), with a compact index for retrieval.
🔍 Related Reads
📊 Explore differences in monitoring, logs, and alerting between two popular platforms. Grafana vs Datadog
⚡ Grafana vs New Relic: Compare capabilities for metrics, logs, tracing, and overall observability.
🧠 Prometheus vs Grafana vs Middleware: See how each tool handles metrics, logging, and dashboards in modern stacks.
📈 Prometheus vs Grafana: Understand how these core open-source tools differ and how they complement each other.
🔁 Grafana Alternatives: Explore other observability and monitoring solutions to consider.


