Looking for Grafana alternatives? You have come to the right place!
Grafana is an open-source data visualization and monitoring software that enables users to explore, build, and share dashboards with their teams. The tool offers a visualization suite to transform data into real-time actionable insights.

It offers graphs, bar charts, histograms, and state timelines to visualize your data across different platforms in a unified space via plugins.
Though Grafana brings multiple data sources to a single dashboard and streamlines monitoring, there are a few aspects that users struggle with (based on G2 reviews).
- Hard to set up: Grafana is hard to set up. The UI does not offer proper support and is not user-friendly for complex systems.
- Steep learning curve: The software has different plugins and connections and is difficult to understand. Moreover, the log analysis has several limitations.
- Complex integration: According to a user, data sources integration in Grafana involves configuring the sources and connectors, which is time-consuming and complex for non-technical users.
If you’re facing the above concerns, it’s time to look for Grafana alternatives that address your unique needs much better. Here’s our curated list of the top 10 alternatives to Grafana in 2026.
Top 10 Grafana alternatives to consider in 2026
1. Middleware
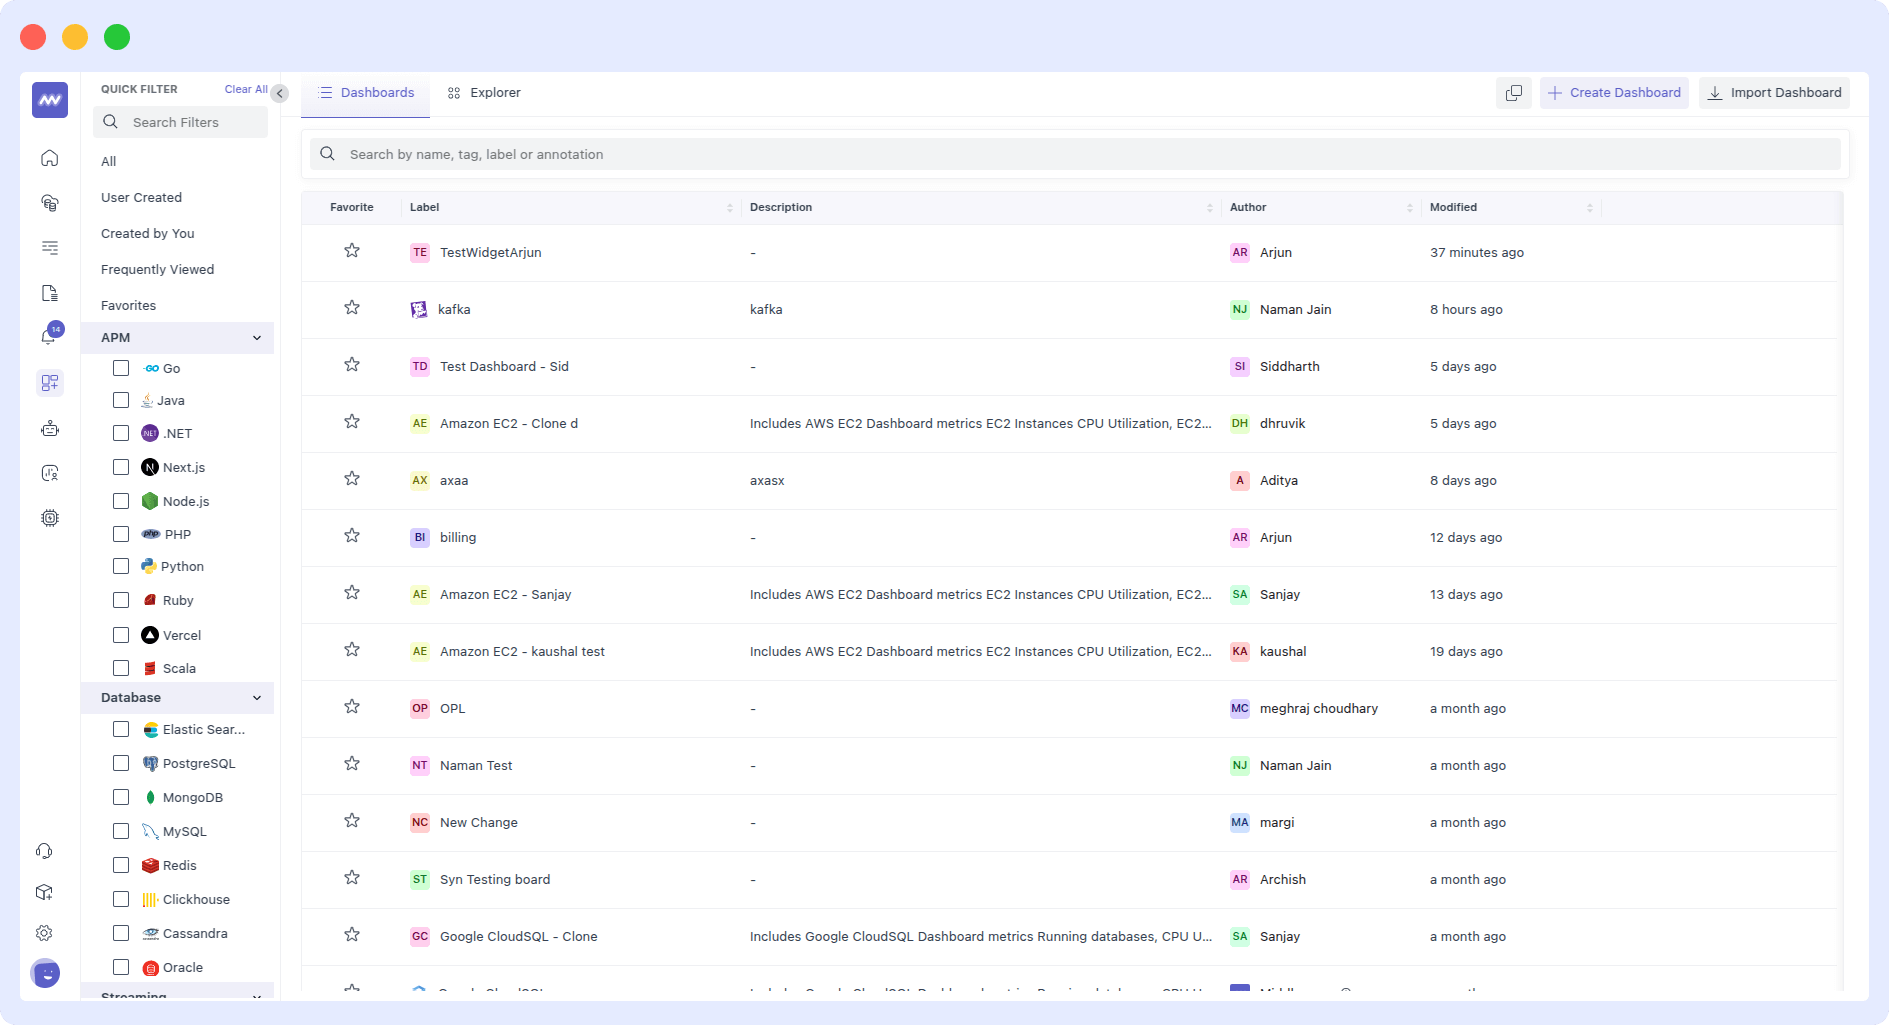
Middleware is a full-stack observability platform that offers comprehensive data visualization and monitoring features, making it the best Grafana alternative.
The platform integrates, aggregates, and analyzes data from multiple sources and creates custom dashboards for end-to-end visibility of your entire tech stack. It simplifies monitoring of your application and infrastructure performance.
Key features
- Customized dashboards to track important metrics related to the performance of applications and infrastructure.
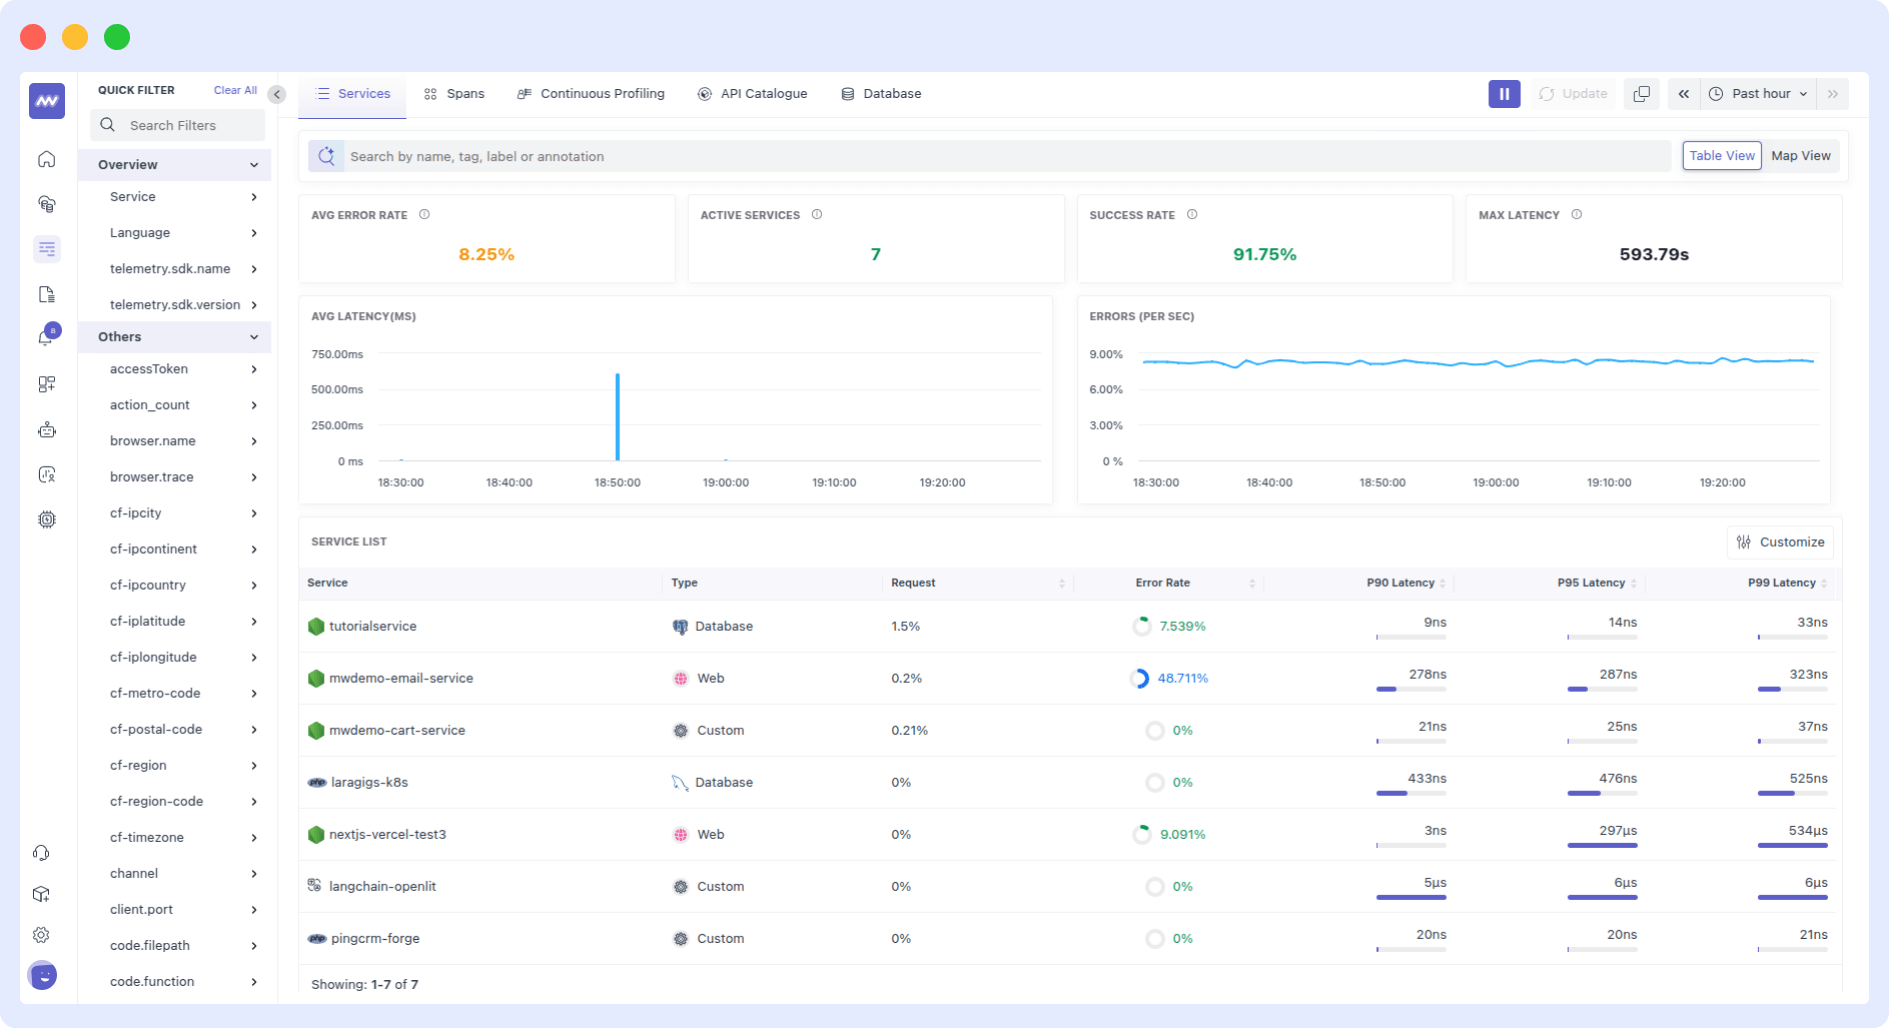
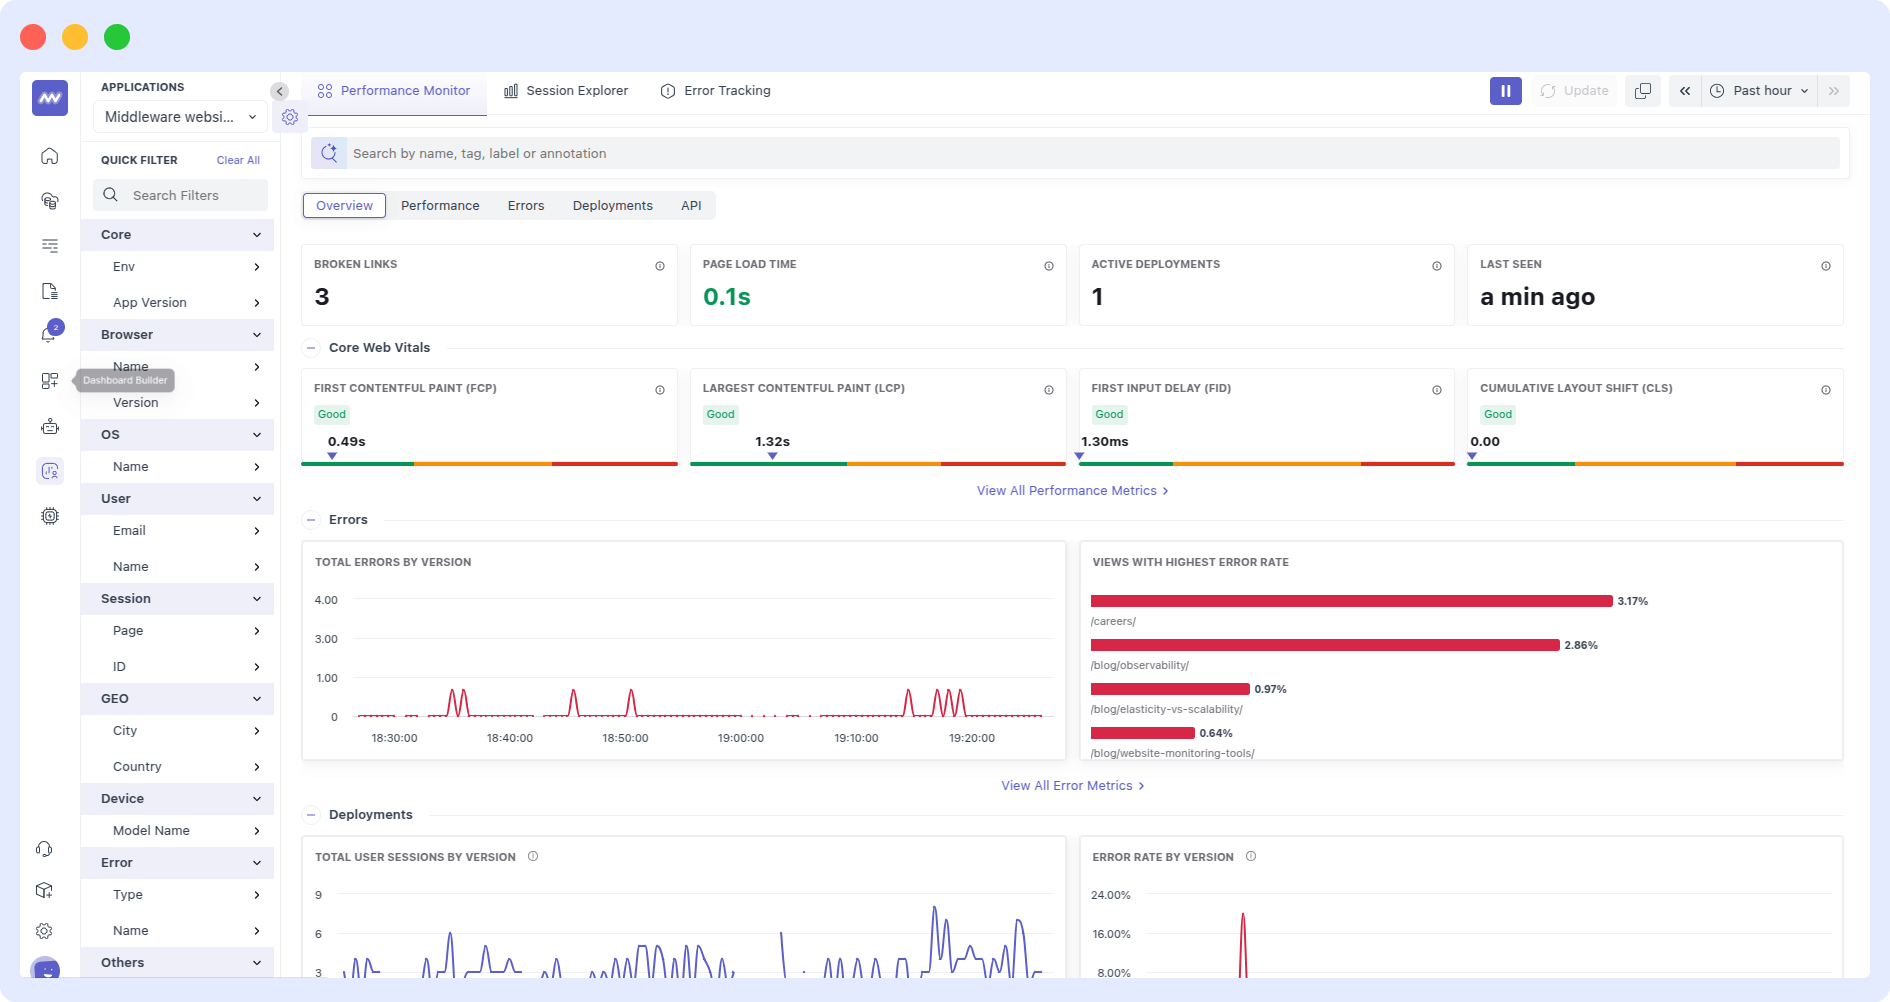
- Powerful Application Performance Monitoring (APM) dashboard for real-time insights into response times, app usage patterns, success, and error rates; unified view of logs, metrics, and traces; and diverse graphs to track Trace Latency, Success, and Errors.
- Centralized log monitoring capabilities for complete visibility, real-time search, and powerful insights into applications and systems.
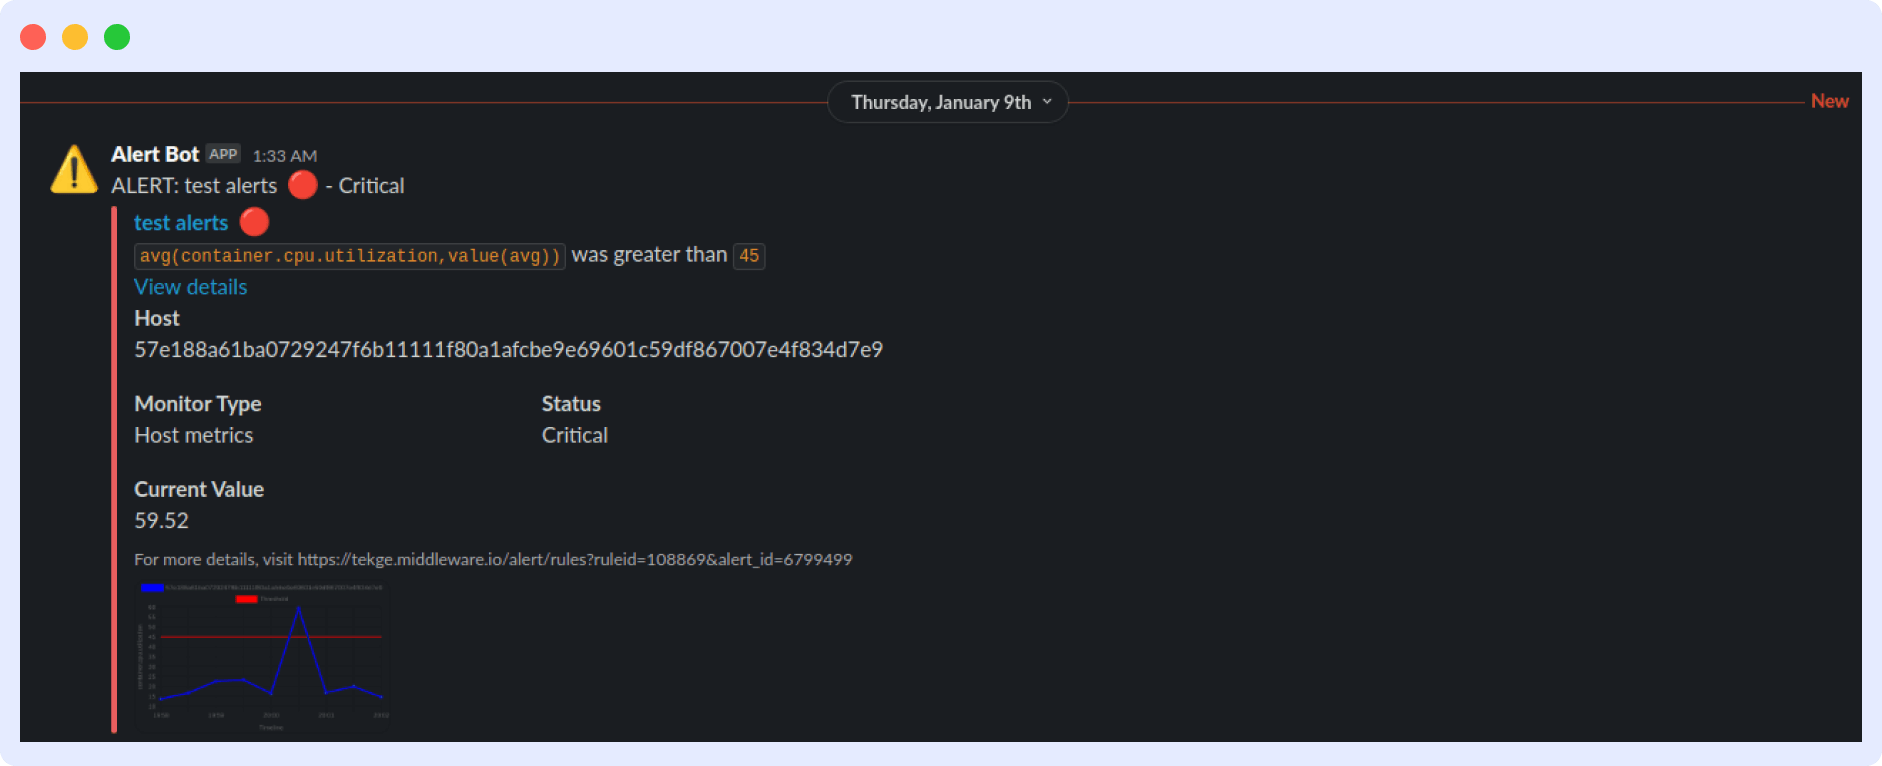
- Customizable alerts for critical and error logs in the system. You can also set custom alerts to proactively monitor critical apps or infrastructure issues.
- Distributed tracing to identify and resolve issues before they impact users. To spot issues faster, developers can track requests and get full visibility of their applications, including traces and errors.
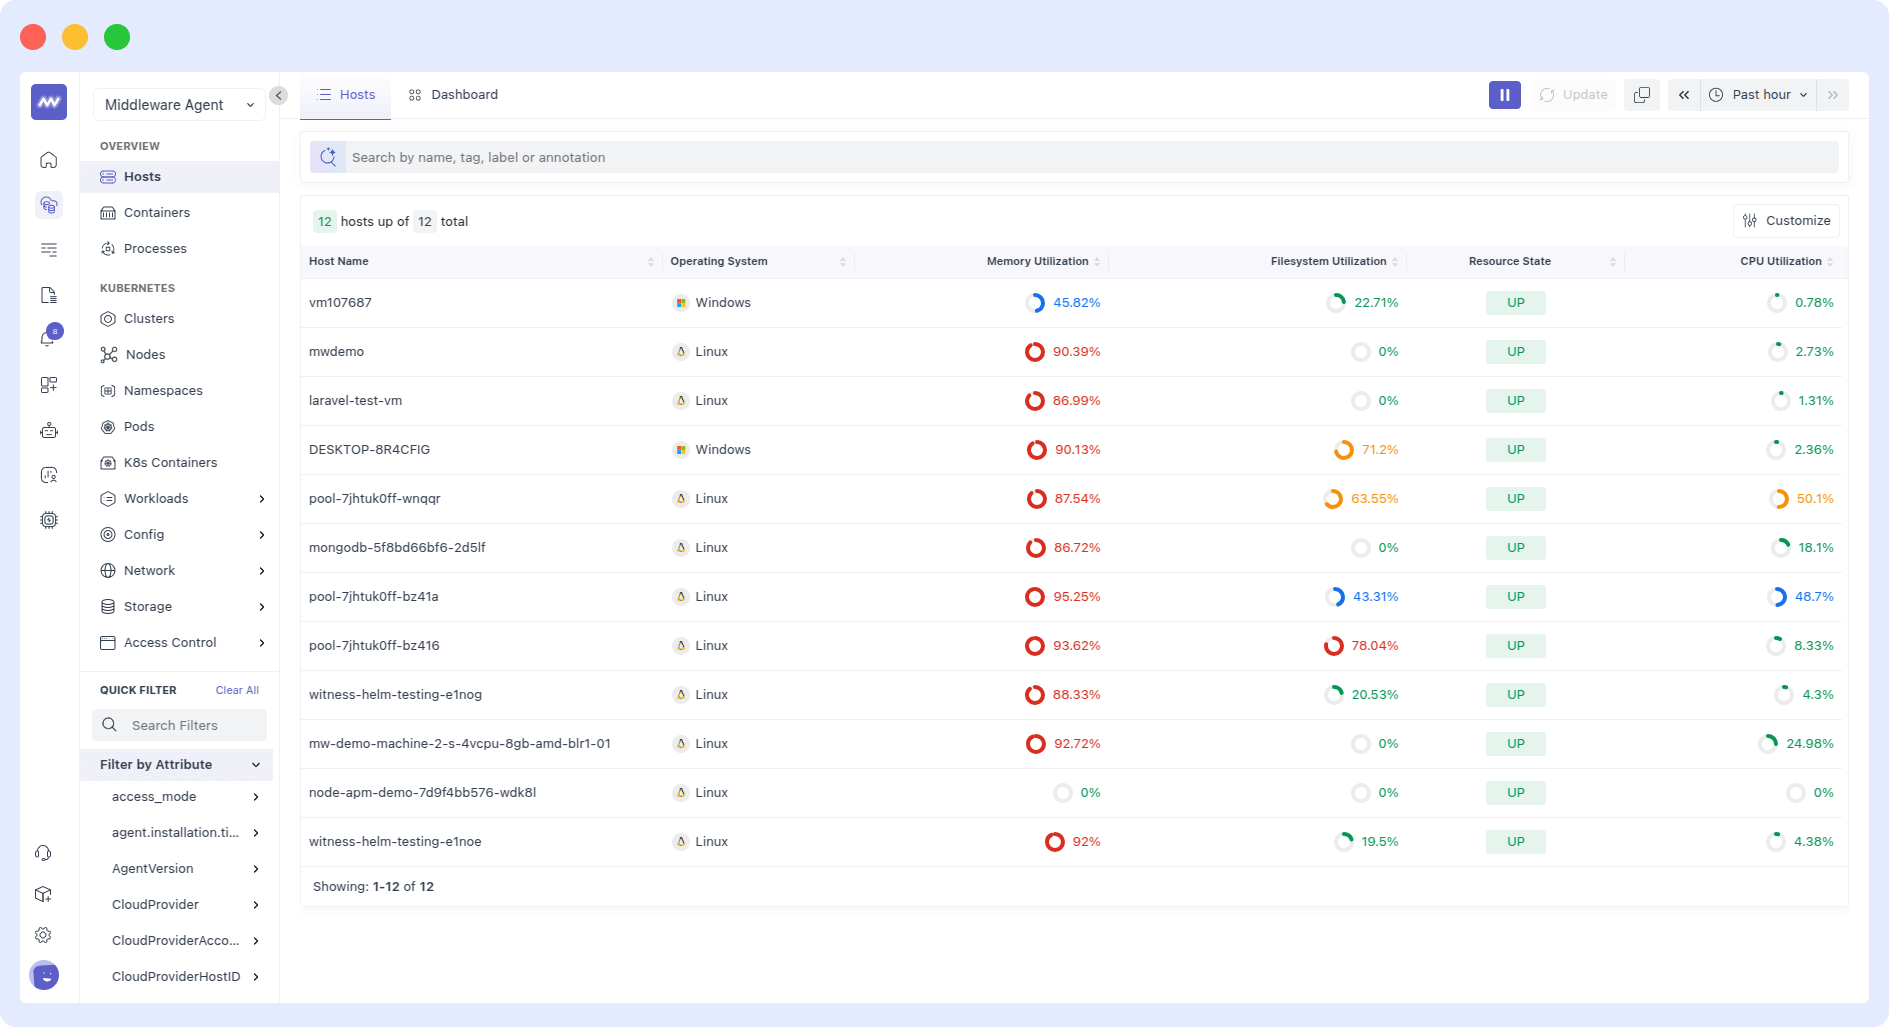
- Advanced infrastructure monitoring features, including auto-detection capabilities, enable users to collect, configure, and visualize complex telemetry data across infrastructures.
- The Middleware Host Agent auto-collects data across your stack to allow real-time analysis of all data points and comprehensive infrastructure monitoring.
- Middleware’s Real User Monitoring (RUM) capability offers detailed user journey visibility for web and mobile applications. It helps track application user experience and resolve performance issues.
Pricing
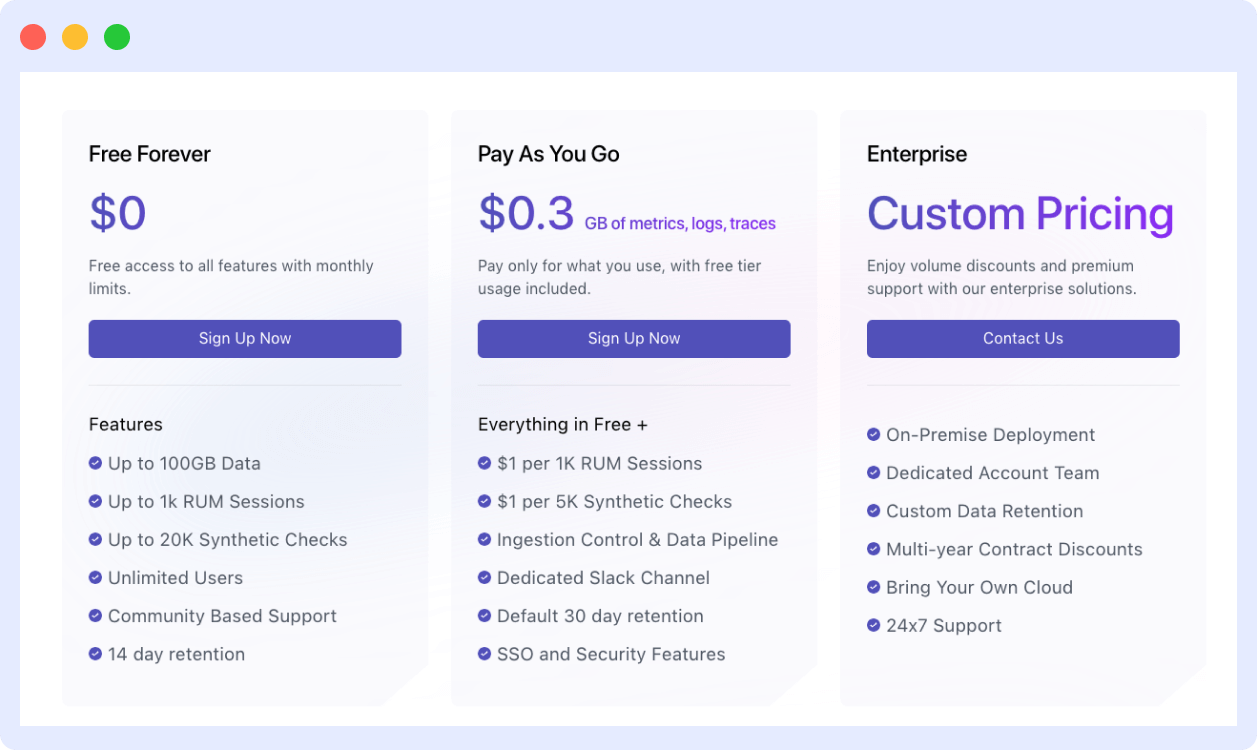
- Free Trial – 14-day free trial with unlimited data ingestion across APM,
- Log and Infrastructure monitoring, RUM, Synthetic monitoring, Database,
- and Serverless monitoring.
- Pay As You Go – $0.30 per GB of metrics, logs, and traces. Features include everything in the Free plan, with additional features like ingestion control and data pipeline, a dedicated Slack channel, and more.
- Middleware also offers bespoke solutions in their enterprise plans.
2. Datadog
Datadog is a cloud-based monitoring, analytics, and security platform that automates infrastructure monitoring, application performance monitoring, and log management.
The data visualization tools in Datadog help users monitor application performance and make improvements as required.
Key features
- Customizable dashboards for real-time data analysis.
- Real-time monitoring features for infrastructure and cloud-based apps.
- Custom alerting for issues in infrastructure, applications, and services.
- Log management capabilities enable aggregating, searching, and analyzing log data.
- Integrations with CI/CD platforms, notification systems, and collaboration tools.
- Automatic anomaly detection with machine learning.
- Cloud security management capabilities like compliance checks, threat detection, real-time risk assessment, etc.
Pricing
- Free: Up to 5 hosts, 1-day metric retention, and standard events and metrics.
- Pro: Starting at $15 per host, per month (billed annually) or $18 on-demand. Includes 15-month metric retention, custom metrics, and alerts.
- Enterprise: Starting at $23 per host, per month (billed annually) or $27 on-demand. Adds advanced features like machine learning-based alerts, live processes, and correlations.
3. SigNoz
SigNoz is an observability tool that helps users monitor applications and troubleshoot.
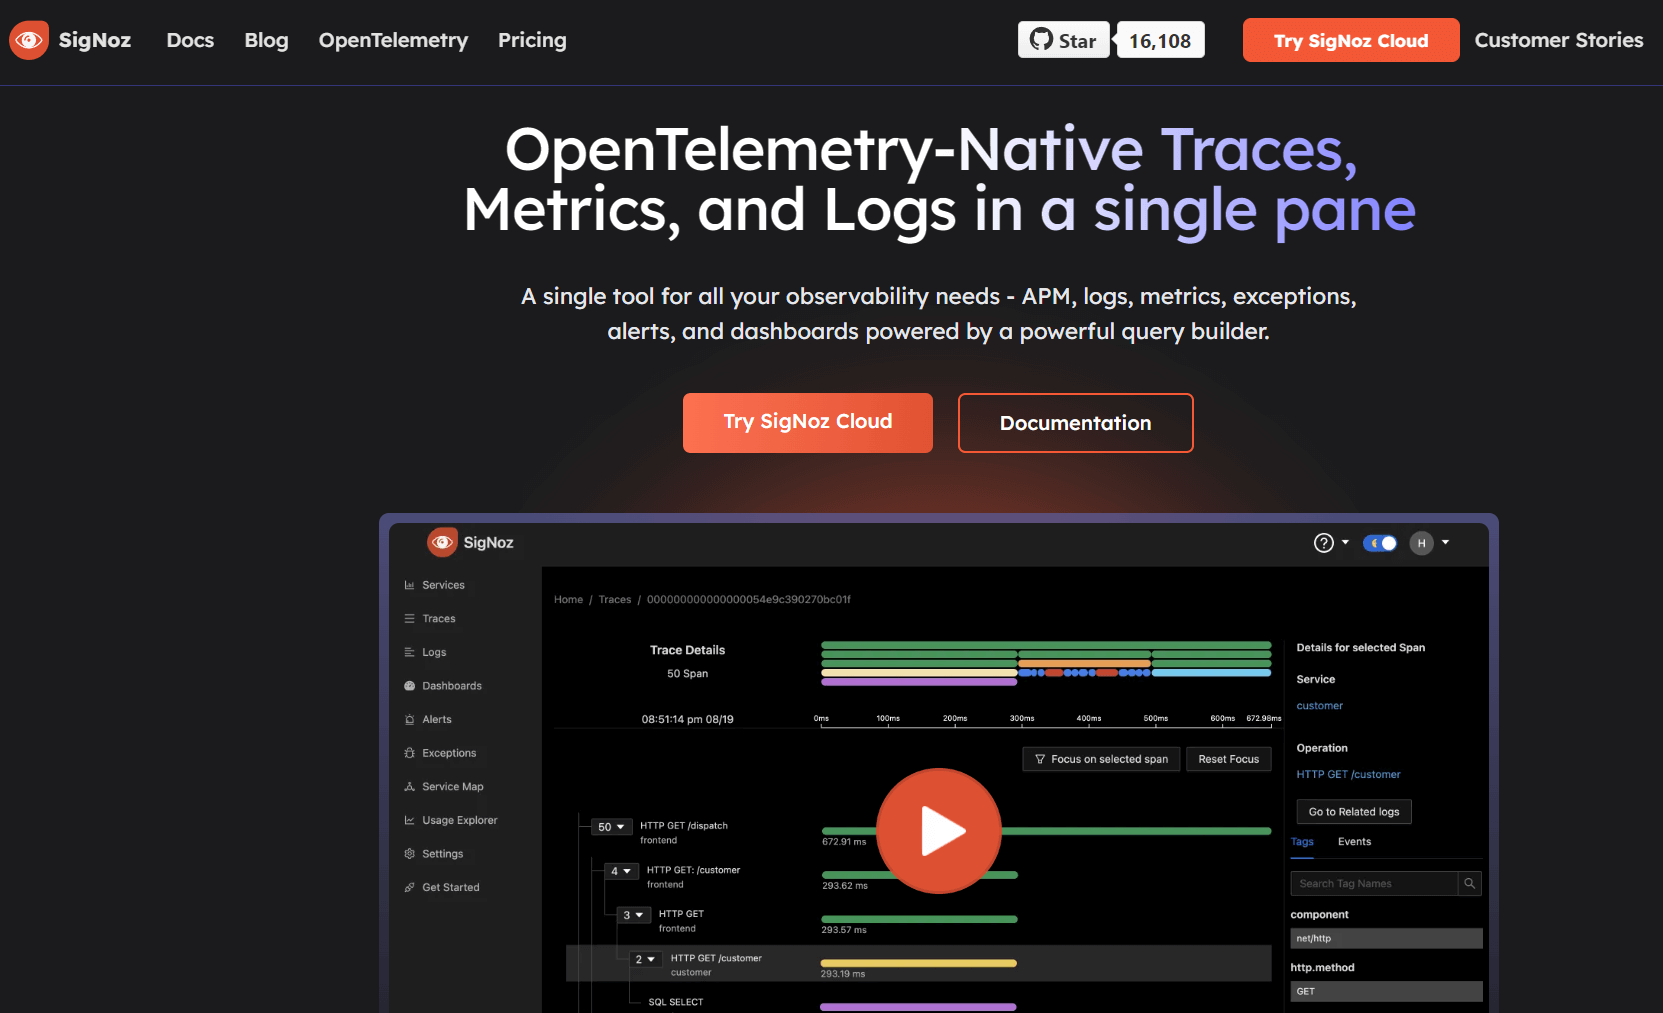
The Grafana alternative offers a tools suite for managing traces, metrics, and logs and a query builder to help you dive deeper into the data.
Key features
- Distributed tracing allows the tracing of requests promoted via distributed channels.
- Real-time data application performance monitoring with database and external call tracking.
- Create and manage dashboards for use cases like external calls, API endpoints, and JVM metrics.
- Customizable alerting system.
- Query builder to support root cause analysis of performance issues.
- Log management capabilities to process, analyze, and store logs.
- Automated exception recording in Ruby, Python, Java, and Javascript.
Pricing
- Teams Plan: Starts at $199/month, with features like APM, distributed tracing, log management, infrastructure monitoring, and more. This plan includes support for up to 100GB of data, 1,000 RUM sessions, and 20,000 synthetic checks.
- Enterprise Plan: Custom pricing for larger organizations, with additional features like advanced security, dedicated support, and custom data retention policies.
- Cloud Offering: Pricing is based on data ingestion volume and retention requirements. You can estimate your monthly costs using their pricing calculator.
- Self-Hosted Option: Free, ideal for smaller teams or individual developers who prefer to manage their own infrastructure.
SigNoz is a free Grafana alternative, know why Middleware is better.
4. New Relic
New Relic is a unified observability platform that offers access to a secure telemetry cloud for all metrics, events, logs, and traces.
The platform offers full-stack analysis tools covering infrastructure, application performance, and user experience.
Key features
- Native OpenTelemetry support for easy telemetry data integration across logs, metrics, and traces.
- AI-powered insights to analyze telemetry data, detect issues, and provide deeper actionable insights.
- Error Inbox enables error tracking and management.
- Custom dashboards for data visualization and analysis.
- Real User Monitoring (RUM) to measure user experience in an application.
Pricing
- Free: Offers 100 GB of free data ingest per month, unlimited basic users, and one free full-platform user.
- Standard: Suitable for small teams, this plan includes limited features and support. Pricing starts at $10 for the first full-platform user, with additional users costing $99 each. Data ingest beyond 100 GB costs $0.35/GB.
- Pro: Designed for larger teams with complex workloads, this plan offers advanced features, commitment options, and priority support. Pricing starts at $349 per user (annual commitment) or $418.80 per user (monthly pay-as-you-go).
- Enterprise: Custom pricing for large-scale organizations with advanced security and support needs. The plan includes additional features like FedRAMP Moderate and HIPAA eligibility.
Additional Costs
- Data Ingest: Beyond the included 100 GB, data ingest costs $0.35/GB (original data option) or $0.55/GB (Data Plus option).
- Compute Capacity: Pricing varies based on computing capacity units (CCUs) consumed.
- Add-ons: Additional features like synthetic monitor checks, extended data retention, and Vulnerability Management are available for an extra cost.
5. Dynatrace
Dynatrace is a unified observability and security platform with amazing application management capabilities.
This Grafana alternative provides insights into app performance, including transaction monitoring, error tracking, and request tracing.
Key features
- AI-powered full-stack monitoring, including visibility into infrastructure, applications, and user experience.
- OneAgent technology to automatically capture deep performance metrics
- Smartscape technology allows application mapping visualization.
- Davis AI engine analyzes dependencies and real-time performance metrics for proactive problem-solving.
- Automated root cause analysis to identify underlying causes of performance issues
- Real user monitoring to capture user interactions.
Pricing
- Full-stack monitoring: $0.08 per hour for an 8 GB host.
- Infrastructure monitoring: $0.04 per hour for any size host.
- Kubernetes monitoring: $0.002 per hour for any size pod.
- Application security: $0.018 per hour for an 8 GB host.
- Real User Monitoring: $0.00225 per session.
- Synthetic monitoring: $0.001 per synthetic request.
- Log management & analytics: $0.20 per GB.management and analytics.
6. Splunk
Splunk’s security and data monitoring features make it a potent alternative to Grafana. The platform helps collect and store extensive data from multiple platforms like databases, messaging systems, and network devices.
This Grafana alternative allows real-time data search and analysis with comprehensive analytics capabilities.
Key features
- Real-time data search and analysis.
- Synthetic monitoring features to track end-user experience.
- Attack analyzer for automatic detection and analysis of complex malware.
- Cloud-powered actionable insights.
- Infrastructure and application system monitoring.
Pricing
- Infrastructure: Starts at $15 per host, per month.
- App & Infra: Starts at $60 per host, per month.
- End-to-End: Starts at $75 per host, per month.
7. Kibana
Kibana is a Grafana open source alternative for real-time data analysis, especially log and events data analysis.
Kibana is the frontend component of the three-pronged Elastic stack (along with Elastic search and Logstash), which is a web-based analytics application for data collection, analysis, and visualization.
Key features
- Custom dashboard creation and sharing tailored to serve specific purposes.
- Alerting and anomaly detection features for application monitoring.
- Integration with Elastic stack that helps ingest, store, analyze, and visualize diverse data types.
- Role-Based Access Control (RBAC) allows administrators to define granular access policies.
- A comprehensive query language for performing an advanced search.
Pricing
- Standard – $95/ month.
- Gold – $109/ month.
- Platinum – $125 per month.
- Enterprise – $175/ month.
8. AppDynamics
AppDynamics is an APM tool that enables users to monitor application performance, pinpoint root causes for performance issues, get complete visibility into application ecosystems, extract real-time data insights, and automatically optimize the application environment.
Key features
- Real-time data analysis and business metrics monitoring.
- Monitoring and optimization across traditional and cloud-native infrastructures.
- Network monitoring features to pinpoint performance issues across third-party networks.
- APM features fix anomalies in real time, manage hybrid environments, and connect with teams on a single platform.
- Smart Agent to simplify application instrumentation through intelligent agent automation and lifecycle management.
Pricing
No pricing transparency.
9. Observable
Observable is a Grafana alternative that enables users to visualize data via charts and dashboards using code.
The platform leverages code snippets to convert complex datasets into clear visualizations to derive actionable insights.
Key features
- Observable code-defined notebooks for interactive, editable documentation.
- Explore, build, analyze, and share data for informed decision-making.
- The observable plot offers a Javascript library for building expressive charts with concise code.
- Integrations with database connectors, APIs, self-hosted database proxies, etc.
- Security features like controlling guest access to keep your data secure.
Pricing
- Starter Plan: This plan is free and ideal for getting started. It includes 100 compute minutes per month, secure hosting and sharing of one data app, scheduled builds, data app analytics, and unlimited notebooks.
- Pro Plan: The Pro plan costs $22 per month per editor when billed annually, or $25 per month when billed monthly. It includes 3,000 compute minutes per month, all the features in the Starter plan, and additional features like unlimited data apps, collaboration, and secure sharing.
- Enterprise Plan: The Enterprise plan offers personalized pricing, 100,000 compute minutes per month, and additional features like private embeds, custom domains, and priority support.
10. Cyclotron
Cyclotron is an open-source Grafana alternative that enables users to create and host web-based dashboards with several data sources, like Elasticsearch, InfluxDB, Graphite, etc.
The platform allows you to query and display metrics regardless of where they are. Load and visualize data without coding.
Key features
- Data visualization features include line graphs, bar charts, heat maps, and more.
- Integration with multiple data sources like Prometheus, InfluxDB, etc., enabling retrieval.
- Tools for transforming and filtering data.
- Custom dashboard and report creation with a drag-and-drop interface.
- Multiple data connectors, including cloud services, APIs, and databases.
Pricing
No pricing transparency.
How to choose the best Grafana alternative?
While several Grafana alternatives are available, choose the tool that fits your business needs perfectly. Here are a few factors to consider when finding the right observability tool for your business.
Open Source vs. Commercial Software
Open-source Grafana alternatives like Kibana offer community support and more customization options. On the contrary, commercial software like Middleware provides robust features for complete cloud visibility and dedicated 24/7 support services.
Ease of use
Consider the Grafana alternative’s user-friendliness to ensure the platform can be used across teams, regardless of their programming or technical knowledge. A user-friendly interface, low learning curve, intuitive tools, and detailed documentation make adopting the platform easier.
Integrations
Assess how well the Grafana alternative integrates with your existing tools stack. For instance, Kibana is best suited for Elasticsearch environments, while Middleware is the most advanced solution for operating and monitoring in Kubernetes environments.
Data handling
Evaluate if the platform can handle large volumes and complex datasets. Choose the platform that works well with high data volumes and complex environments so that it accommodates your business’s evolving needs.
Customization capability
Assess the customization features in each Grafana alternative and check their ability to build custom reports, dashboards, and alerts aligned with your unique business needs.
Scalability
Select a tool that can scale with your dynamic business needs and perform reliably even under multiple loads.
Pricing
While all Grafana alternatives do not offer pricing transparency, go for a flexible pricing structure that fits your budget. Tools like Datadog offer pricing based on data volume or monitoring scope, while Middleware offers a flexible pay-as-you-go pricing structure.
Customer support
Not all Grafana alternatives offer the best customer support. Evaluate customer and community support platforms to ensure seamless setup and operations.
Which Grafana alternative should you choose?
While all 10 Grafana alternatives serve their specific target audience, you should choose the platform that best fits your business needs and budget. Consider the factors to get a tool that aligns with your current needs and supports your long-term goals.
Middleware is one such Grafana alternative that offers robust data monitoring and visualization capabilities at affordable prices. Though it’s commercial, unlike Grafana, its rich feature set accommodates your present and future business needs.
Get started with Middleware for free, or schedule a time for a personalized demo.