Modern systems are not as simple as they used to be. Today, you’re working with microservices, containers, cloud infrastructure, and different tools, generating all kinds of data.
When something breaks, you need more than monitoring; you need a clear view of everything that’s going on. That’s where observability tools come in. They help you track logs, metrics, traces, and performance data. They provide context, enabling you to quickly identify and resolve issues without needing to switch between tools.
Grafana and New Relic are two popular options, but they work in different ways. In this article, we’ll compare both tools to help you figure out which one fits your needs.
Overview of Grafana and New Relic
Grafana is an open-source data analytics and visualization tool. It is primarily used for creating flexible dashboards and can query, visualize, alert on, and understand metrics regardless of where they are stored. Grafana does not store any data sources, but it allows you to connect to several different databases.
If you’d like to have complete control over how your observability stack is constructed as well as how you display your data, Grafana might be the right option for you.
New Relic, on the other hand, is a complete cloud-based observability system. It is a SaaS tool that allows you to collect, view, analyze, and understand the data. To use this tool, you must first install an agent that collects and reports data from your applications, infrastructure, and services.
It’s more or less installed, comes with its pre-built dashboard, creates alerts for you, and employs trails that allow you to analyze or debug an issue quickly. It also integrates with cloud services like AWS, Azure, and Google Cloud.
According to users who switched, Middleware delivers 3× better data correlation and 4× faster troubleshooting compared to Grafana — all with a one‑minute installation.
Grafana vs New Relic: Feature Comparison
| Features | Grafana | New Relic |
| Ease of Setup and Use | Requires manual setup and integrations | Agent-based, quick to set up |
| Visualization and Dashboards | Strong focus on customizable dashboards; drag-and-drop support | Pre-built dashboards, less customization |
| APM | Requires third-party APM tools | Native APM features included |
| Log Management | Works with Loki or other external tools | Built-in log management with search and filtering |
| Alerting & Incident Management | Built-in alerting; incident management handled through external tools | Built-in alerting, incident tracking, and anomaly detection |
| Data Sources & Integration | Supports over 100 data sources, including SQL, Prometheus, and Elasticsearch | Primarily uses its agents; Connects to cloud platforms, services, and popular integrations |
| Customization & Extensibility | Highly extensible with plugins and custom panels. | Less customizable; mostly limited to what the platform provides |
| Machine Learning & AI Features | None built-in; depends on integrations | Built-in AI and ML capabilities |
| Community & Support | Large, active open-source community; commercial support for Cloud/Enterprise | Commercial support and extensive documentation |
| Performance and scalability | Primarily uses its agents; Connects to cloud platforms, services, and popular integrations. | Designed to scale automatically as a cloud platform |
| Pricing | Free open-source version; usage-based for Grafana Cloud | Usage-based pricing with a free tier |
Grafana vs New Relic: Ease of Setup and Use
Grafana requires a more hands-on setup and configuration. You must deploy the Grafana server (either on-premises or using Grafana Cloud), configure data sources such as Prometheus, InfluxDB, or MySQL, and enable authentication.
Some users on Capterra confirm this complexity. However, this complexity comes with flexibility; you can integrate virtually any data source and customize the entire stack to meet your needs.
New Relic prioritizes rapid deployment through its comprehensive SaaS-first approach, featuring guided setup wizards that walk you through agent installation across your entire infrastructure. The platform automatically discovers services, instruments, and applications, and begins collecting data within minutes.
For example, installing the New Relic Java agent requires adding a single JAR file and configuration, and the platform immediately starts tracking application performance without additional setup.
Final Verdict: New Relic stands out for its rapid, agent-based setup, enabling quick monitoring with minimal manual effort. Grafana requires more hands-on configuration.
Smooth setup, real results. MindOrigin onboarded Middleware effortlessly across a complex stack and reduced observability costs by 75%.
👉 See how they did it
Grafana vs New Relic: Visualization and Dashboards
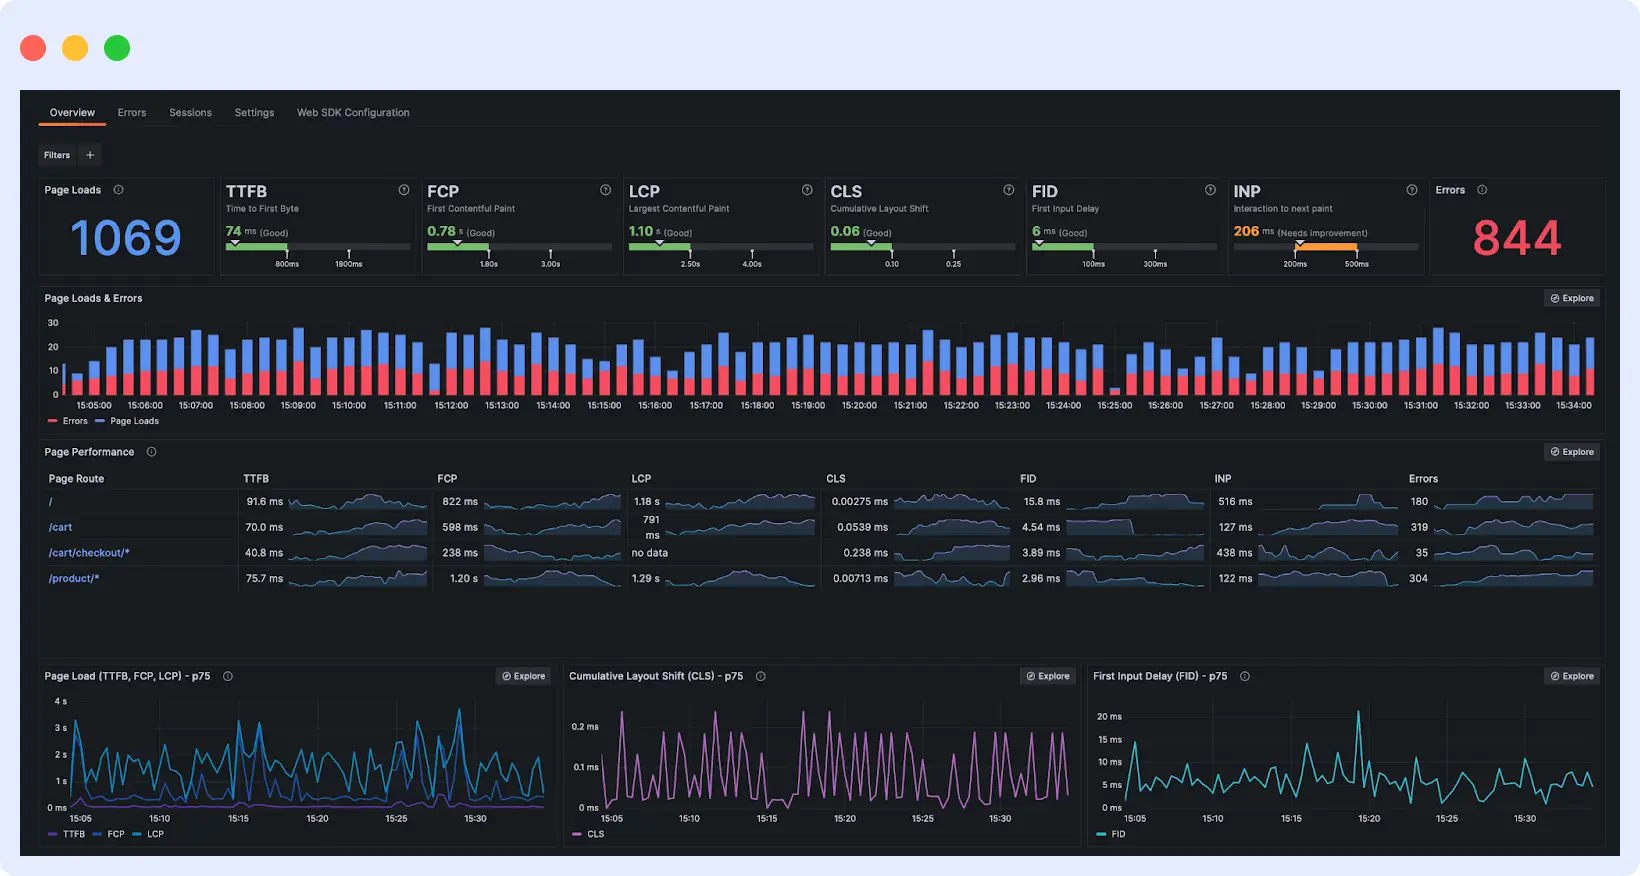
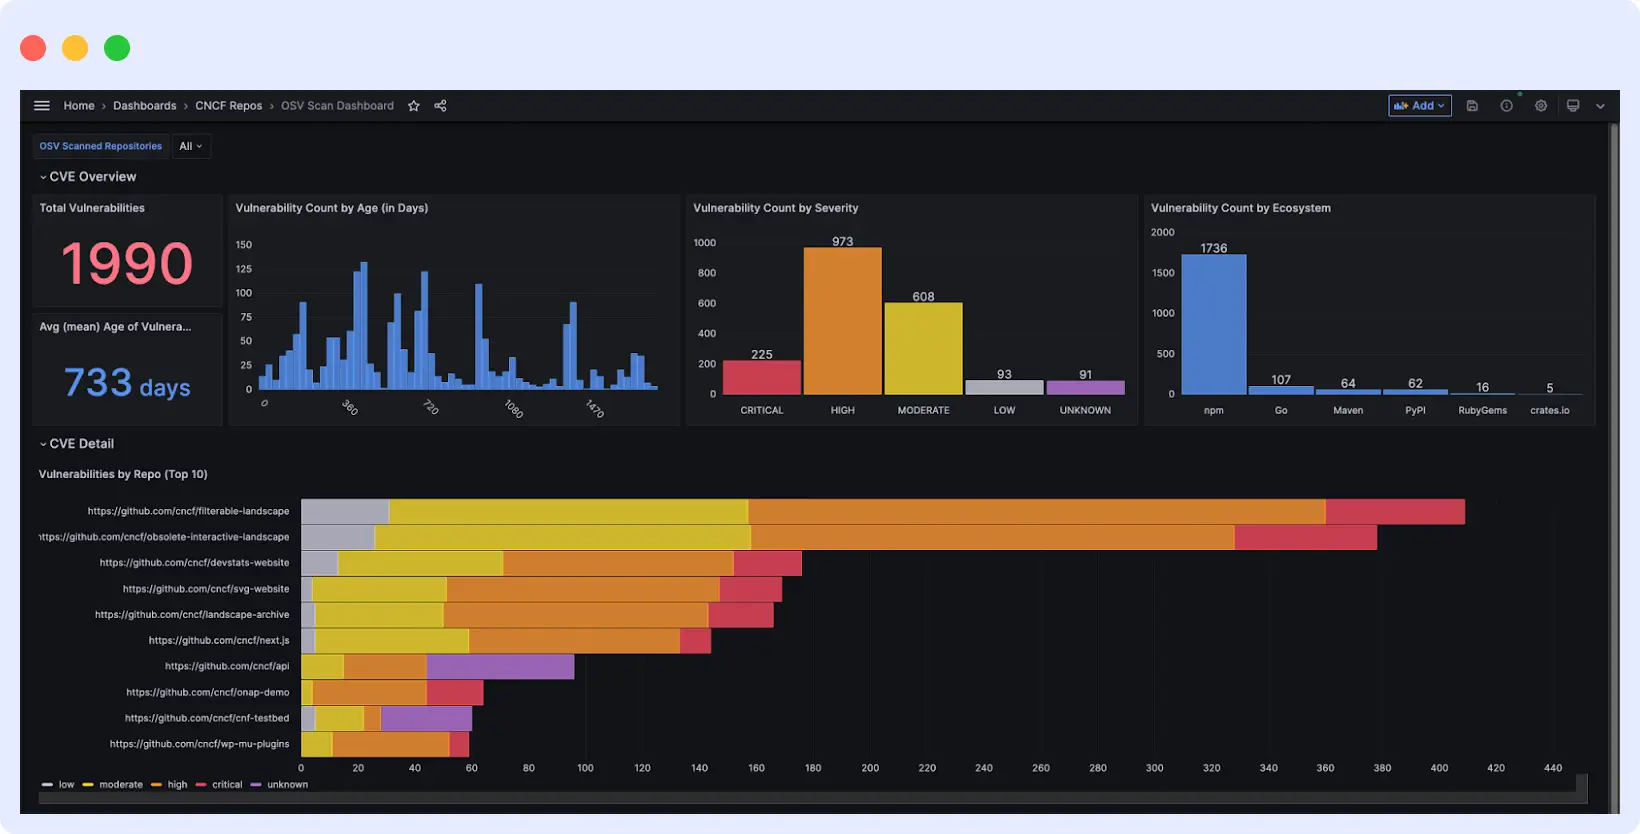
Grafana is highly regarded for its advanced dashboard capabilities. You can create high-powered, multi-panel dashboards with multiple types of charts, including heatmaps, bar charts, and custom views. It is a drag-and-drop editor, allowing panels to be rearranged without requiring code.
The templating feature of Grafana enables the dynamic creation of dashboards, allowing data from multiple data sources to be easily integrated into a view for improved context.
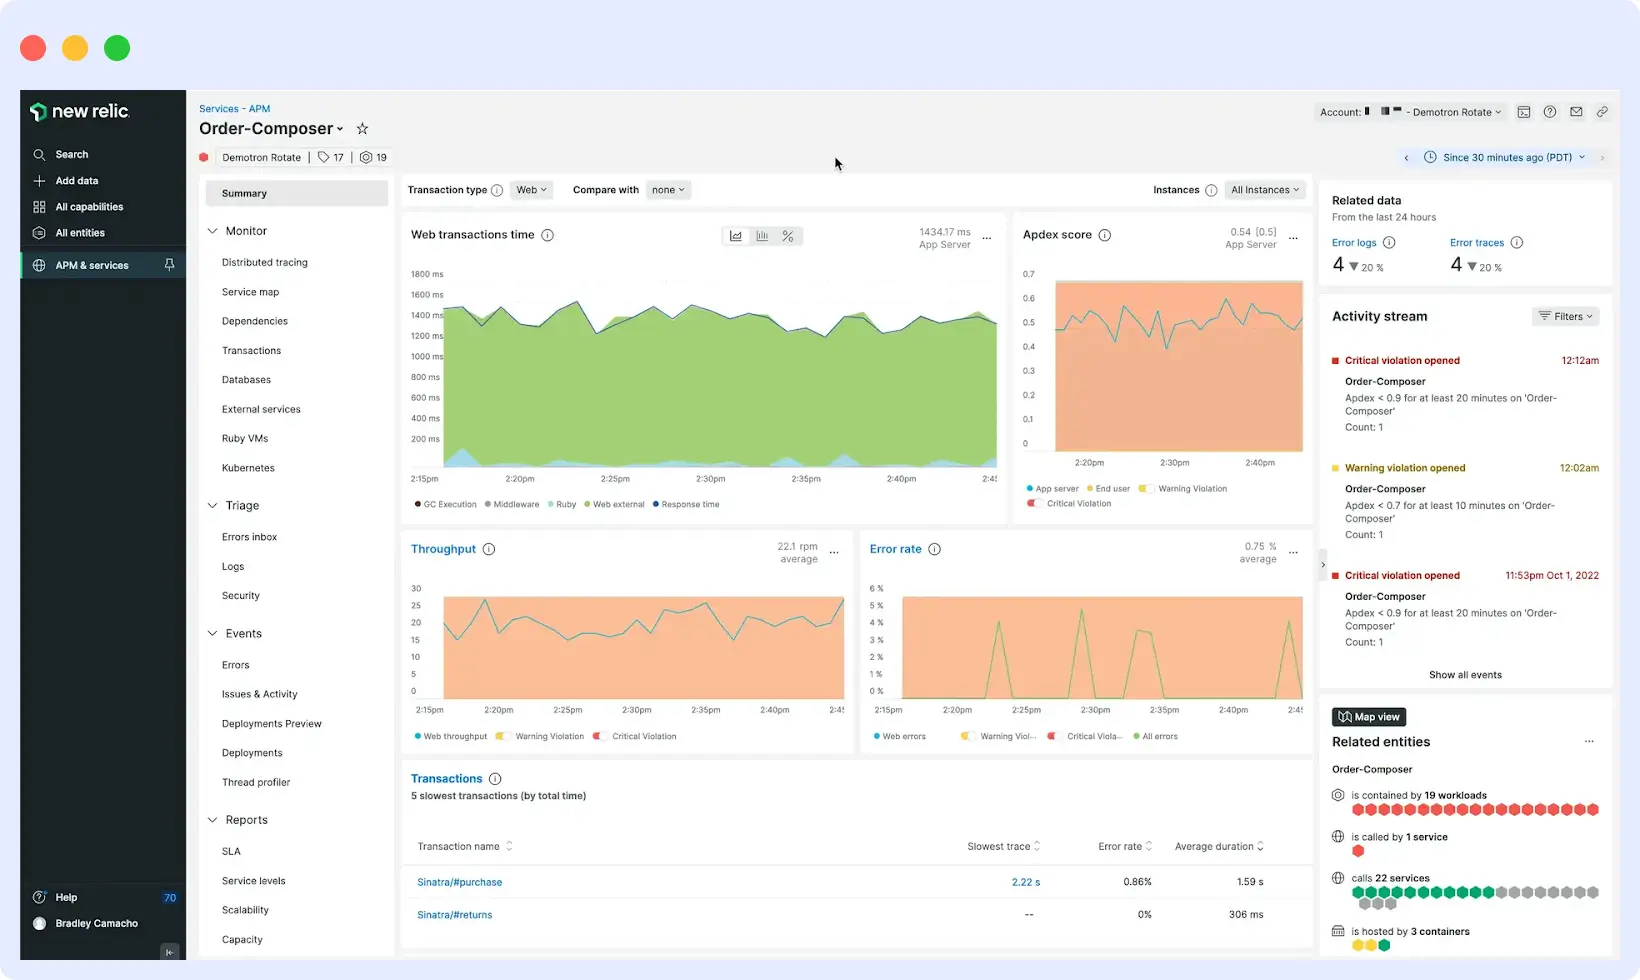
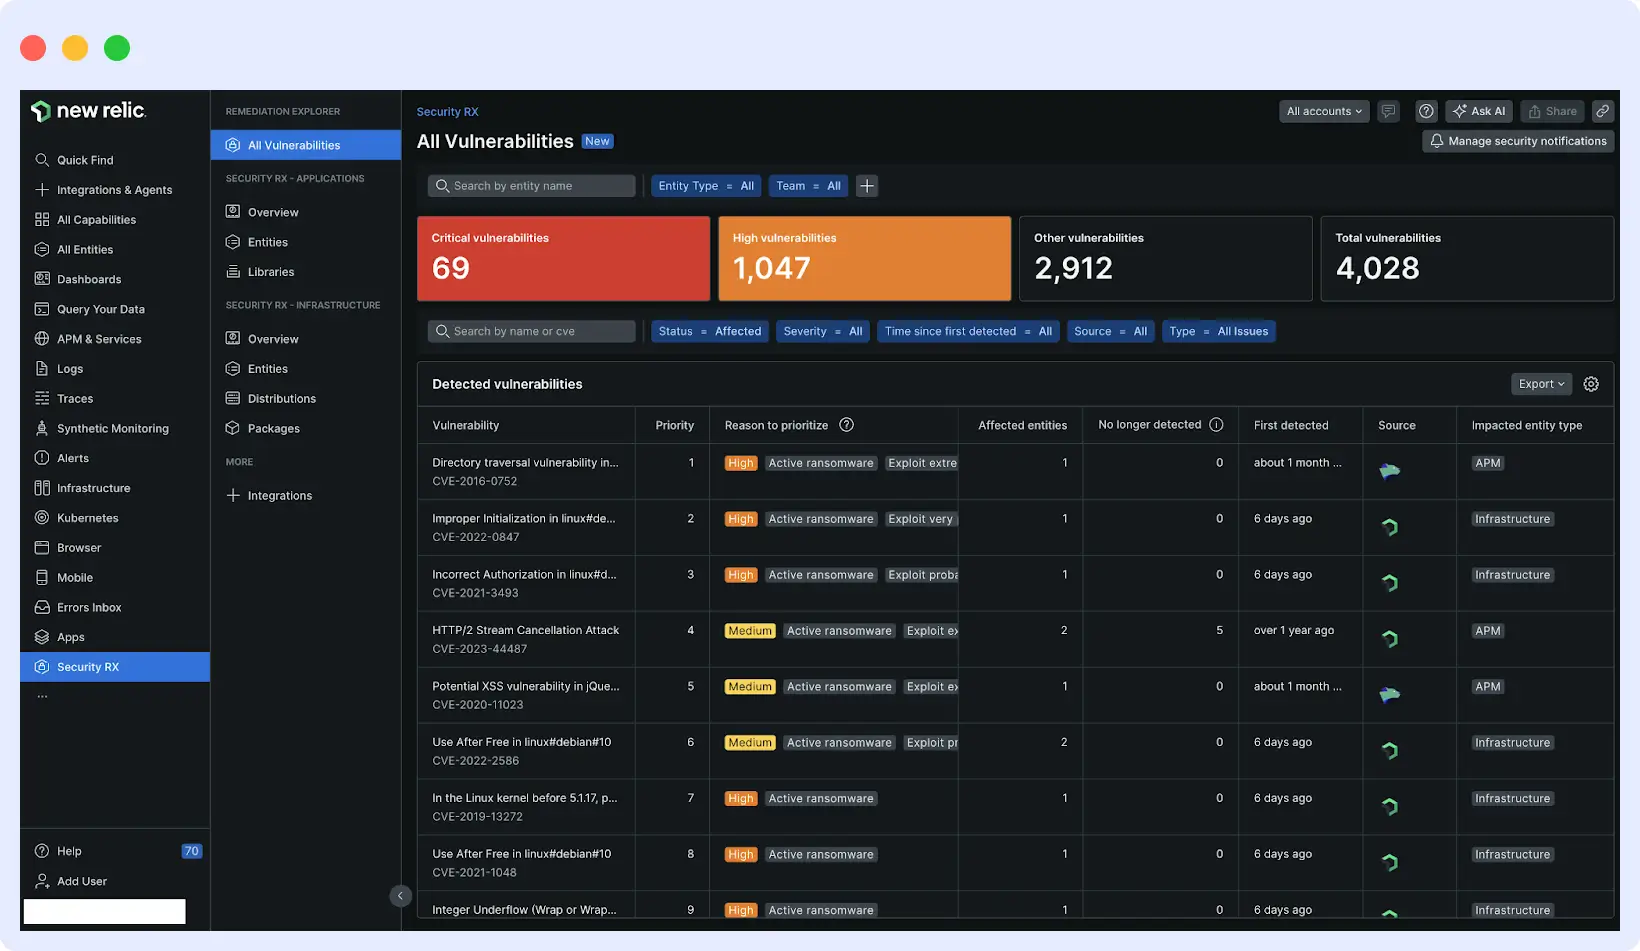
New Relic focuses on simplicity with out-of-the-box, ready-to-use dashboards. The dashboards are populated by default when agents are deployed and include response times, throughput, and error rates. The dashboards are simple, organized, and valuable out of the box. While they can be customized, Grafana offers more flexibility compared to them.
Layout can be customized along with dashboards, but it is less flexible in terms of both visual options and design. However, New Relic adds value with features like service maps and built-in system relationship views.
Final Verdict: Grafana is renowned for its highly customizable and flexible dashboards, providing complete control over data visualization. New Relic offers good pre-built options but lacks in-depth customization.
Grafana vs New Relic: Application Performance Monitoring (APM)
Grafana does not natively support APM. Instead, it supports integration with external agents, such as Prometheus for metrics, Tempo for traces, and Loki for logging. It is possible to aggregate these in a single dashboard, but it falls to you, as a developer or administrator, to configure and set up everything. It allows for flexibility but requires more effort to achieve an end-to-end APM view.
New Relic comes with APM out of the box. Once you install the agent, it begins tracking key metrics, including response times, database queries, error rates, throughput, and external service calls. You also get distributed tracing and detailed transaction breakdowns without needing to piece together different tools.
For most users, this makes New Relic a faster and easier way to monitor application performance.
Final Verdict: For built-in, end-to-end APM visibility, New Relic clearly stands out, offering native transaction tracking and distributed tracing. Grafana requires integrating external APM tools.
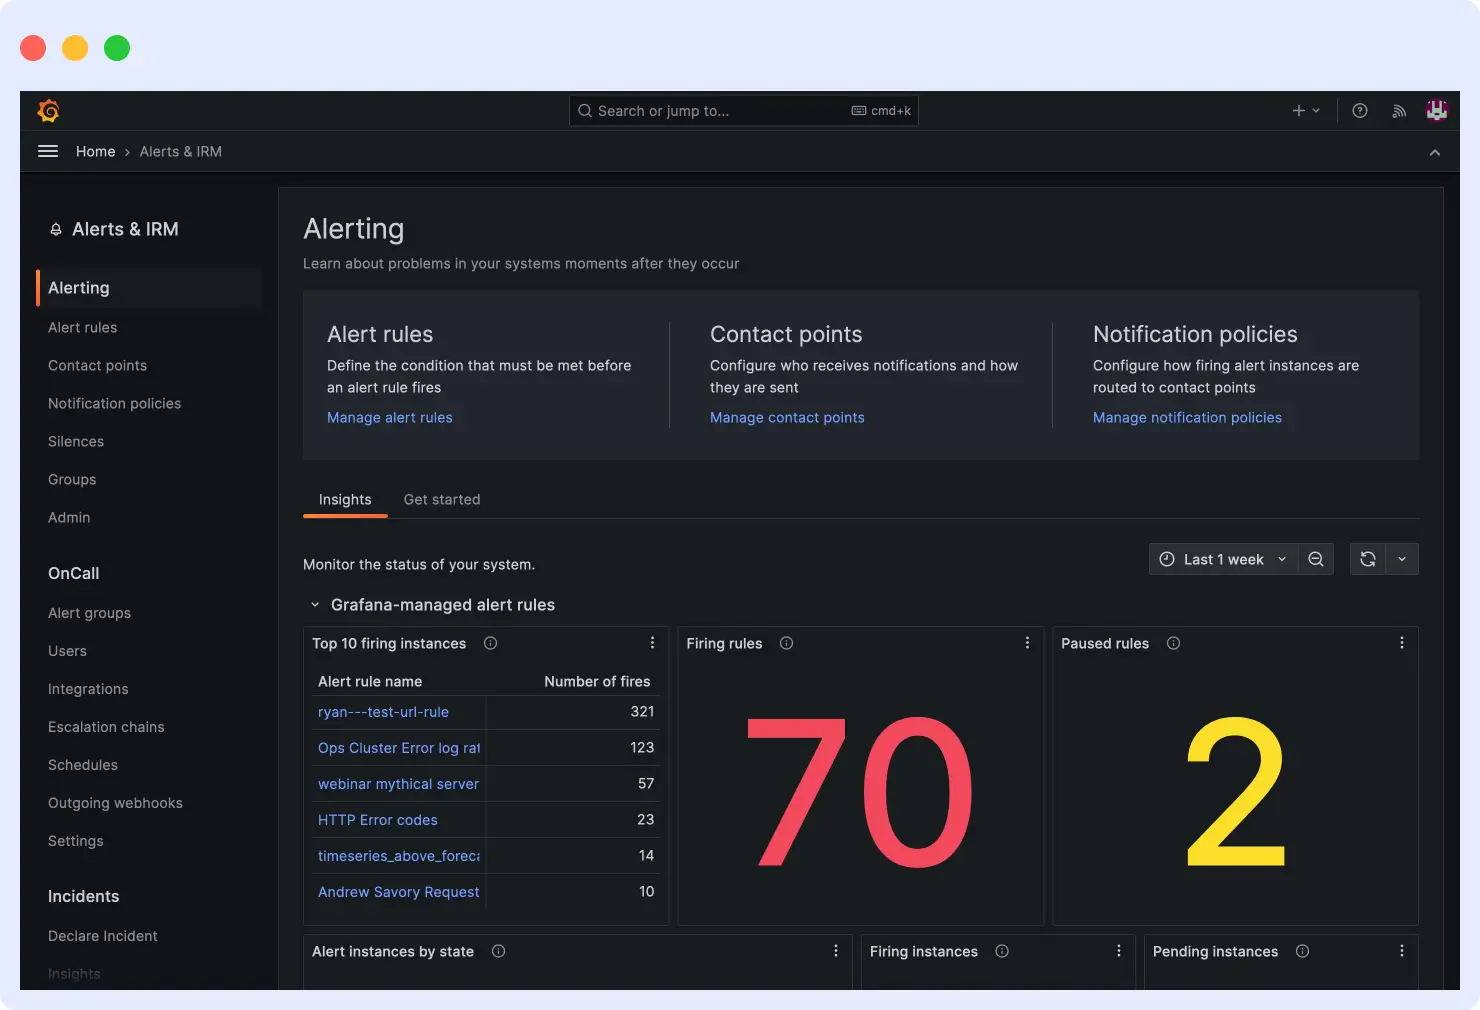
Grafana vs New Relic: Alerting and Incident Management
Grafana includes built-in alerting for creating rules from your data sources using metrics. You can develop thresholds and alert on notifications from Slack, email, PagerDuty, or Opsgenie. If your teams need a more full-featured incident response solution, Grafana Cloud includes a built-in IRM module for Incident Response and Management.
This includes incident tracking, on-call scheduling, and collaboration capabilities for better managing and reviewing incidents.
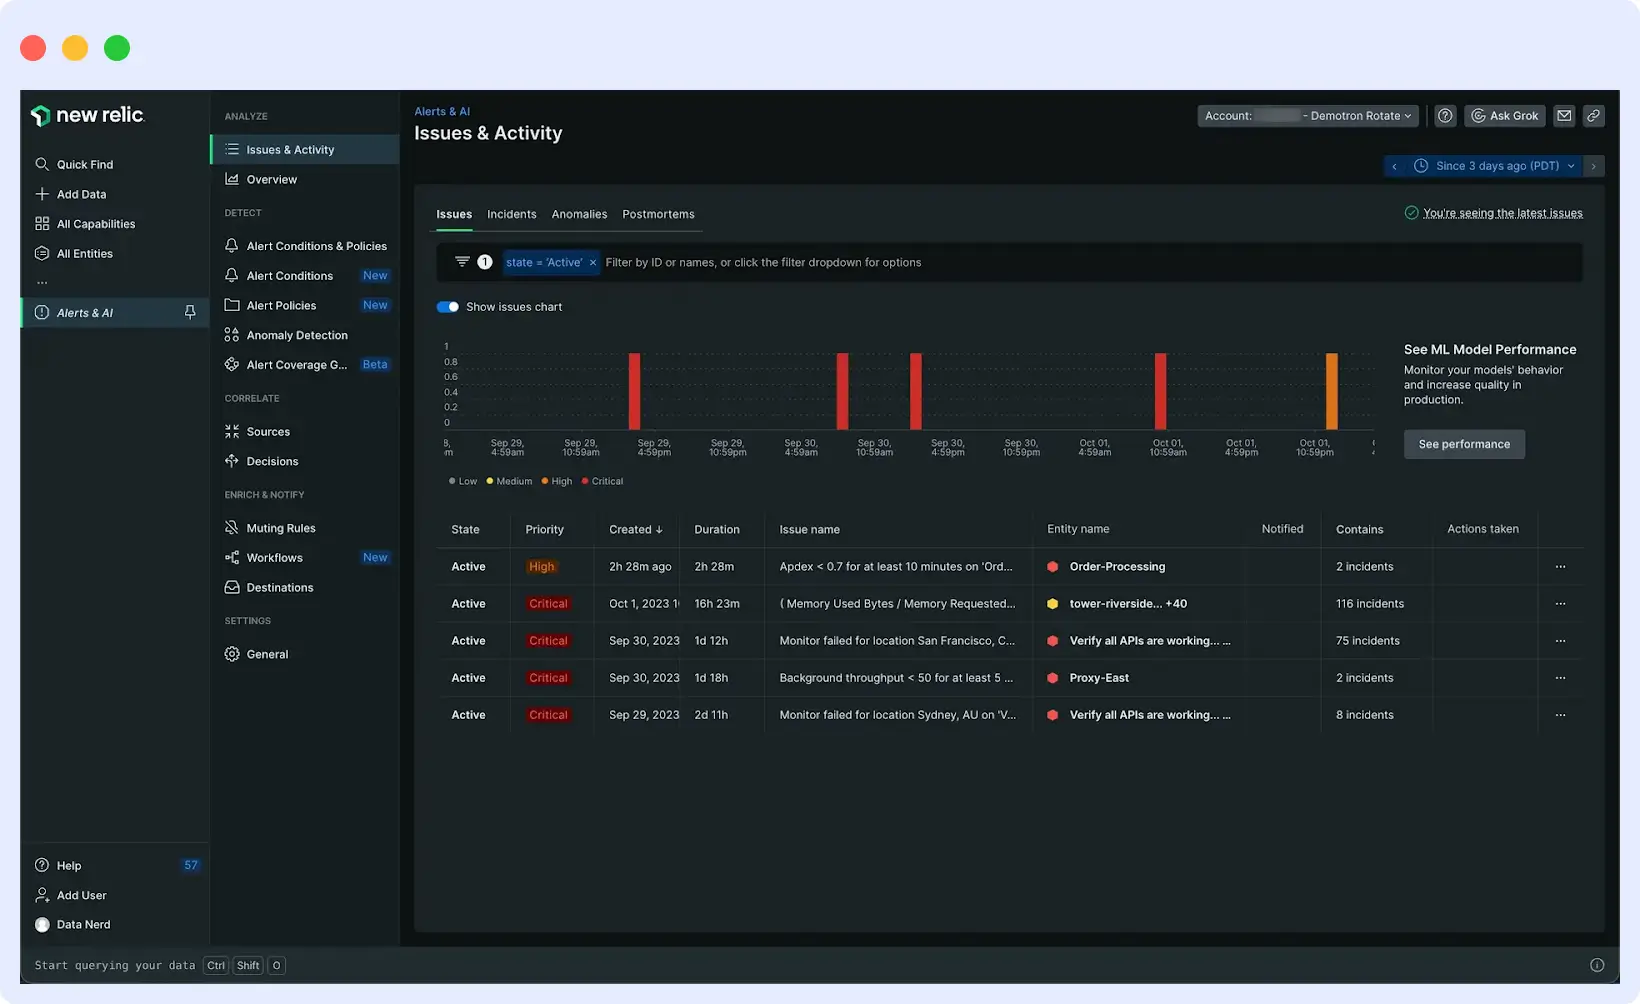
New Relic combines alerting and machine learning, enabling it to detect unusual patterns automatically. It features intelligent alerting, incident correlation, and automated noise reduction, in addition to allowing the teams to focus on real issues.
You can create alert policies, track incident history, and have automated response flows. It even comes with escalation tools and team collaboration tools, so everything needed for discovering and managing incidents is conveniently located in one central place.
Final Verdict: New Relic excels with its intelligent, AI-driven alerting and tightly integrated incident workflows. Grafana provides flexible alerting but relies on external tools for full incident management.
Grafana vs New Relic: Pricing
Grafana Pricing
- Free Open Source Version (self-hosted)
- Free Cloud Tier: Limited to 10k metrics, 100GB logs/traces, and 3 users
- Pro (Pay as you go): Starts at $19/month, with usage-based pricing for metrics, logs, and traces
- Advanced (Premium Bundle): Starts at $299/month, includes more capacity and enterprise features
- Enterprise: Custom pricing – contact sales for tailored options
Grafana is scalable between in-cloud and self-hosted, and it offers a free tier, allowing small teams to experiment and scale usage as needed. That is, there are reports that it is possible, albeit easily, to encounter limitations on the free level, especially with traces and logs, and it is challenging to estimate costs unless careful attention is paid to usage.
New Relic Pricing
- Free Plan: 1 full user with access to the entire platform, up to 100GB/month ingest
- Standard Plan: Includes up to 5 full platform users
- Pro Plan: Unlimited full platform users, access to advanced features
- Enterprise Plan: Includes everything in Pro plus enhanced security, and support
New Relic offers a generous free tier that includes all features for a single user and enough ingest capacity to try out the platform properly. Its pricing is usage-based, which works well for growing teams, but some users caution that costs can rise quickly with high data volumes or a large number of users. Teams often need to monitor and closely track to stay within budget.
NewRelic unethical billing
byu/jaxn indevops
Final Verdict: For cost-conscious teams seeking a free self-hosted option and potential cost control, Grafana is generally more favorable, though cloud costs can vary. New Relic can become expensive at scale.
Grafana vs New Relic: Log Management
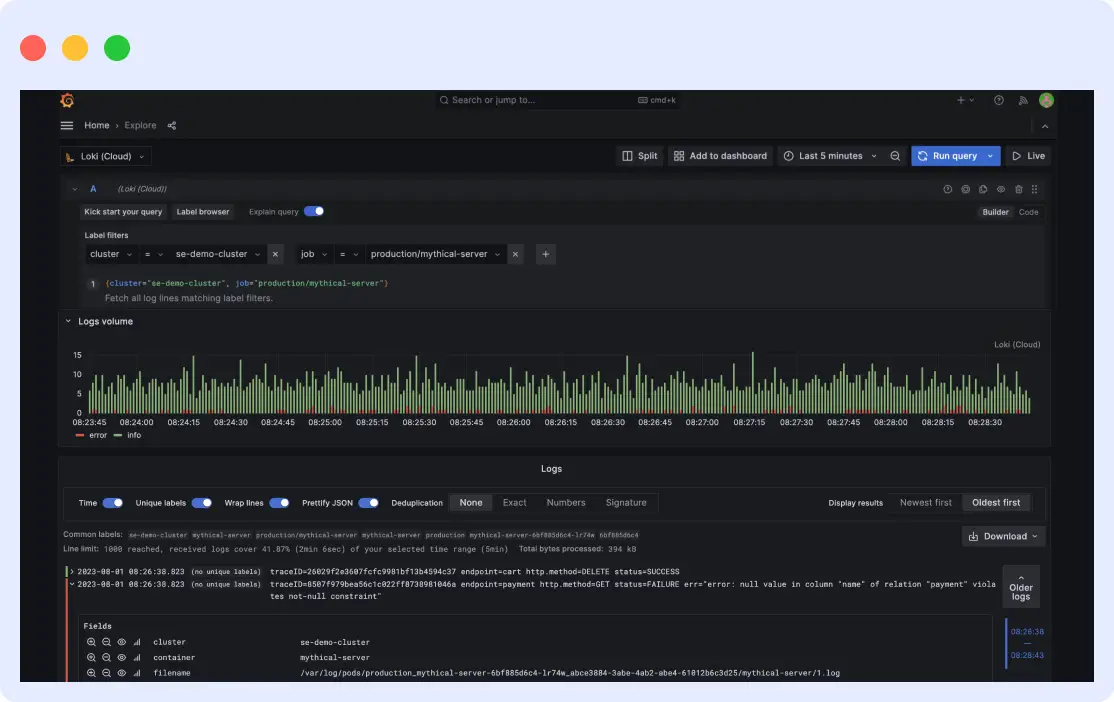
Log management in Grafana is all about being a versatile front-end for log visualization and analysis. It does not store log information but serves as a front end for an external log aggregation system. Its native option is Grafana Loki, which is designed for cost-optimized log storage, but it can also work with other solutions, such as Elasticsearch, Splunk, and others.
You choose and control your backend, and Grafana gives a standard interface for querying, visualizing, and correlating your log information, along with metrics and traces, using the Explore feature. This setup offers a lot of flexibility but also requires you to handle the backend configuration and maintenance.
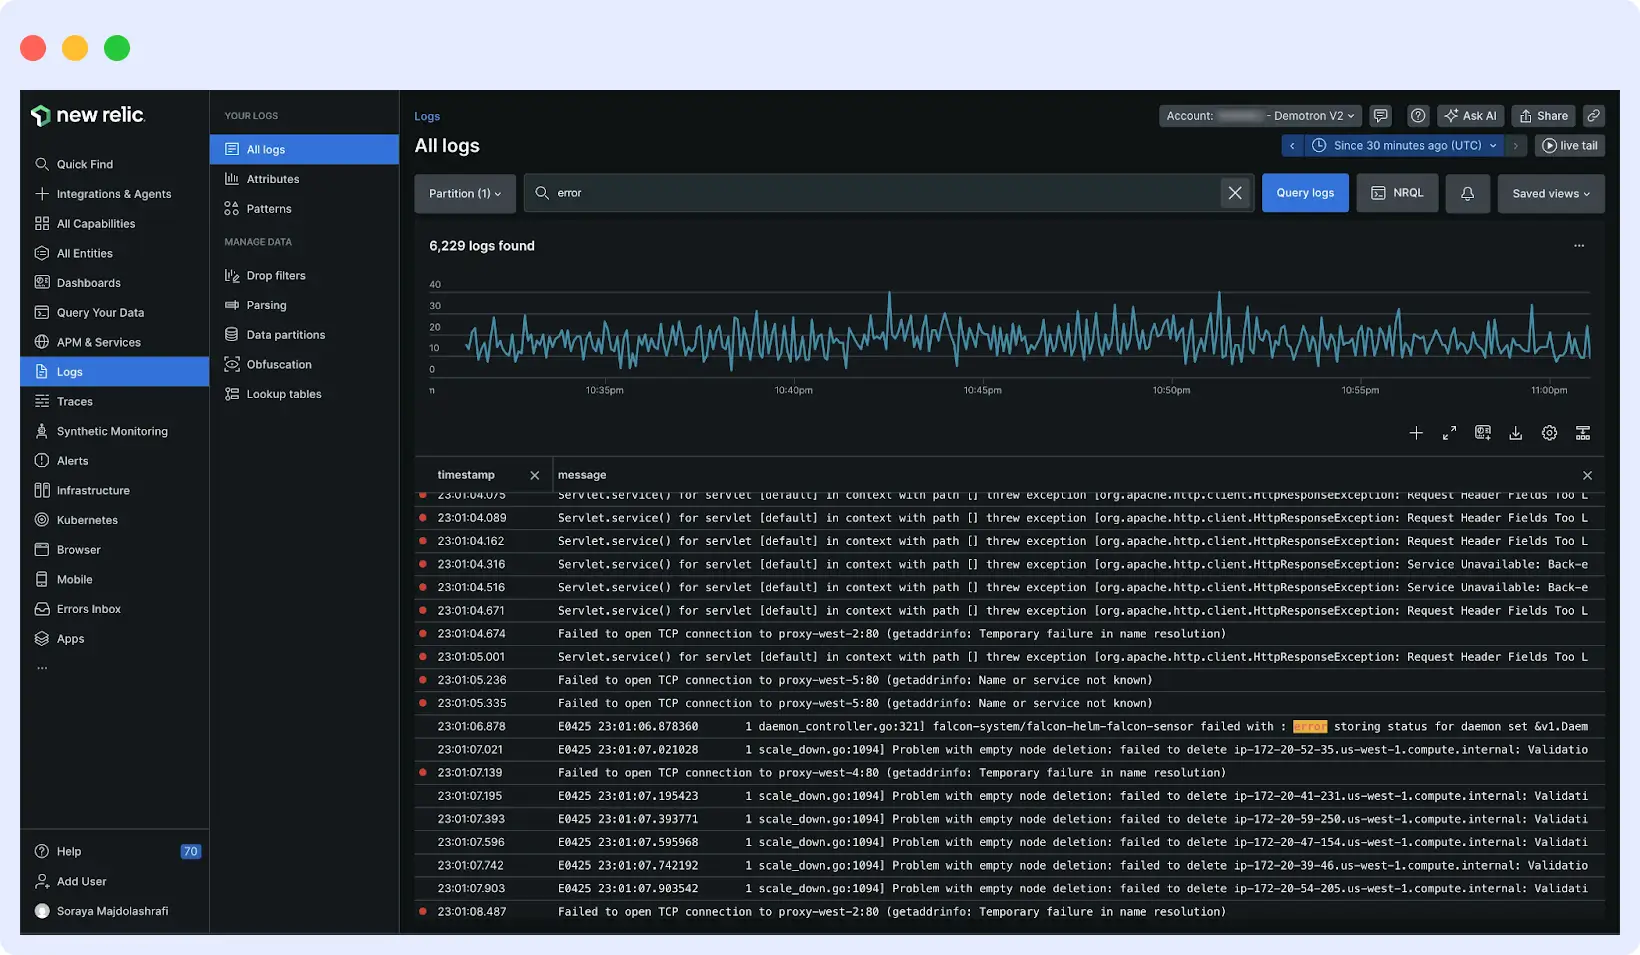
New Relic is more complete in its log management. It includes built-in log collection, storage, and querying tools as part of its observability platform. Logs can be gathered with a variety of agents, including for infrastructure and APM, syslog, or API, so that you can pull in data from almost any type of source.
Once collected, stored, and indexed by NRQL (New Relic’s query language), it is easily searchable. Since all of it is handled in a central system, it makes it much simpler to find and analyze log data.
Final Verdict: For a unified approach to log collection, storage, and analysis without managing infrastructure, New Relic stands out. Grafana acts as a front-end for external log sources.
Grafana vs New Relic: Data Sources & Integration
There are over 100 officially supported data source plugins for Grafana. The well-known ones include Prometheus, InfluxDB, MySQL, PostgreSQL, Elasticsearch, AWS CloudWatch, Google Cloud Monitoring, and Azure Monitor. You are allowed to have multiple sources in a dashboard, which provides a great deal of control over your setup. The drawback is that all of your setup and administration of each relationship must be handled manually.
New Relic is a part of the Instant Observability family, which has more than 700 out-of-the-box integrations. These cover a multitude of cloud services, infrastructure tools, and third-party solutions like AWS, Azure, Kubernetes, Jenkins, and Prometheus. New Relic utilizes agents that automatically transmit data to the platform. This reduces the effort required for connecting new sources, as well as making out-of-the-box monitoring easier.
Final Verdict: Grafana is superior due to its vast flexibility, which allows it to connect to over 100 diverse data sources. New Relic offers many integrations, primarily through its agents.
Grafana vs New Relic: Customization & Extensibility
Grafana is an open-source platform well-known for its highly customizable functionality. You can design dashboards from scratch, create custom panels, make UI customizations, and even fork software when needed.
Its API can construct dashboards programmatically, and numerous community plugins provide support for additional data sources and visualizations. Role-based access control and advanced authentication in its enterprise edition give even more power for large teams.
This level of customizability is what makes Grafana appealing to businesses with specialized observability needs or in-house flows that cannot be easily integrated into pre-built templates. It does, however, have a learning curve. Many PeerSpot users report that setup is long and requires expertise, especially for customized dashboard setup or alert template setup. Some also believe documentation should be easier.
New Relic, on the other hand, offers customization in a managed SaaS environment. While it is not possible to modify the platform directly, dashboards can be built, alerts can be configured, and custom views can be created using its visual UI. The platform also offers APIs for automated tasks, as well as for embedding into a CI/CD pipeline.
Nerdpacks, in particular, is a unique feature that allows developers to create custom apps and visualizations running within the New Relic UI. This will enable team flexibility without having to self-host or maintain any infrastructure.
Final Verdict: For deep, full-stack customization and control through open-source extensibility and plugins, Grafana is the top choice. New Relic offers customization within a managed environment.
Grafana vs New Relic: Data Ingestion & Transformation
Grafana does not store or collect data internally. It directly connects to external data sources, such as Prometheus, InfluxDB, Elasticsearch, and others. Data transformation and collection are handled by external data sources themselves. Grafana only deals with querying and rendering data in real time.
Because of this setup, data transformation typically occurs in data sources or even before the data reaches Grafana. Users extend Grafana by using plugins or advanced querying to modify data as it appears on dashboards, but the platform does not process or enrich data on inbound data.
New Relic, on the other hand, manages data ingestion and transformation internally. After agents are in place, they automatically gather data from your apps, infrastructure, and external services. You can even send custom events and metrics with its APIs.
New Relic’s Telemetry Data Platform enables teams to filter, enrich, and transform data as it comes in. Features such as log parsing rules, event filtering, and attribute enrichment would allow teams to have more control over what data is retained and graphed, without requiring a distinct pipeline.
Final Verdict: New Relic stands out for its effective data ingestion management and in-platform filtering and transformation capabilities. Grafana displays data but doesn’t natively process or transform it.
Grafana vs New Relic: Community & Support
Grafana is very well-supported by a large open-source community. There are forums, GitHub chat rooms, community plugins, and tutorials contributed by users. If you’re using the open-source version, your support will mostly come from this community.
For teams that want more structured help, Grafana Labs offers commercial support through Grafana Cloud and Enterprise plans.
New Relic, being a commercial platform, enjoys more direct support. That includes a knowledge base, in-app support chat, guided setup wizards, and professional support tiers with your subscription. It also contains an active community forum and resources, such as New Relic University, for onboarding and upskilling.
The community is smaller than for Grafana, but the quality and consistency of official support are generally better.
Final Verdict: Grafana benefits from a large, active open-source community and extensive plugin ecosystem. New Relic offers structured commercial support.
Grafana vs New Relic: Machine Learning and AI Features
Grafana does not include built-in machine learning or AI features. It relies on integrations with other tools for advanced analytics or predictive insights. For example, you could connect it with tools like Prometheus or external data science platforms, but you’ll be doing most of the heavy lifting yourself.
This gives you the freedom to use whatever tool fits your use case, but it also means setting up and maintaining those connections on your own.
New Relic, on the other hand, includes machine learning capabilities directly within the platform. It utilizes AI to detect anomalies automatically, surface unusual behavior in your systems, and aid in root cause analysis. The system learns from your data patterns over time and can trigger alerts when something looks off, even if it wasn’t part of a predefined rule. This helps teams identify issues more quickly, especially in large and complex environments where manual tracking isn’t always practical.
Final Verdict: New Relic offers built-in AI/ML capabilities for anomaly detection and incident analysis, providing intelligent monitoring without additional setup. Grafana requires integrating external AI tools.
Grafana vs New Relic: Security
Grafana offers several key security features, particularly in its cloud and enterprise plans. These include role-based access control (RBAC), single sign-on (SSO) through SAML and OAuth, encryption of data at rest and in transit, audit logs, and detailed user permission settings. If you’re self-hosting Grafana, you’ll need to set up and manage these security features yourself. While this gives you more control, it also means extra work.
New Relic takes care of most security tasks for you as part of its managed platform. It offers strong data protection through encryption, SSO, audit logs, and RBAC. It also meets enterprise security standards, such as SOC 2 Type II. In addition to these features, New Relic includes IAST (Interactive Application Security Testing), which helps detect vulnerabilities in running applications in real time.
Final Verdict: New Relic stands out with built-in enterprise-grade security, minimal compliance overhead in a managed service. Grafana also offers strong security features, but self-hosted deployments require manual management.
Use cases: When to Use Grafana vs New Relic
Now that you’ve explored the nuanced differences between Grafana and New Relic, the question remains: which one is right for your specific needs? The answer isn’t about one being universally “better,” but rather about aligning each tool’s core strengths with your organizational priorities and budget
Choose Grafana If:
- You want a customizable, open-source observability stack.
- You already use diverse tools, such as Prometheus, Loki, or SQL databases.
- You need flexible, fully custom dashboards and visualizations.
- You prioritize cost control with self-hosting and pay-as-you-go options.
- You handle APM through external tools and need a powerful front-end.
- You prefer control over infrastructure, data sources, and setup.
- You rely on a strong open-source community for support and plugins.
Choose New Relic If:
- You want a managed, all-in-one SaaS platform with minimal setup.
- You need a built-in APM with detailed tracing and performance insights.
- You rely on AI to detect anomalies and reduce alert noise.
- You want fast deployment with agent-based setup and instant integrations.
- You prefer integrated log collection and analysis in one place.
- You need strong, enterprise-ready security and compliance.
- You value convenience and a polished experience over full customization.
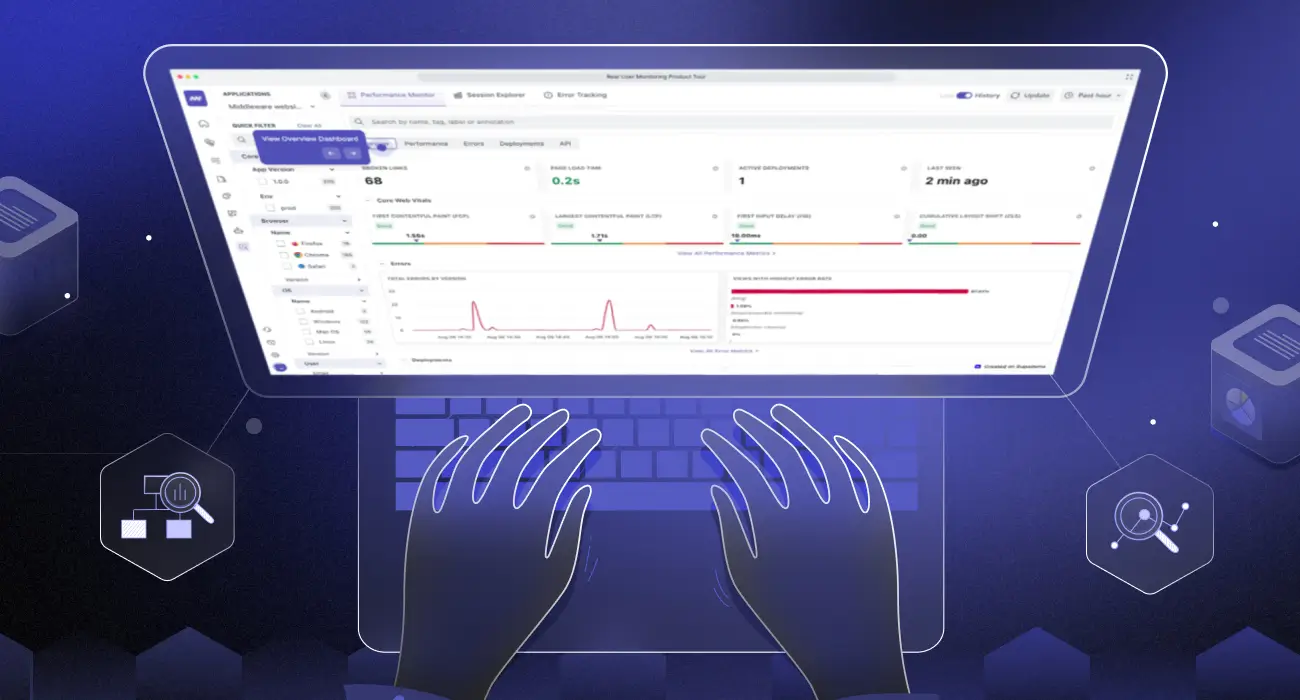
A better alternative to Grafana and New Relic: Middleware
While Grafana and New Relic lead many observability discussions, Middleware is a real-time observability platform designed for cloud-native, microservices, and distributed applications. It consolidates your metrics, logs, traces, and events into a single, unified timeline.
Unlike Grafana’s build-it-yourself model or New Relic’s complex pricing structure, Middleware gives you complete visibility into your tech stack in one place. It includes application performance monitoring, log management, infrastructure monitoring, and distributed tracing.
Key features of Middleware include:
- Custom dashboards: Just like Grafana, you can fully customize dashboards, widgets, and visualizations to suit your team’s needs.
- Integrated APM and RUM: Monitor application performance with built-in tracing, error tracking, and real user monitoring. Service maps and detailed performance views are included by default.
- Unified telemetry: View logs, metrics, traces, and events together in a single timeline to quickly identify and resolve issues.
- Real-time alerts and incident timelines: Receive alerts linked to context-rich timelines, enabling your team to troubleshoot more efficiently.
- Scalability: Middleware supports growing infrastructure without losing visibility or slowing down performance.
Middleware combines the customization power of Grafana with the all-in-one capability of New Relic, without the operational burden or cost challenges. It is built for teams that want fast setup, strong insights, and complete control over their observability.