Prometheus is a powerful open-source tool widely used for collecting, storing, and analyzing metrics as part of the Prometheus architecture in modern cloud-native environments.
It is an important aspect of modern observability technologies since it offers a scalable, pull-based data collection technique as part of the Prometheus architecture. It easily interfaces with cloud services like AWS, GCP, and third-party visualization tools like Grafana and Kubernetes for cluster monitoring.
For Site Reliability Engineers (SREs) and DevOps teams, Prometheus enables proactive monitoring and rapid troubleshooting across orchestration tools and visualization platforms like Grafana. It enhances visibility into system performance, reliability, and health, which supports critical decision-making in dynamic environments.
Prometheus offers several key features that make it an effective monitoring solution:
- It uses a pull-based metrics collection method, where data is gathered from HTTP endpoints at regular intervals, ensuring efficient and timely updates.
- It uses a multi-dimensional model with labels for flexible, precise analysis.
- Prometheus uses PromQL as its query language, which makes it simple for users to filter and query large data sets to get the information they require.
- Teams can receive messages based on predetermined criteria thanks to its integrated alerting system, which Alertmanager drives.
How Prometheus Works: Core Components and Process
Prometheus is designed for efficient monitoring, with core components working together in four main steps: data collection, storage, querying, and alerting.
How Prometheus collects metrics: It pulls data from applications, databases, Linux hosts, and containers, stores them in its time-series database (TSDB), and serves data via an HTTP server.
It integrates with service discovery tools like Kubernetes, and Consul sends alerts to the Alert Manager, which forwards them to platforms like Email, Slack, and PagerDuty. Data can be queried using the Web UI, PromLens, or Grafana, and forwarded to remote or local storage for long-term retention.

Prometheus Server
The core of Prometheus monitoring is the Prometheus server, which is responsible for gathering, storing, and querying metrics. It uses a pull-based approach, collecting data from predefined HTTP endpoints exposed by exporters or applications.
Internally, the Prometheus server is composed of three key components:
- Data Retriever: Continuously scrapes metrics from target endpoints using HTTP requests. It operates on a scheduled interval, ensuring real-time data collection from services, applications, and infrastructure components.
- TSDB (Time Series Database): A high performance database designed to store time-stamped metrics efficiently. It handles data compression, retention policies, and indexing to support fast and accurate query responses.
- HTTP Server: Exposes a RESTful API and a built-in web UI for interacting with Prometheus. It allows users to execute queries using PromQL, retrieve metrics, monitor system health, and visualize time-series data.
Metrics Data Collection
Collects metrics by periodically scraping HTTP endpoints that expose data in a format Prometheus can understand. These endpoints are typically provided by exporters or instrumented applications that gather relevant data from various sources.
The process involves querying these endpoints at specified intervals to retrieve the latest metrics.
For example, the Node Exporter collects system metrics like CPU, memory, and disk usage. The JMX Exporter exposes Java application metrics via the JMX interface, while the StatsD Exporter bridges StatsD metrics such as counters and timers to Prometheus. This modular setup allows Prometheus to collect diverse application and system data for comprehensive monitoring.
Data Storage
Prometheus stores collected metrics as time-series data in its custom storage engine, designed for efficient querying and analysis. Each time series consists of a metric name, associated labels (key-value pairs), timestamps, and values, enabling fast filtering and aggregation.
For example, a metric for CPU usage might be stored as `cpu_usage_seconds_total{instance="server1", job="node_exporter"},` where `cpu_usage_seconds_total` is the metric name, and the labels specify the instance and job. This structure allows Prometheus to efficiently retrieve and analyze metrics across large datasets.
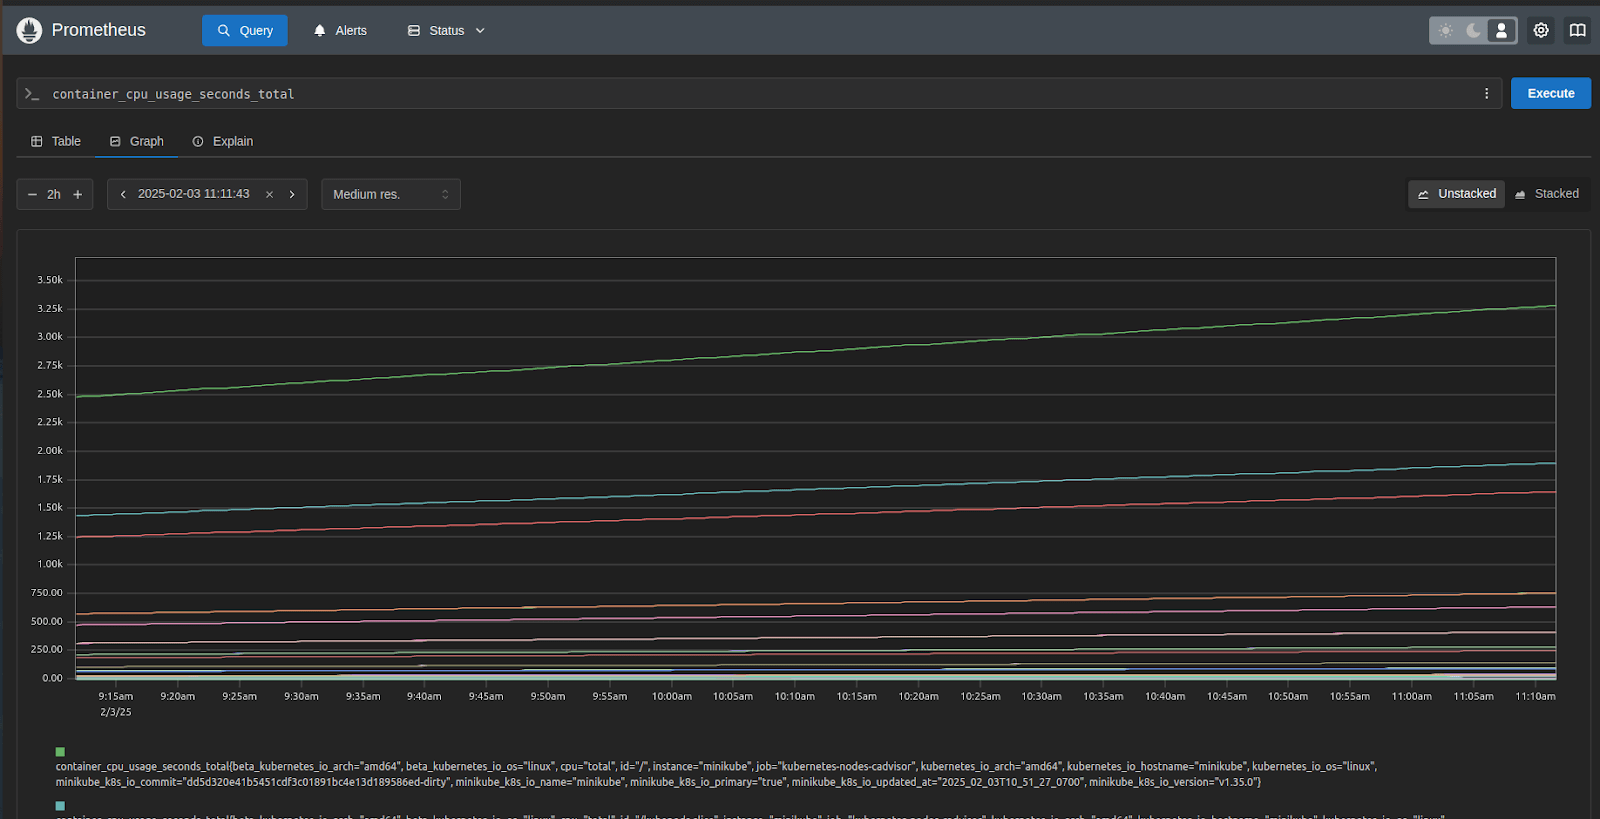
Data Querying
Time-series data becomes accessible through Prometheus with the help of PromQL which functions specifically for interacting with this kind of data. The query language PromQL allows users to filter, aggregate, and convert their data to aid system performance analysis and time-based trend detection.
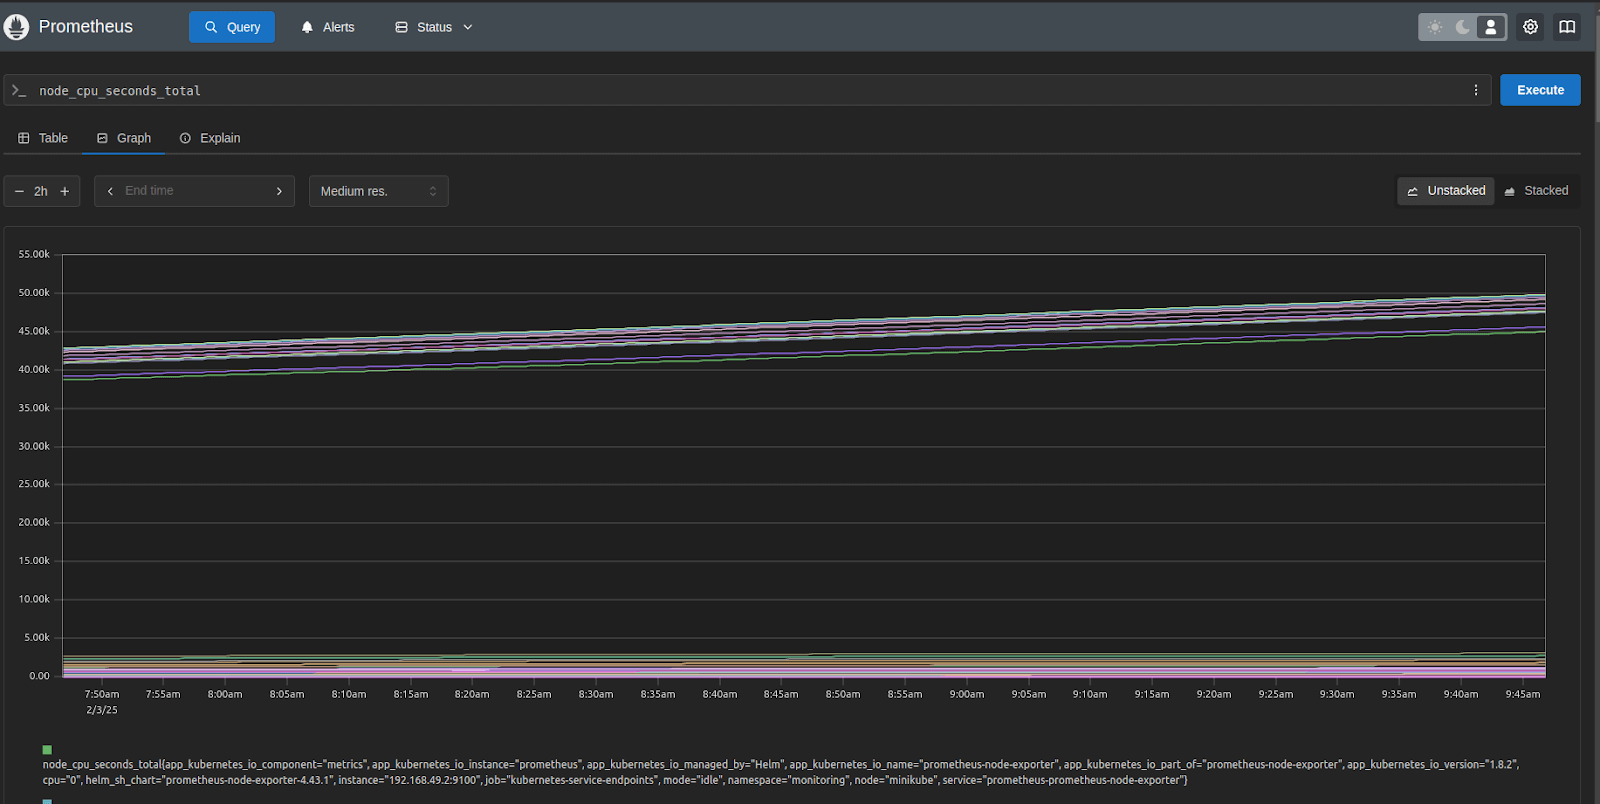
For example, you can use the query `node_cpu_seconds_total` to obtain the total CPU time. The rate of HTTP requests during the last five minutes can be found using `rate(http_requests_total[5m])`.
To gain insight into memory consumption across several hosts, the query `avg by (instance) (node_memory_Active_bytes)` also calculates the average active memory usage per instance.
Alertmanager
Alertmanager manages alerts triggered by Prometheus, handling routing, deduplication, and integration with external notification systems, ensuring prompt issue resolution.
Alerting
Prometheus supports rule-based alerting via Alertmanager, allowing users to define alerting rules that continuously evaluate metrics against specified conditions. Prometheus creates alerts and notifies channels like Slack, PagerDuty, or email when a condition is satisfied, such as a threshold being crossed.
For example, if CPU utilization surpasses 80% for more than five minutes, an alert rule could be set:
```yaml
alert: HighCPUUsage
expr: node_cpu_seconds_total > 80
for: 5m
labels:
  severity: critical
annotations:
  summary: "High CPU Usage detected"
```
In this case, if the CPU usage remains high for 5 minutes, an alert is triggered and sent to the configured notification channels.
Collecting Prometheus Metrics with Middleware
Middleware provides a Prometheus-compatible metrics endpoint that Prometheus scrapes to collect system and application data. The Middleware host agent gathers and exposes structured metrics, simplifying data collection for real-time monitoring.
Prometheus Integration enables users to visualize insights, retrieve metrics, and set alerting rules for anomaly detection.
This is how Middleware integrates with Prometheus for monitoring and alerting. The application sends data to Middleware, which pre-processes the metrics before forwarding them to Prometheus.
Within Prometheus, an exporter collects raw metrics, which are then stored and queried by the Prometheus server using PromQL. The processed data is visualized through the Prometheus and Grafana UI.
If any anomalies are detected, the Alert Manager pushes alerts via Slack, Email, or PagerDuty, ensuring timely notifications. This setup enables efficient monitoring, metric storage, and automated alerting.
Middleware Data Collection
Middleware collects metrics from various sources, such as system resources, applications, and services, and exposes them in a Prometheus-compatible format. Prometheus then scrapes these metrics from Middleware at regular intervals. This setup ensures that Prometheus gathers structured and preprocessed data without directly interfacing with multiple raw data sources.
Data Processing and Normalization
Middleware does not modify or filter the metrics before Prometheus scrapes them. Instead, it collects raw system and application data and makes it available through an endpoint that follows Prometheus’ exposition format.
Prometheus retrieves these metrics exactly as they are provided by Middleware and stores them for querying, visualization, and alerting.
Integrating Middleware with Prometheus allows users to centralize metric collection, simplify monitoring, and use Prometheus’ querying and alerting capabilities for efficient infrastructure observability.
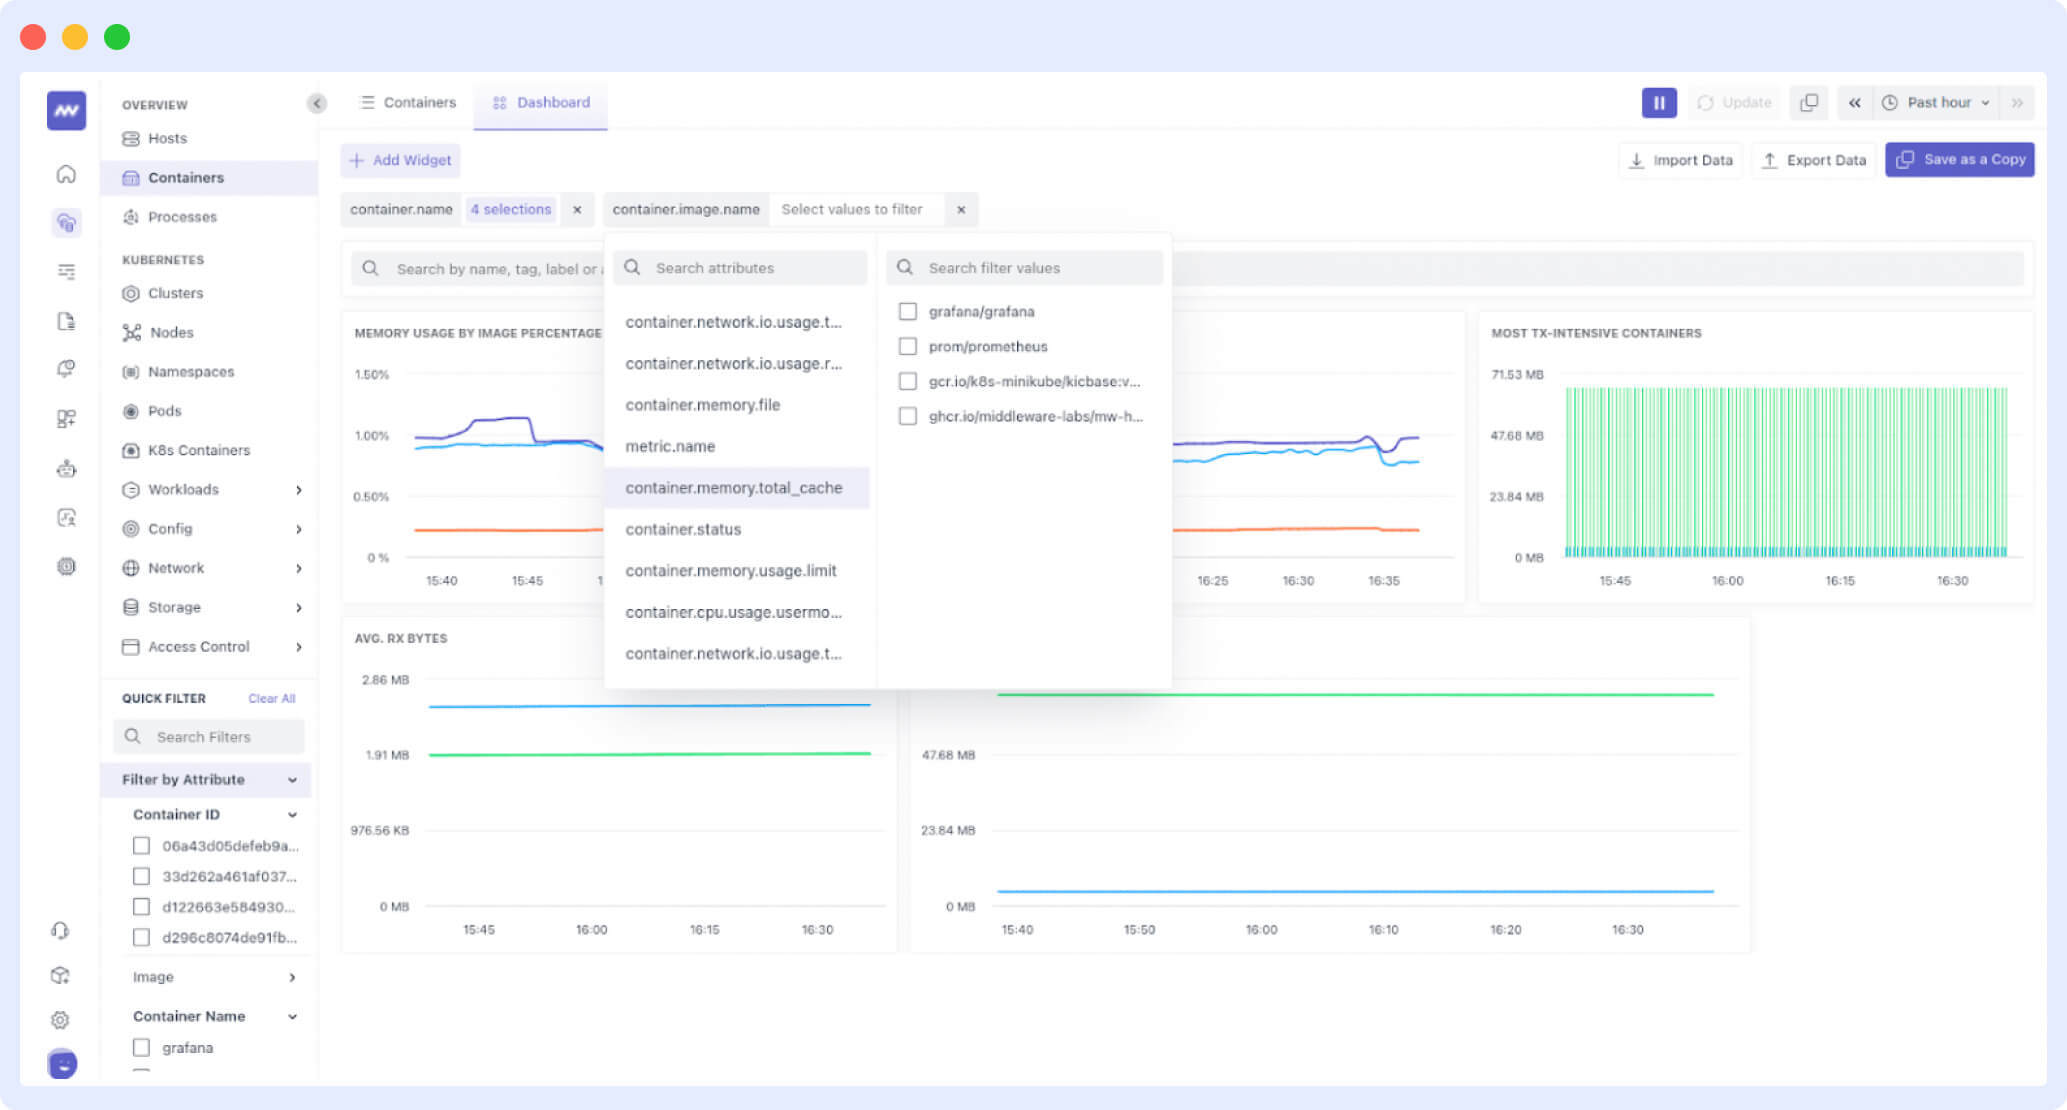
Middleware Dashboard
Although middleware handles data preprocessing, it doesn’t visualize metrics directly. Instead, it relies on Prometheus to store the data. The middleware dashboard queries Prometheus to retrieve metrics and presents them in an organized way, helping users monitor system performance and make informed decisions.
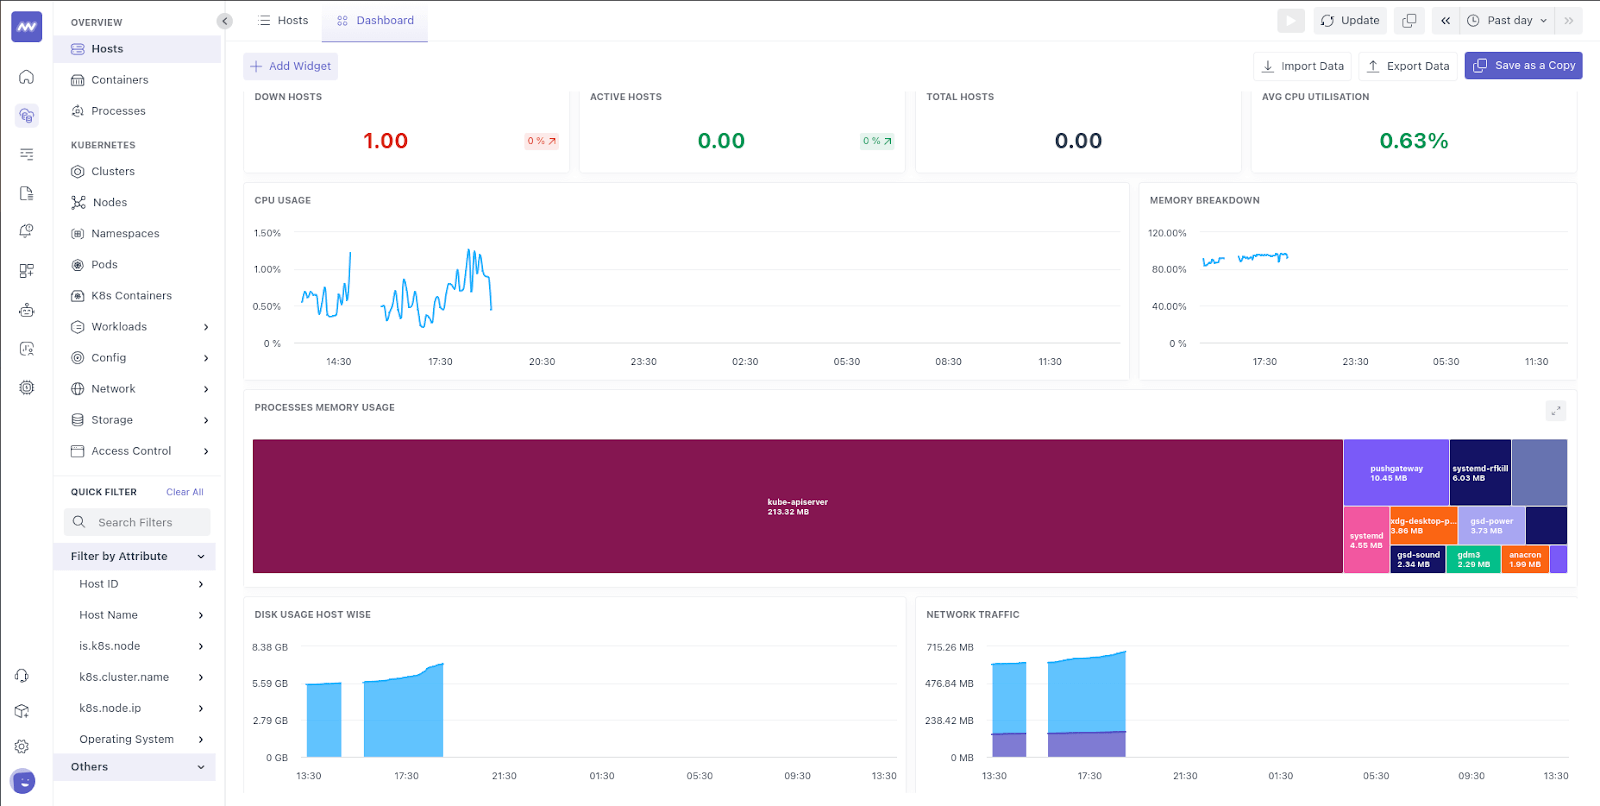
By using the middleware host agent, Prometheus efficiently collects and stores high-quality metrics, enhancing observability and monitoring capabilities. This integration reduces data redundancy and ensures a more streamlined approach to analyzing performance.
Benefits of Using Middleware with Prometheus
Integrating Middleware improves the infrastructure by optimizing the metric collection, improving Prometheus metrics analysis, and strengthening infrastructure monitoring. Middleware acts as an intermediary layer, refining and structuring data before it reaches Prometheus, making observability more effective.
1. Simplified Metric Collection
Without middleware, Prometheus scrapes metrics directly from numerous exporters, which can increase network overhead. Middleware consolidates data from multiple sources, reducing the load on Prometheus and making sure that a more efficient Prometheus monitoring setup is implemented.
For example, in Kubernetes monitoring, Istio is a service mesh tool that collects and exposes application-level metrics, e.g., HTTP request counts, latencies, error rates, and microservices metrics, and exposes them through a single endpoint, simplifying data collection.
2. Enhanced Data Analysis and Filtering
Middleware pre-processes raw Prometheus metrics, filtering out irrelevant data, normalizing formats, and appending meaningful labels such as region="us-west" or tier="backend".
This enables more precise queries using PromQL. Instead of querying multiple data points, Prometheus can retrieve pre-processed and aggregated results, improving efficiency.
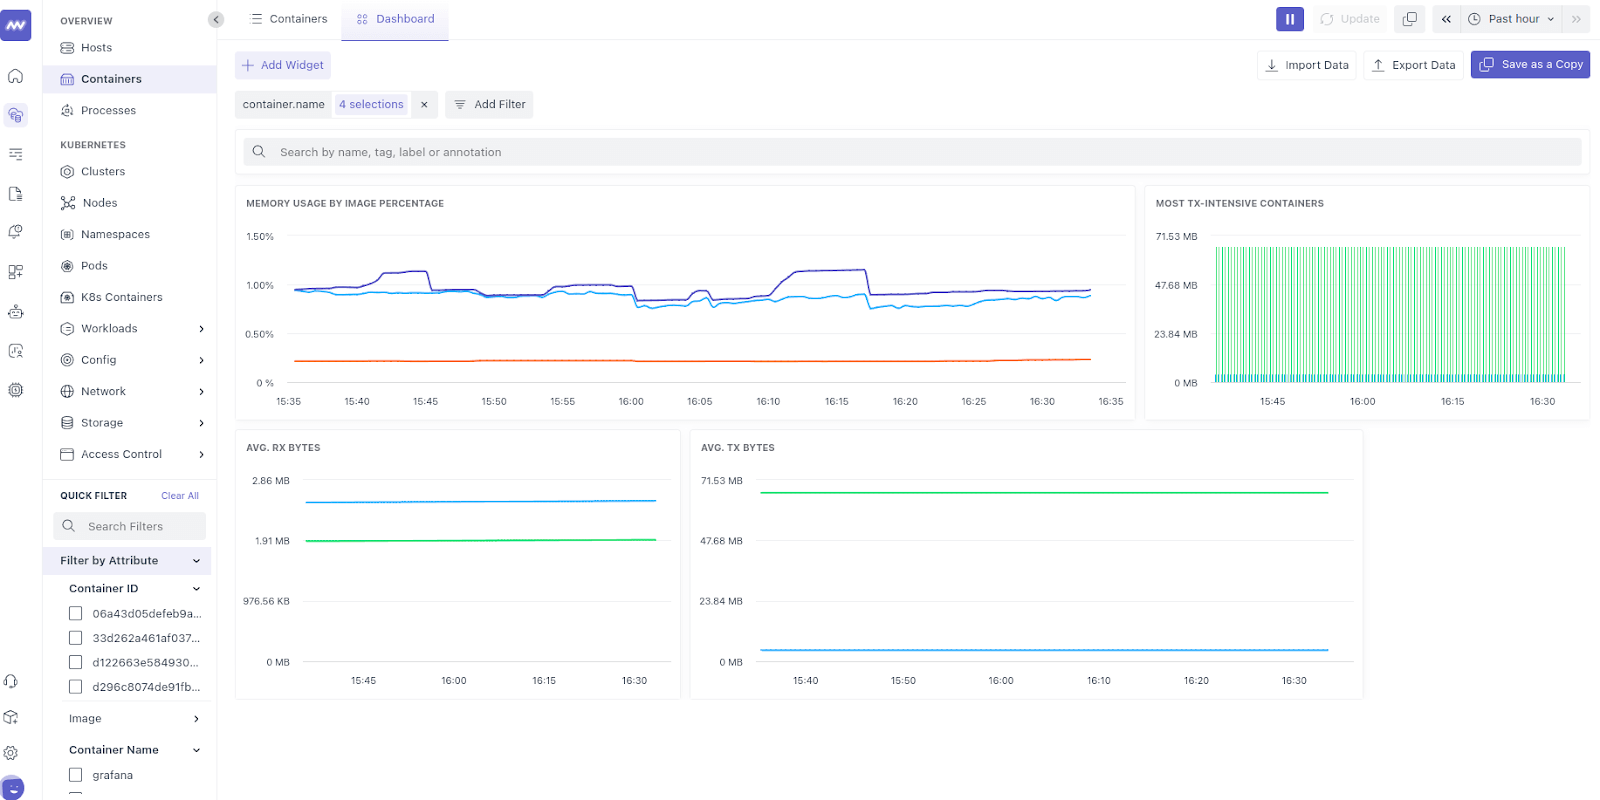
3. Improved Observability and Centralized Dashboards
Middleware enhances modern observability tools by offering a unified dashboard for deeper performance insights. It collects metrics from different parts of your system like the infrastructure, applications, and network giving you a complete view of your system’s performance.
By integrating with Prometheus architecture, middleware helps DevOps teams quickly detect and resolve performance bottlenecks.
Key Concepts in Prometheus
Metrics
Prometheus collects different types of metrics to monitor system performance. These include:
- Counters: These are metrics that only increase over time. For example, tracking the total number of HTTP requests received.
- Gauges: Metrics that can go up or down. For example, monitoring memory usage, which can fluctuate based on demand.
- Histograms: These show the distribution of values over time. An example would be tracking the duration of requests to see how long they take.
- Summaries: Similar to histograms, summaries are helpful for performance analysis since they contain precomputed quantiles, such as the 95th percentile of request durations.
Labels
Labels are used to add additional information to metrics, making it easier to organize and filter them. For example, you could label HTTP request metrics by method and status to differentiate between GET and POST requests or track different status codes.
An example label might look like this: `http_requests_total{method="GET", status="200"}`
Alerting Rules
Alerting rules in Prometheus define the conditions under which alerts are triggered. For example, if free disk space falls below a certain threshold, an alert can notify you. A simple alert rule could be,
```yaml

alert: DiskUsageHigh

expr: node_filesystem_free_bytes < 10G

for: 10m

```
This rule triggers an alert if free disk space remains below 10GB for more than 10 minutes.
Recording Rules
Recording rules help optimize queries by precomputing and storing aggregate metrics. This makes querying more efficient, especially for complex calculations. For example, a recording rule could calculate the rate of CPU usage over the last 5 minutes:
```yaml

record: instance:cpu_usage:rate5m

expr: rate(node_cpu_seconds_total[5m])

```
This rule computes the CPU usage rate over 5 minutes and stores it for quicker access during queries.
These key concepts in Prometheus help in organizing, analyzing, and alerting on the performance data, making monitoring more efficient and actionable.
Use Cases of Prometheus
Prometheus is a popular tool used for monitoring across different environments. It is extensively used to monitor system performance and guarantee dependable operations in a range of situations.
Here are some use cases for that:
- Kubernetes Monitoring: Compiles data on CPU, memory, and network consumption to monitor pod health and resource usage to support autoscaling.
- Microservices Observability: The observation of microservices allows teams to solve problems efficiently through combined monitoring of request latency along with error counts and service connection relationships.
- Infrastructure monitoring: The tool obtains vital metrics through infrastructure monitoring from virtual and real platform host machines, including CPU and memory usage, together with network statistics.
- Application performance: monitoring ensures optimal app performance and responsiveness by tracking important metrics, including database queries, user interactions, and API response times.
Conclusion
For cloud-native systems, Prometheus is a powerful monitoring and alerting toolset that excels in microservices observability, infrastructure tracking, and Kubernetes monitoring. It makes real-time metric analysis and proactive alerts possible with its robust Prometheus Query Language (PromQL) and smooth Grafana integration.
The reliability and scalability of DevOps observability workflows depend heavily on Prometheus monitoring because its extensive ecosystem and active community enable operational efficiency.
FAQ
How does the Prometheus database work?
Prometheus uses a time-series database to store metrics as key-value pairs with timestamps. Data is first written to a Write-Ahead Log (WAL) for durability, then compacted into 2-hour blocks for efficiency. Metrics can be queried using PromQL. By default, data is stored locally for 15 days, with options to use remote storage like Thanos for longer retention.
How does Prometheus client work?
Prometheus client libraries enable applications to expose metrics via an HTTP endpoint (e.g., /metrics). Developers define metrics such as counters, gauges, histograms, and summaries. Prometheus periodically scrapes these endpoints to collect data. Short-lived jobs can push metrics to a Push Gateway, which Prometheus then scrapes.
What is the difference between Middleware and Prometheus?
Middleware is software that helps different applications or systems communicate and work together. It manages data flow and connections between these systems. On the other hand, Prometheus is a tool used to monitor systems by collecting and analyzing data about their performance. While middleware focuses on connecting systems, Prometheus focuses on checking how well those systems are working and sending alerts if there are any issues.
Is Prometheus highly available?
Prometheus is not natively highly available, but it can achieve it by running multiple instances scraping the same targets. Tools like Thanos or Cortex can provide distributed storage and long-term retention. Alertmanager ensures duplicate alerts are handled, and federation allows aggregation from multiple Prometheus instances.


