Imagine your Java application is a thriving online store, buzzing with activity. On a big sale day, the excitement peaks—but suddenly, your application starts slowing down, orders get delayed, and then it crashes.
While there are many reasons an application might slow down or crash, such as high CPU usage, slow database queries, or inefficient code, one of the main reasons is often memory management issues. This is where Java Garbage Collection comes in. By automatically reclaiming memory from objects that are no longer in use, GC helps keep your application running smoothly.
Java GC acts like a diligent housekeeper for your application’s memory, automatically clearing out those unused objects to prevent such disastrous crashes. Let’s explore what Java Garbage Collection is, why it’s vital, and how you can ensure it works optimally for your applications.
What is Java garbage collection?
Java Garbage Collection (GC) is an automatic memory management system that is a fundamental part of the Java runtime environment. Its primary role is to identify and reclaim memory occupied by objects that are no longer in use by the application. By doing so, it prevents memory leaks and optimizes memory usage without requiring developers to manually manage memory allocation and deallocation
- Automatic memory management: GC automatically frees up memory by removing unused objects, eliminating the need for manual memory management.
- Prevents memory leaks: By identifying and cleaning up objects that are no longer referenced, GC prevents memory leaks that can lead to application crashes.
- Optimizes performance: Efficient memory management through GC helps maintain application performance by ensuring that the heap space is used effectively.
- Simplifies development: With GC handling memory cleanup, developers can focus on writing business logic without worrying about memory allocation details.
Why is Java garbage collection important?
Java Garbage Collection (GC) plays a vital role in maintaining the health and performance of Java applications. Here’s why:
Preventing memory leak
GC identifies and removes unused objects, preventing memory leaks that could lead to memory exhaustion and application crashes. By reclaiming memory from unused objects, GC ensures that there is always available memory for new objects, preventing sudden application failures.
Improved performance
GC optimizes memory usage by continuously freeing up space occupied by unused objects, leading to smoother application execution. By managing memory allocation and deallocation, GC reduces fragmentation, ensuring faster and more efficient memory operations.
Simplified development
Developers are freed from the complexities of manual memory allocation and deallocation, allowing them to focus on writing functional code. Automated memory management by GC reduces the likelihood of memory-related bugs, such as dangling pointers and memory leaks.
Enhanced scalability
GC helps in managing memory resources efficiently, allowing applications to scale up to handle more data and users. By ensuring optimal memory management, GC makes it possible to build and maintain large-scale, enterprise-level applications.
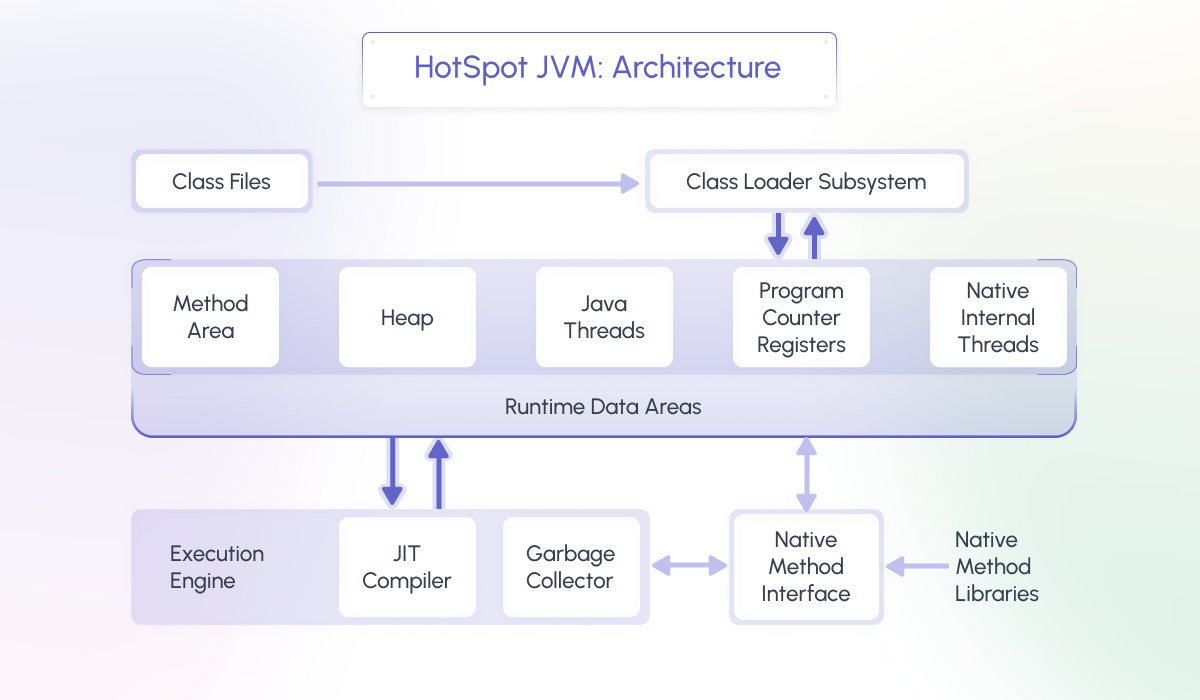
Understanding Java memory management
Java Heap Memory is a dedicated memory space used for dynamic memory allocation where all Java objects are stored. This heap is managed by the Java Garbage Collector (GC), which ensures that memory is used efficiently by reclaiming space from objects that are no longer in use.
Generational garbage collection
Java uses a generational approach to garbage collection, which categorizes objects based on their lifecycle:
Young generation
- Frequent GC cycles: The Young Generation is designed for short-lived objects. It consists of the Eden space and two Survivor spaces (S0 and S1).
- Eden space: New objects are initially allocated in the Eden space.
- Minor GC: When the Eden space fills up, a minor GC cycle occurs, moving surviving objects to the Survivor spaces. This process is quick and happens frequently.
Tenured/old generation
- Longer-lived objects: Objects that survive multiple minor GC cycles in the Young Generation are moved to the Tenured Generation (also known as the Old Generation).
- Less frequent GC cycles: Collections in the Tenured Generation are less frequent but more time-consuming compared to the Young Generation.
Permanent generation
- Static data storage: In versions of Java before 8, the Permanent Generation stored metadata such as class information and method data. This has been replaced by Metaspace in Java 8 and later versions.
Garbage collection algorithms
Java uses different algorithms to manage memory efficiently and reclaim unused objects. Let’s dive into two key algorithms:
Marking and sweeping
Marking phase:
- Objective: Identify all reachable objects starting from GC roots.
- Process: During the marking phase, the Garbage Collector (GC) traverses through the heap, marking all objects that are accessible directly or indirectly from GC roots (e.g., local variables, static variables). These marked objects are considered alive and are retained in memory.
Sweeping phase:
- Objective: Reclaim memory from objects that were not marked as reachable.
- Process: After marking, the GC performs the sweeping phase. It scans through the heap again and identifies objects that were not marked during the previous phase. These unmarked objects are no longer in use by the application and are reclaimed, freeing up memory for future allocations.
Copy collection
Copying phase:
- Objective: Optimize memory usage by relocating surviving objects.
- Process: In the copy collection algorithm, the GC copies surviving objects from one area of memory to another. Typically, this involves moving objects from the Eden space and Survivor spaces to a new area of memory. By doing so, it compacts memory usage, reduces fragmentation, and prepares the original memory space for new allocations.
Understanding these algorithms helps developers optimize memory management in Java applications, ensuring smoother performance and avoiding issues like memory leaks or excessive pauses during garbage collection cycles.
GC terminology
To understand Java Garbage Collection (GC) better, let’s explore key terminology that forms the foundation of how GC manages memory in Java applications:
GC roots
GC roots are critical reference points in the Java runtime environment that serve as starting points for the Garbage Collector to traverse and identify reachable objects.
Types of GC roots:
- Local variables: Variables defined within methods and currently in scope.
- Active threads: Threads currently running in the application.
- Static variables: Class-level variables that are referenced from a class.
- JNI (Java native interface) references: References from native code to Java objects.
GC roots ensure that any object reachable directly or indirectly from these roots is considered alive and not eligible for garbage collection.
Reachability
Reachability in the context of Java GC refers to the accessibility of an object starting from the GC roots. An object is said to be reachable if there exists a path of references from one or more GC roots that lead to the object.
Types of reachability:
- Strong reachability: An object is strongly reachable if it can be accessed directly from a GC root or through a chain of strong references.
- Soft reachability: Objects that are reachable through soft references, which are cleared by the GC only when memory is low.
- Weak reachability: Objects that are reachable only through weak references, which are cleared by the GC during the next garbage collection cycle.
- Phantom reachability: Objects that are reachable only through phantom references, which are enqueued after the object is finalized but before it is reclaimed.
GC uses reachability to determine which objects are eligible for garbage collection. Objects that are not reachable are considered dead and can be safely reclaimed to free up memory.
Minor vs. Major GC collections
Definition:
- Minor GC (young generation GC): This type of GC collects garbage in the Young Generation, where short-lived objects are allocated. It is characterized by fast and frequent collections, usually involving the Eden space and Survivor spaces.
- Major GC (full GC): A major GC involves the entire heap, including both the Young Generation and the Tenured Generation (Old Generation). It is less frequent but more time-consuming compared to a minor GC.
Purpose:
- Minor GC: Cleans up short-lived objects and promotes surviving objects to the Old Generation.
- Major GC: Reclaims memory across the entire heap, including long-lived objects in the Old Generation, and often involves compaction of memory to reduce fragmentation.
Understanding the distinction between minor and major GC collections helps developers optimize memory usage and anticipate the impact of garbage collection cycles on application performance.
These GC-related terms form the basis of understanding how Java manages memory dynamically, ensuring efficient memory utilization and stable application performance.
Monitoring and tuning Java garbage collection
Java Garbage Collection (GC) is pivotal for maintaining Java application performance by efficiently managing memory. Effective monitoring and tuning of GC parameters are essential practices to ensure optimal resource utilization and application stability.
Java monitoring tools
Monitoring tools like Middleware, VisualVM, jmap, and jstat provide invaluable insights into GC activity:
- Middleware: Offering comprehensive monitoring for Java applications, Middleware’s APM provides end-to-end visibility, real-time metrics, and distributed tracing to quickly identify and resolve performance issues.
- VisualVM: Integrated with the JDK, VisualVM offers real-time monitoring of heap usage, GC cycles, thread behavior, and more through a graphical interface.
- jmap: This command-line utility generates heap dumps and provides details on heap memory usage, aiding in diagnosing memory-related issues.
- jstat: Another command-line tool, jstat reports JVM performance statistics including GC behavior, memory usage, and more, useful for analyzing application performance over time.
Interpreting GC output
Understanding GC output involves monitoring key metrics:
- Collection times: Track the duration of GC cycles to identify if they are causing application pauses or delays.
- Memory usage: Monitor heap usage trends to ensure it remains within optimal limits and detect memory leaks early.
- Object counts: Analyze the number of live and dead objects during GC cycles to understand memory allocation patterns and optimize accordingly.
Fine-tuning GC for optimal performance
Optimizing GC behavior involves configuring JVM parameters:
- Xmx and Xms flags: Set maximum (Xmx) and initial (Xms) heap sizes based on application requirements to balance memory usage and performance.
- GC logging and verbose flags: Enable GC logging (-verbose:gc, -Xlog:gc) to capture detailed information about GC activities, helping diagnose performance issues related to memory management.
- Permanent generation tuning: For older Java versions, tuning the Permanent Generation (PermGen) for class metadata and interned strings was crucial. In Java 8 and later, this has been replaced by Metaspace, which requires adjusting parameters based on application demands.
By leveraging these tools and techniques, developers can proactively manage memory resources, optimize application performance, and ensure a stable and responsive Java application environment.
Common Java GC issues and troubleshooting
Java Garbage Collection (GC) is essential for managing memory efficiently in Java applications, but it can encounter several critical issues:
Memory leaks
Causes: Objects not properly dereferenced, static references holding unnecessary objects, and mismanagement of thread-local variables.
Solution: Use tools like VisualVM for heap analysis to identify memory-consuming objects. Ensure proper object dereferencing, manage static references carefully, and use weak references for non-critical caches.
Full GC pauses and long GC times
Issue: Full GC cycles cause significant pauses in application execution, leading to degraded user experience and increased latency.
Solution: Select GC algorithms like CMS (Concurrent Mark-Sweep) or G1 (Garbage-First) that minimize pause times. Adjust settings to reduce the frequency and duration of Full GC cycles based on application requirements.
Fragmentation issues
Issue: Fragmentation occurs when memory becomes divided into small, non-contiguous blocks over time due to object allocation and deallocation.
Solution: Consider GC algorithms like G1 that perform heap compaction to reduce fragmentation and improve memory utilization.Design applications to minimize short-lived objects and reduce fragmentation over time.
Final thoughts
Java Garbage Collection (GC) automates memory management by reclaiming unused memory, preventing issues like memory leaks and OutOfMemoryError exceptions. Its importance lies in optimizing memory usage for smoother application performance and simplifying development by reducing manual memory management tasks.
Next steps would be to continuously optimize GC settings and monitor performance metrics using tools like Middleware. Stay updated on best practices and experiment with different configurations to enhance Java application efficiency.