Kubernetes is quickly becoming the standard for container orchestration, allowing developers to deploy and manage applications quickly and easily in a distributed environment.
However, managing and monitoring K8s can be challenging because a Kubernetes cluster appears to be a single computer to a user, but it is a set of independent nodes and multiple services that have been connected.
You will need proper monitoring and observability strategies and tools to properly monitor and observe a Kubernetes cluster.
Here are some of the most popular and reliable Kubernetes monitoring tools you can use in 2026. So let’s dive in…
What are Kubernetes Monitoring tools?
Kubernetes monitoring tools are software solutions designed to monitor the health, performance, and availability of Kubernetes clusters and the applications running on them.
These tools provide insights into various aspects of the Kubernetes environment, such as resource utilization, pod status, network traffic, and application metrics.
Top 10 Kubernetes monitoring tools
Kubernetes is a complicated system that requires careful cluster monitoring tools to spot and troubleshoot production-related problems. You can efficiently monitor your deployments in production with the aid of these paid Kubernetes monitoring tools.
1. Middleware : Best Tools for Kubernetes Monitoring
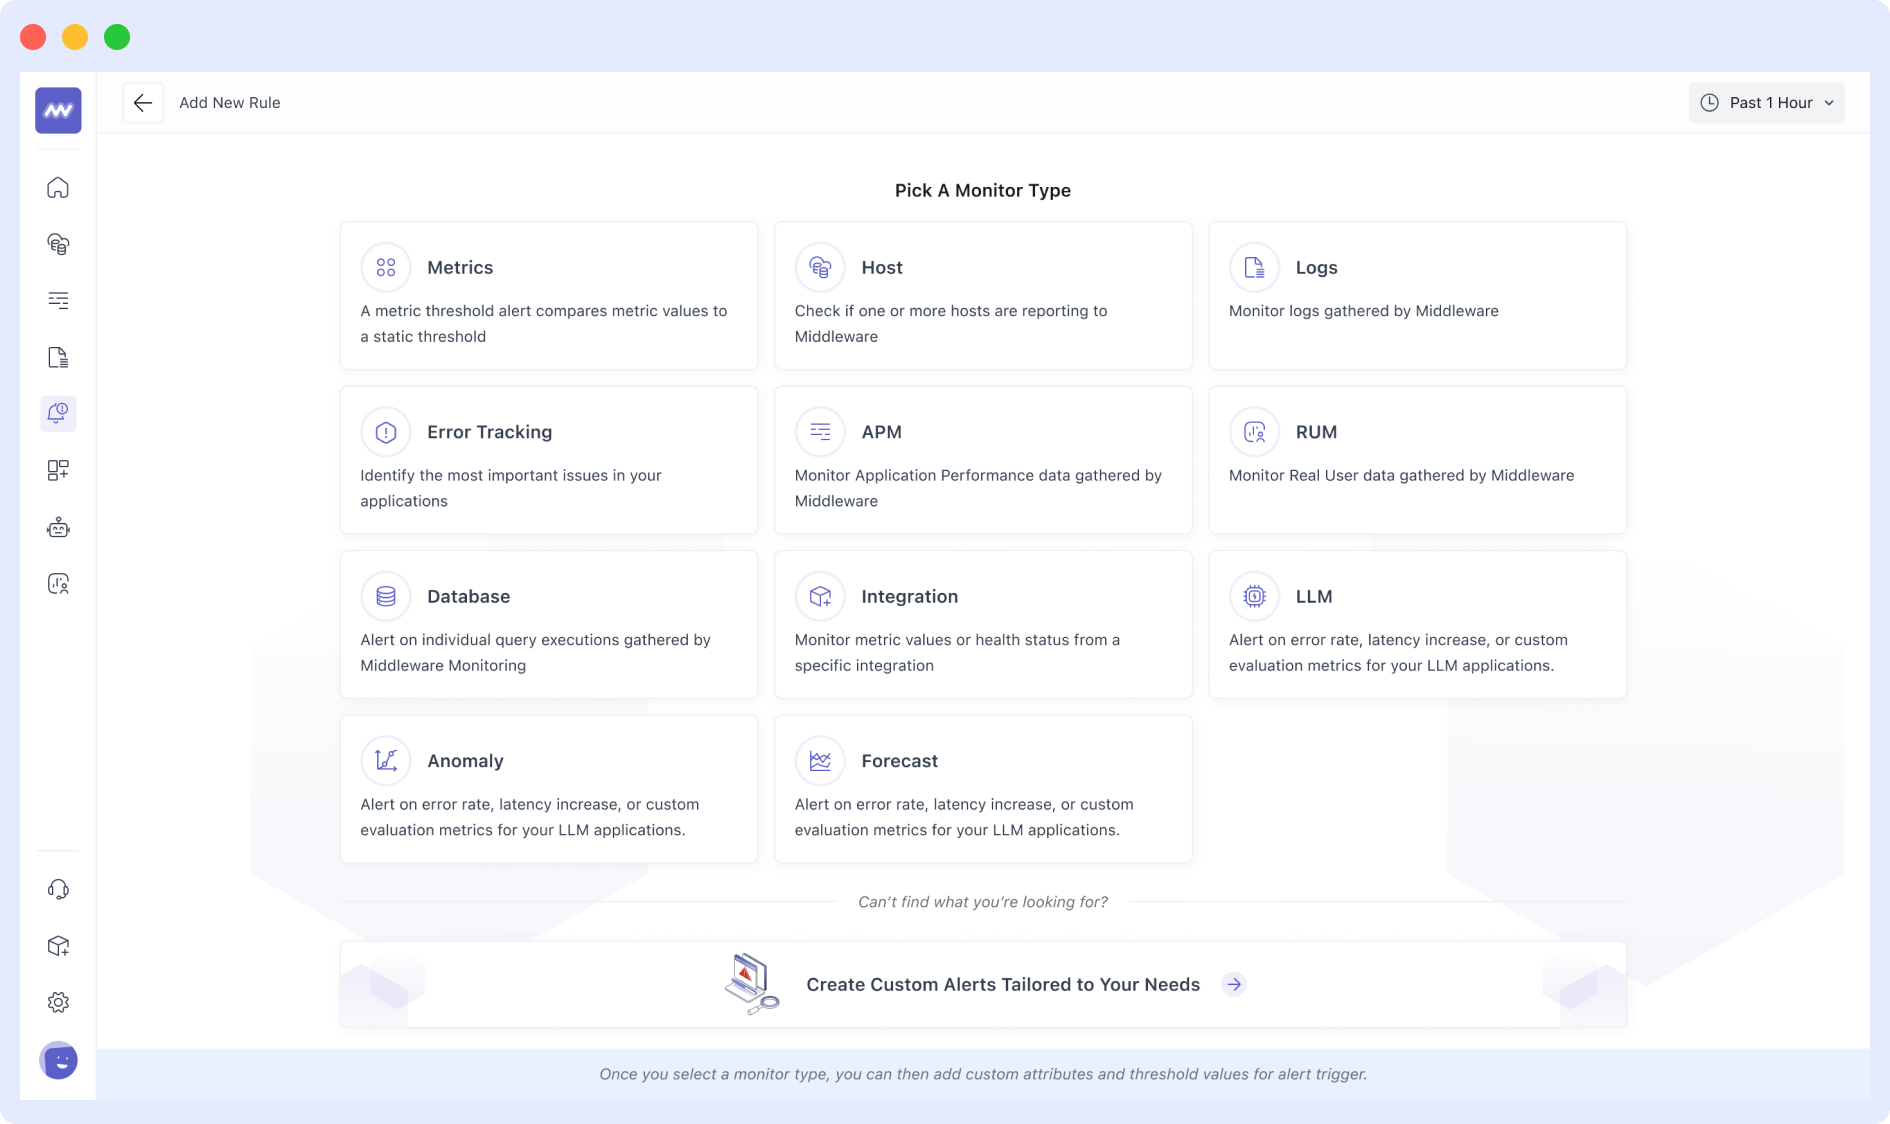
Middleware Kubernetes monitoring is one of the best tools for providing K8s monitoring capabilities. This tool helps you monitor and identify issues in your container ecosystem in real time.
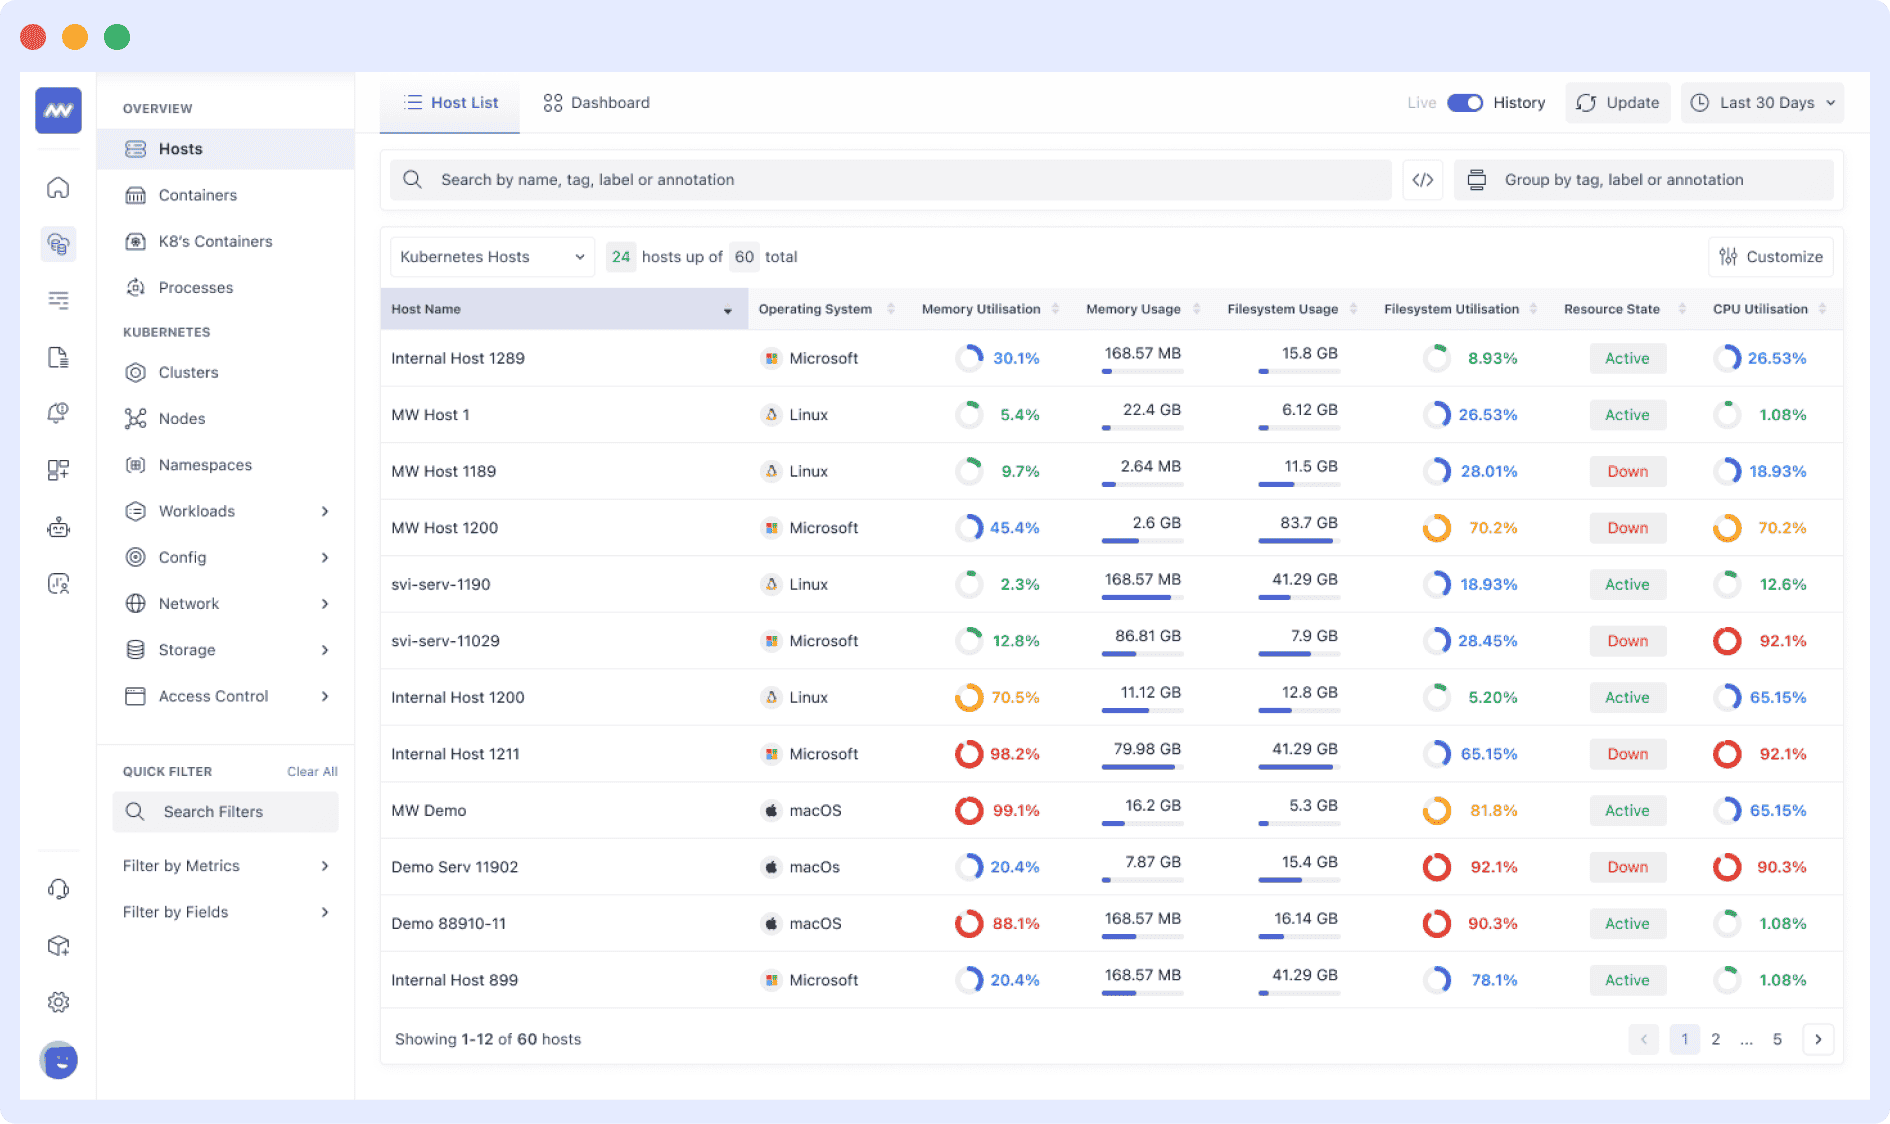
The tool uses a lightweight agent and is easy to install. Middleware allows you to add multiple datasets to a single dashboard, perhaps one of the reasons why it is listed as one of the best Kubernetes monitoring tools.
Pros
- Easy to install, lightweight agent.
- Clean and user-friendly UI.
- You can add multiple datasets to one dashboard.
- You can easily transition from correlation to causation by connecting metrics, logs, traces, & network data.
- You can spot emerging issues in real time.
- You do not need to pre-configure your alerts.
- Automatic microservice discovery.
- Automate the early detection of potential threats that could compromise your Kubernetes clusters.
- Offers synthetic checks for APIs across 8 categories. For example, with HTTP checks, users can verify if their APIs are functioning optimally with the expected response code (200 OK). Additionally, SSL checks can enable them to set up alerts to check if their SSL certificate is about to expire.
- One-step Kubernetes setup with auto-instrumentation. Meaning that you can monitor application performance without additional instrumentation.
- Faster root cause analysis.
- Pre-built and customized alerting.
- See the health of all your resources with customized dashboards.
Cons
- Fairly new to the market.
Pricing
- Free Trial – 14-day free trial with unlimited data ingestion.
- Pay As You Go – $0.03 per GB of metrics, logs, and traces (pay-only-for-what-you-use model).
- Enterprise Plan – Custom pricing.
2. Prometheus: Best free K8s monitoring tool
One of the most often used Kubernetes monitoring tools is Prometheus. It is part of the Cloud Native Computing Foundation and is community-driven. Google’s Borg Monitor served as the basis for this project, which was first created by SoundCloud and then contributed to the CNCF.
Prometheus stores all of its data as a time series. The PromQL query language can query this data, and an expression browser built-in to visualize it. Grafana is used by Prometheus since it lacks a dashboard and needs to visualize data.
3. Kubernetes Dashboard
Kubernetes Dashboard is a web-based UI add-on for Kubernetes clusters. It offers a straightforward method for managing, troubleshooting, and monitoring your environment. Using the Kubernetes Dashboard, you can check the status of workloads and view basic data such as memory and CPU use statistics across all of your nodes.
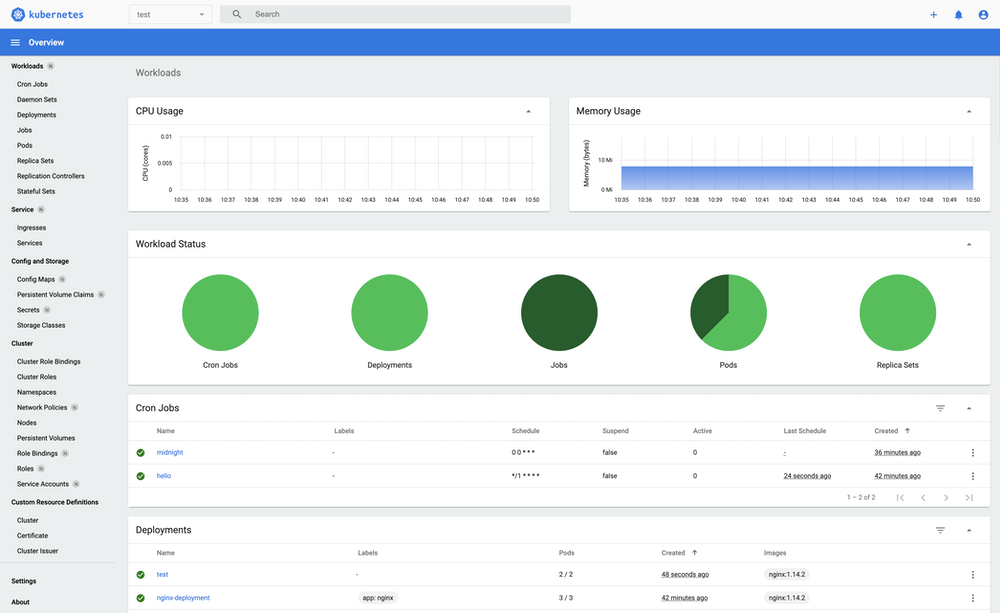
With ready-to-use YAML files, installing the Kubernetes Dashboard is simple. Check this document from Kubernetes if you feel stuck.
4. Sematext
For traditional and microservices architecture based applications running on Kubernetes, Sematext is a real-time monitoring solution that captures metrics and events. This data can then be organized, visualized, and analyzed; alerts can be triggered, etc.
Pros
- Simple to install.
- Auto-discovery identifies services and logs and keeps track of them.
- Alerting and anomaly spotting built-in.
- Time-saving default monitoring dashboards and alert rules.
- SaaS offering with no infrastructure to maintain.
- Quite comprehensive documentation.
- Good customer support.
- Easy to use UI.
- Detects Kubernetes API server issues like 4XX and 5XX errors.
Cons
- The user interface takes time to get used to.
- Needs more integrations with security tools.
- A bit more expensive compared to its alternatives.
- Poor user management.
Pricing
- The monthly cost of Sematext begins at $3.6 per host. Long-term commitments are not required, and usage-based pricing applies. To ensure complete transparency and prevent any unpleasant surprises, Sematext’s monthly cost projections are shown during the free trial.
5. Datadog
With the help of Datadog’s APM solution, you can instantly retrieve logs, metrics, events, and service statuses from Kubernetes. You can use it to monitor, address issues, and improve application performance.
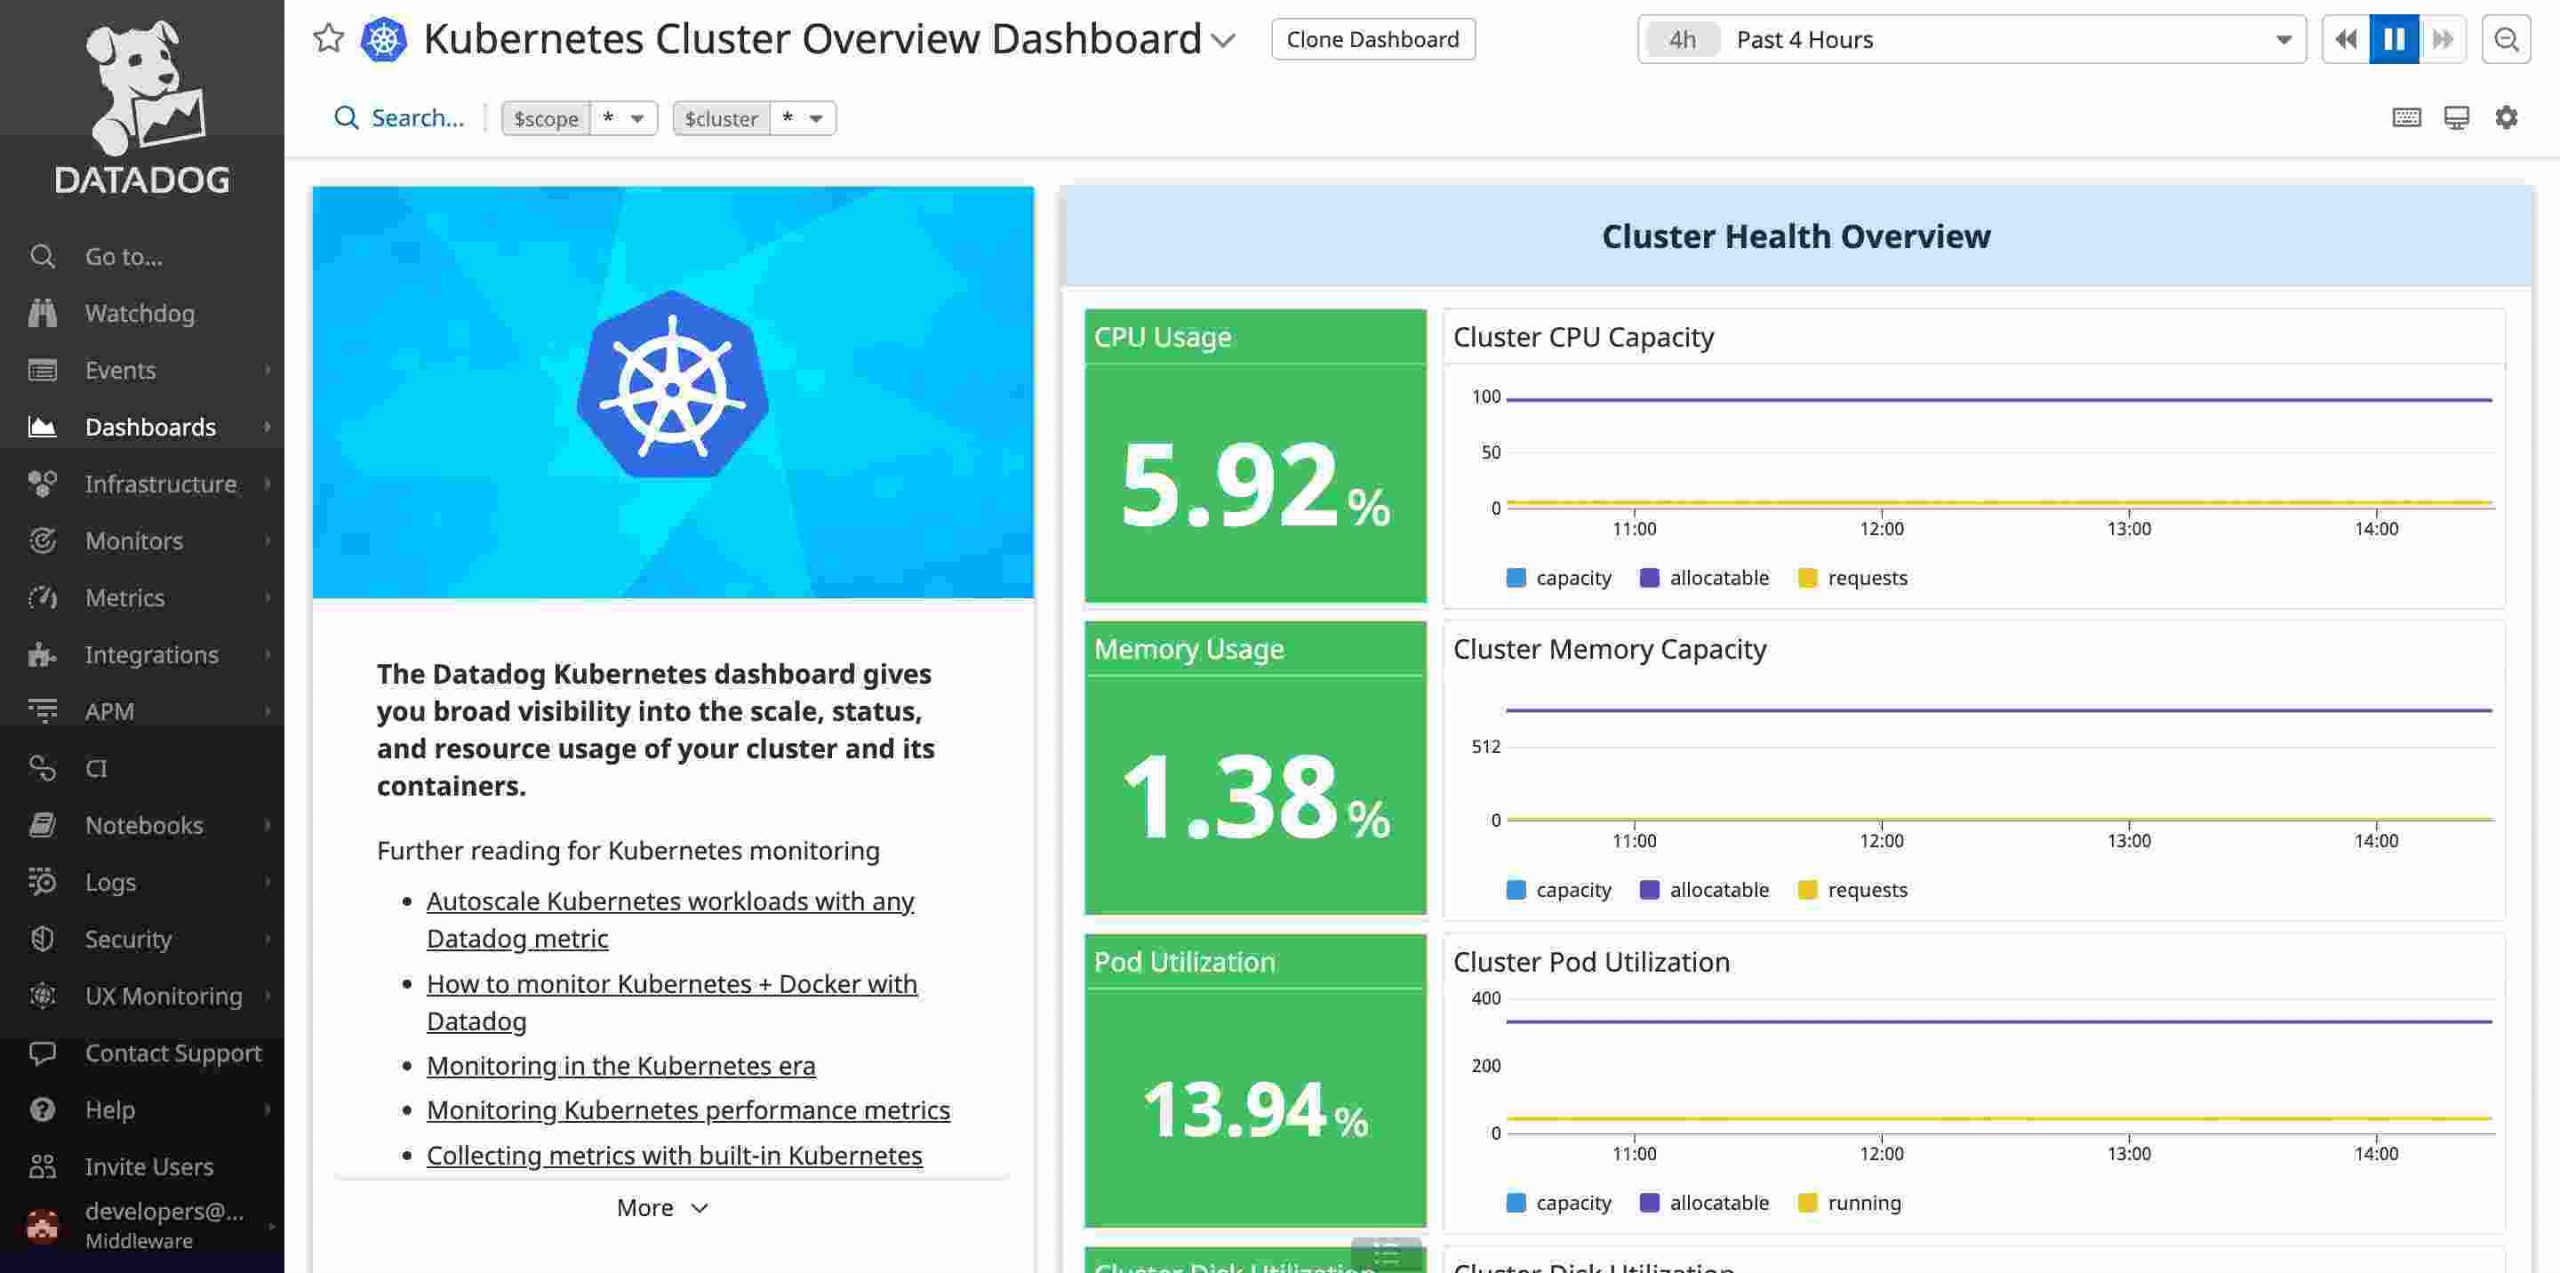
Dashboards, high-resolution metrics, and events are available in Datadog for modification and visualization. Slack and PagerDuty are just a few platforms where you can set up alerts and get notifications. Installing the Datadog Agent is simple. A DaemonSet that will be installed on each cluster node can run it.
Pros
- 650+ built-in integrations
- Real-time interactive dashboards to monitor metrics, traces, logs, and more.
- Offers machine learning-powered analytical tools for anomaly identification and forecasting.
- By design, the product allows users to gather data from large-scale clusters.
- Monitor important user activities proactively and gather user experience data in one location.
- Good visualization capabilities.
- Powerful alerts and warning system.
- Good customer support.
Cons
- Initial learning curve.
- It is expensive and offers limited plans.
- Doesn’t support JSON parsing on logs.
- Confusing documentation.
- Log Ingestion, Indexing and Retention process is complex.
- No dedicated mobile app for accessing alerts on the go.
Pricing
- Free: Up to 5 hosts, 1-day metric retention, and standard events and metrics.
- Pro: Starting at $15 per host, per month (billed annually) or $18 on-demand. Includes 15-month metric retention, custom metrics, and alerts.
- Enterprise: Starting at $23 per host, per month (billed annually) or $27 on-demand. Adds advanced features like machine learning-based alerts, live processes, and correlations.
6. Grafana
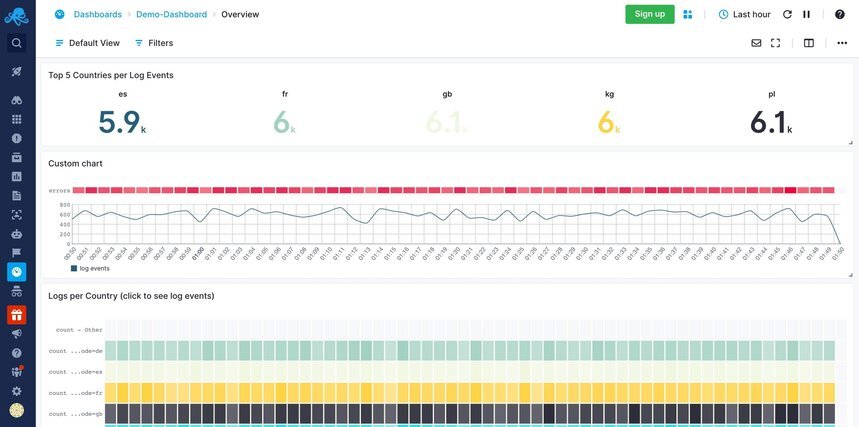
Grafana is an open-source multi-platform tool for Kubernetes monitoring and observation. It links to every source accessible and helps track data. Dynamic dashboards with a variety of graphs, histograms, Geo maps, and template variables are also supported. In this manner, metrics and logs can be swiftly and creatively visualized.
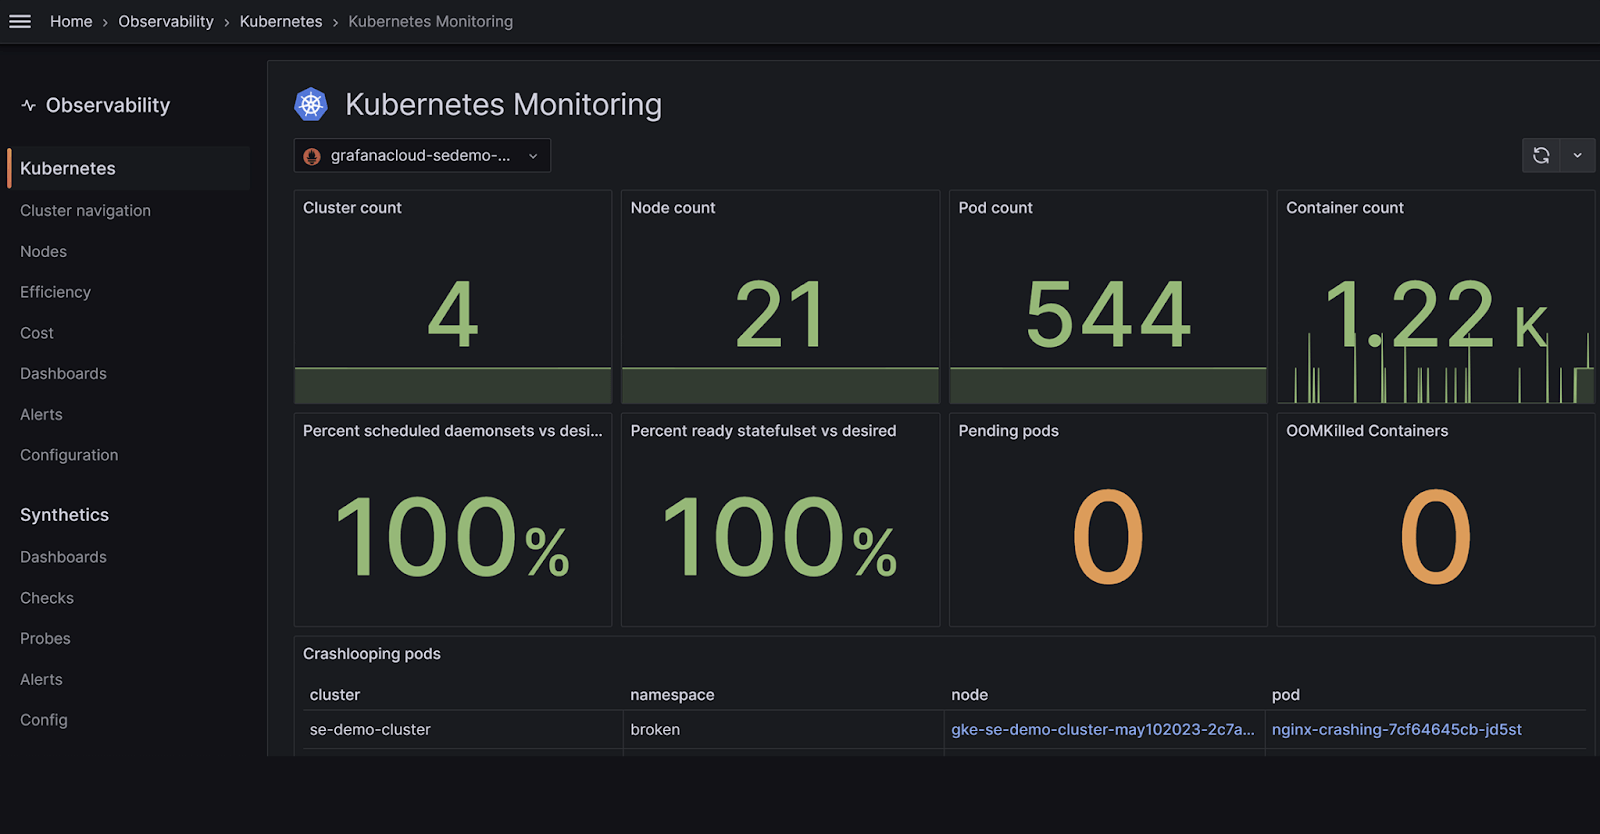
The tool’s integrated alert system helps you establish alert criteria for crucial parameters visually. It also allows for data-source-specific searches, which aid in defining and identifying a data source for each query. This is accomplished by combining various data sources in a single graph.
7. New Relic
New Relic Infrastructure’s on-host integration monitors Kubernetes’ container orchestration layer. This monitoring tool for Kubernetes gathers metrics that keep track of data and metadata for nodes, Namespaces, Deployments, ReplicaSets, Pods, and containers, allowing you to keep track of the hosts and front- and back-end applications running within your Kubernetes clusters.
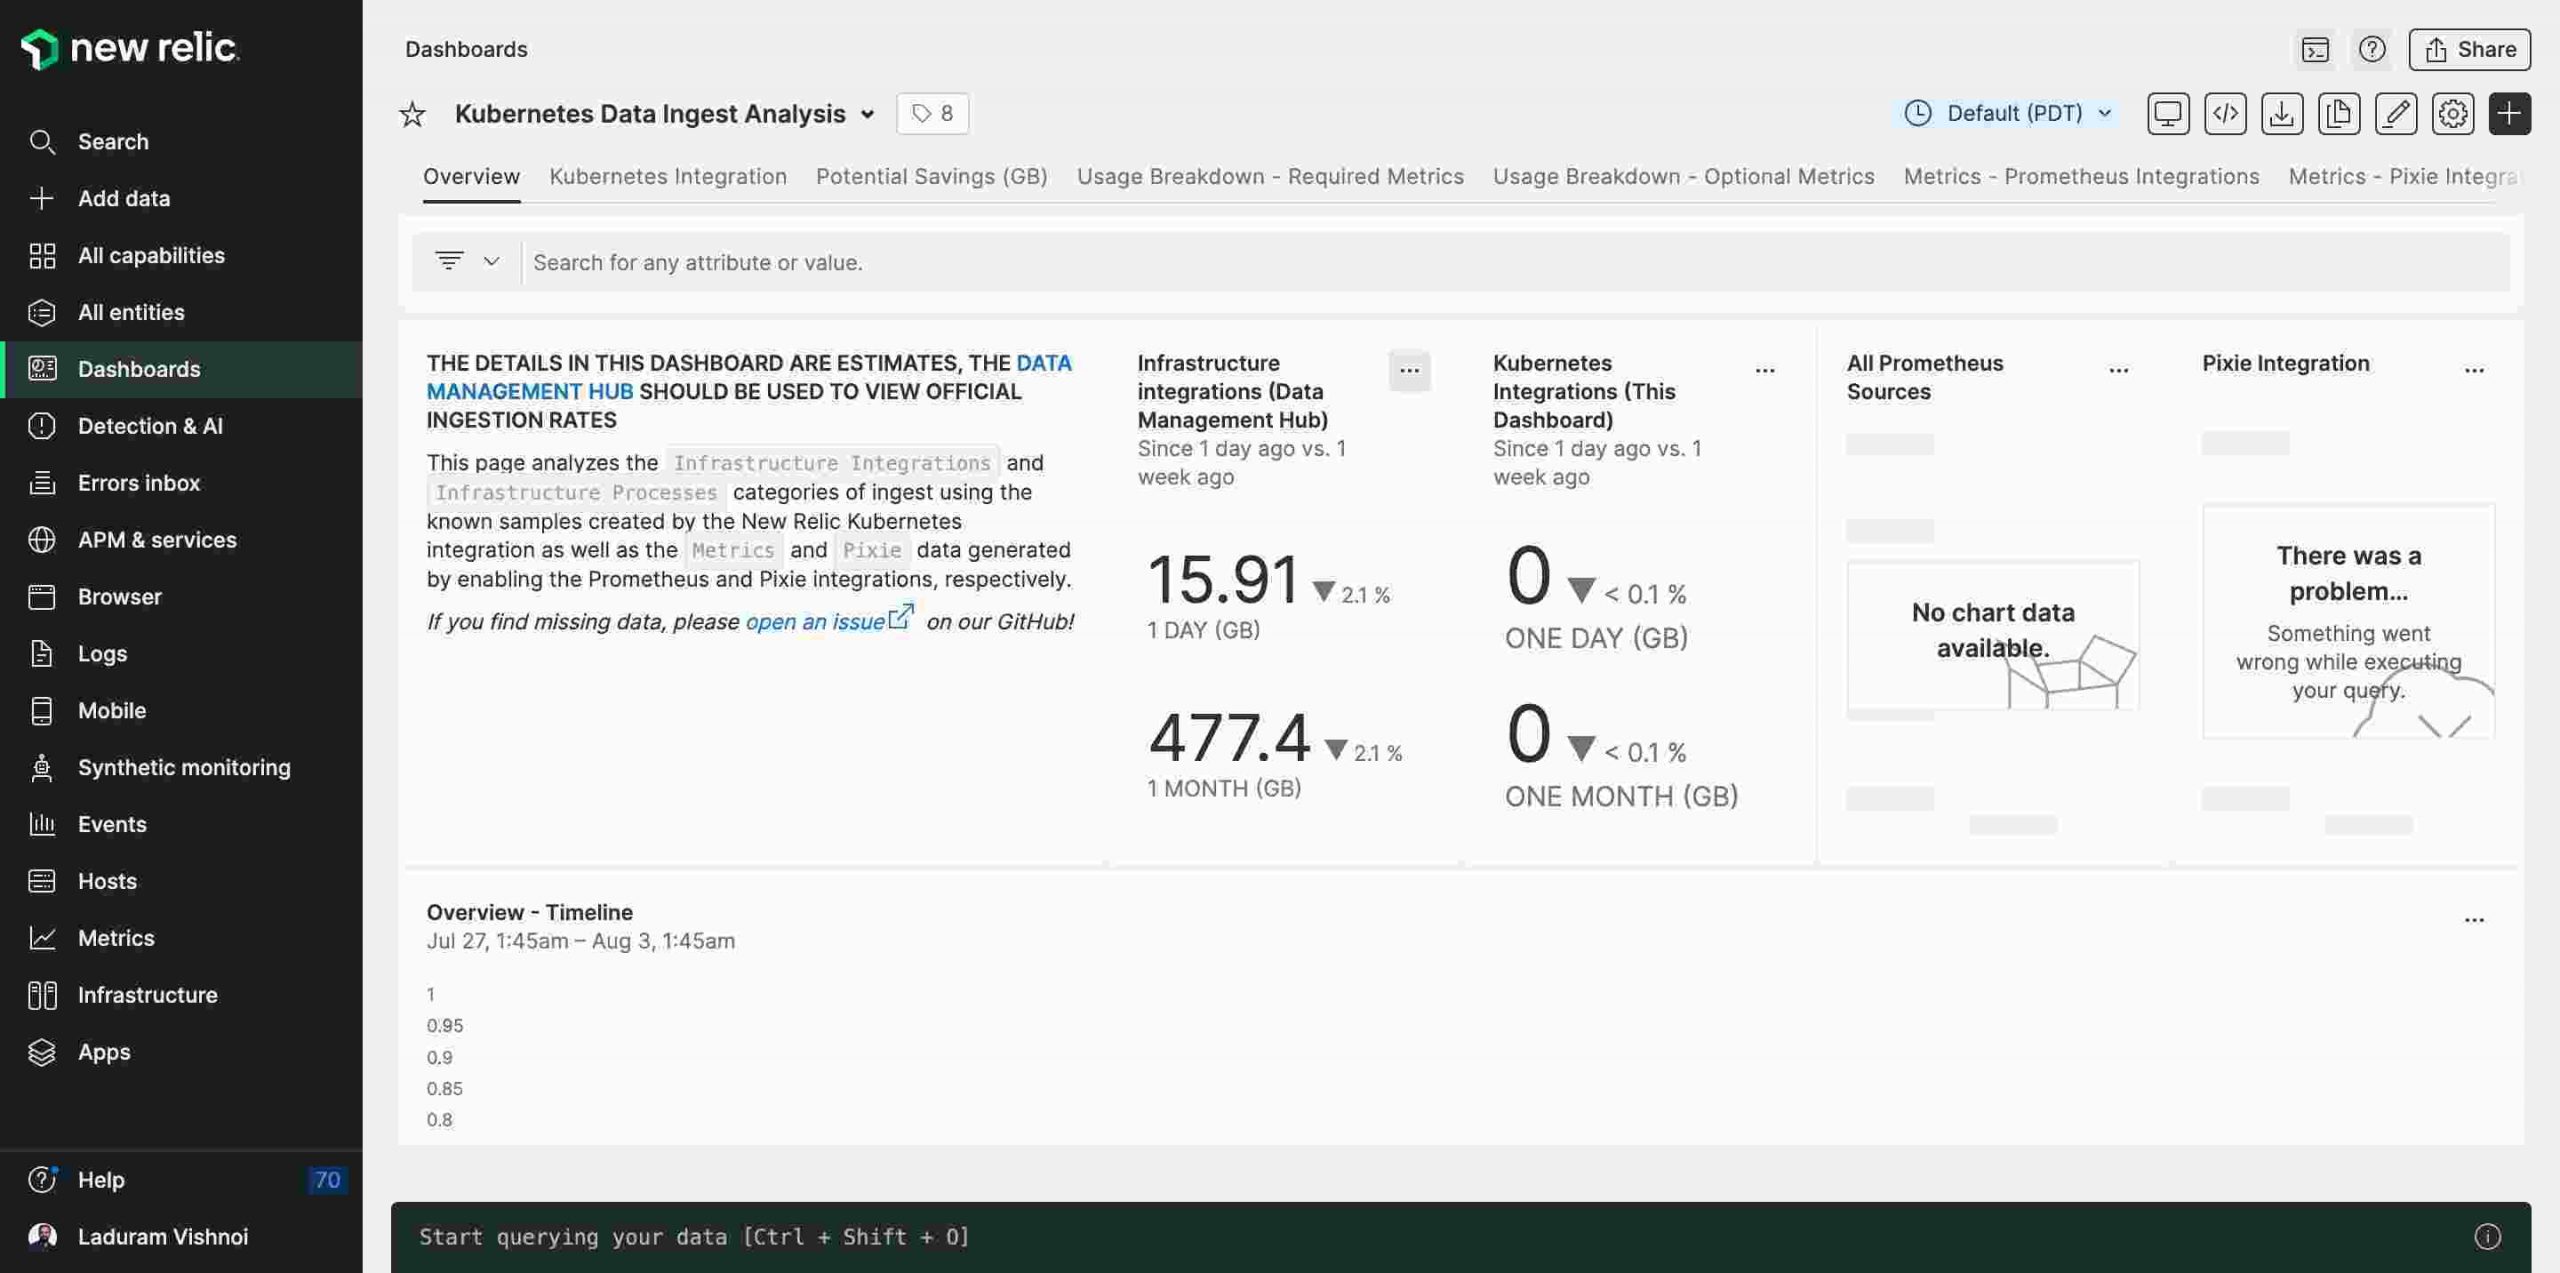
Using pre-built dashboards, you can dig into Kubernetes data and metadata. In their Kubernetes setups, teams can use the cluster explorer to investigate errors, bottlenecks, and other strange behavior quickly.
Pros
- Application performance monitoring.
- Full-Stack observability.
- AIOps capabilities provide faster issue detection, comprehension, and resolution.
- Offers 30+ capabilities at the price of one.
- Allows users to gain visibility into and insights from intra-cluster communication and latency with DNS, service, network flow graphs, and DNS.
Cons
- UX/UI can be improved
- Expensive
Pricing:
- The free tier offers 100 GB of data ingest, one full platform user, and unlimited basic users, but with limited features.
- The Standard tier costs $49 per core user, with 100 GB of data ingest, limited features, and support.
- The Pro tier is priced at $349 per full platform user, with commitment options, priority support, and advanced features.
- The Enterprise tier offers custom pricing, advanced security, priority support, and tailored solutions.
8. Dynatrace
For Kubernetes deployments, Dynatrace also offers a full-stack monitoring solution. This cloud monitoring tool allows you to keep tabs on the dependencies and connections between hosts, containers, and cloud instances and the availability and health of apps and processes.
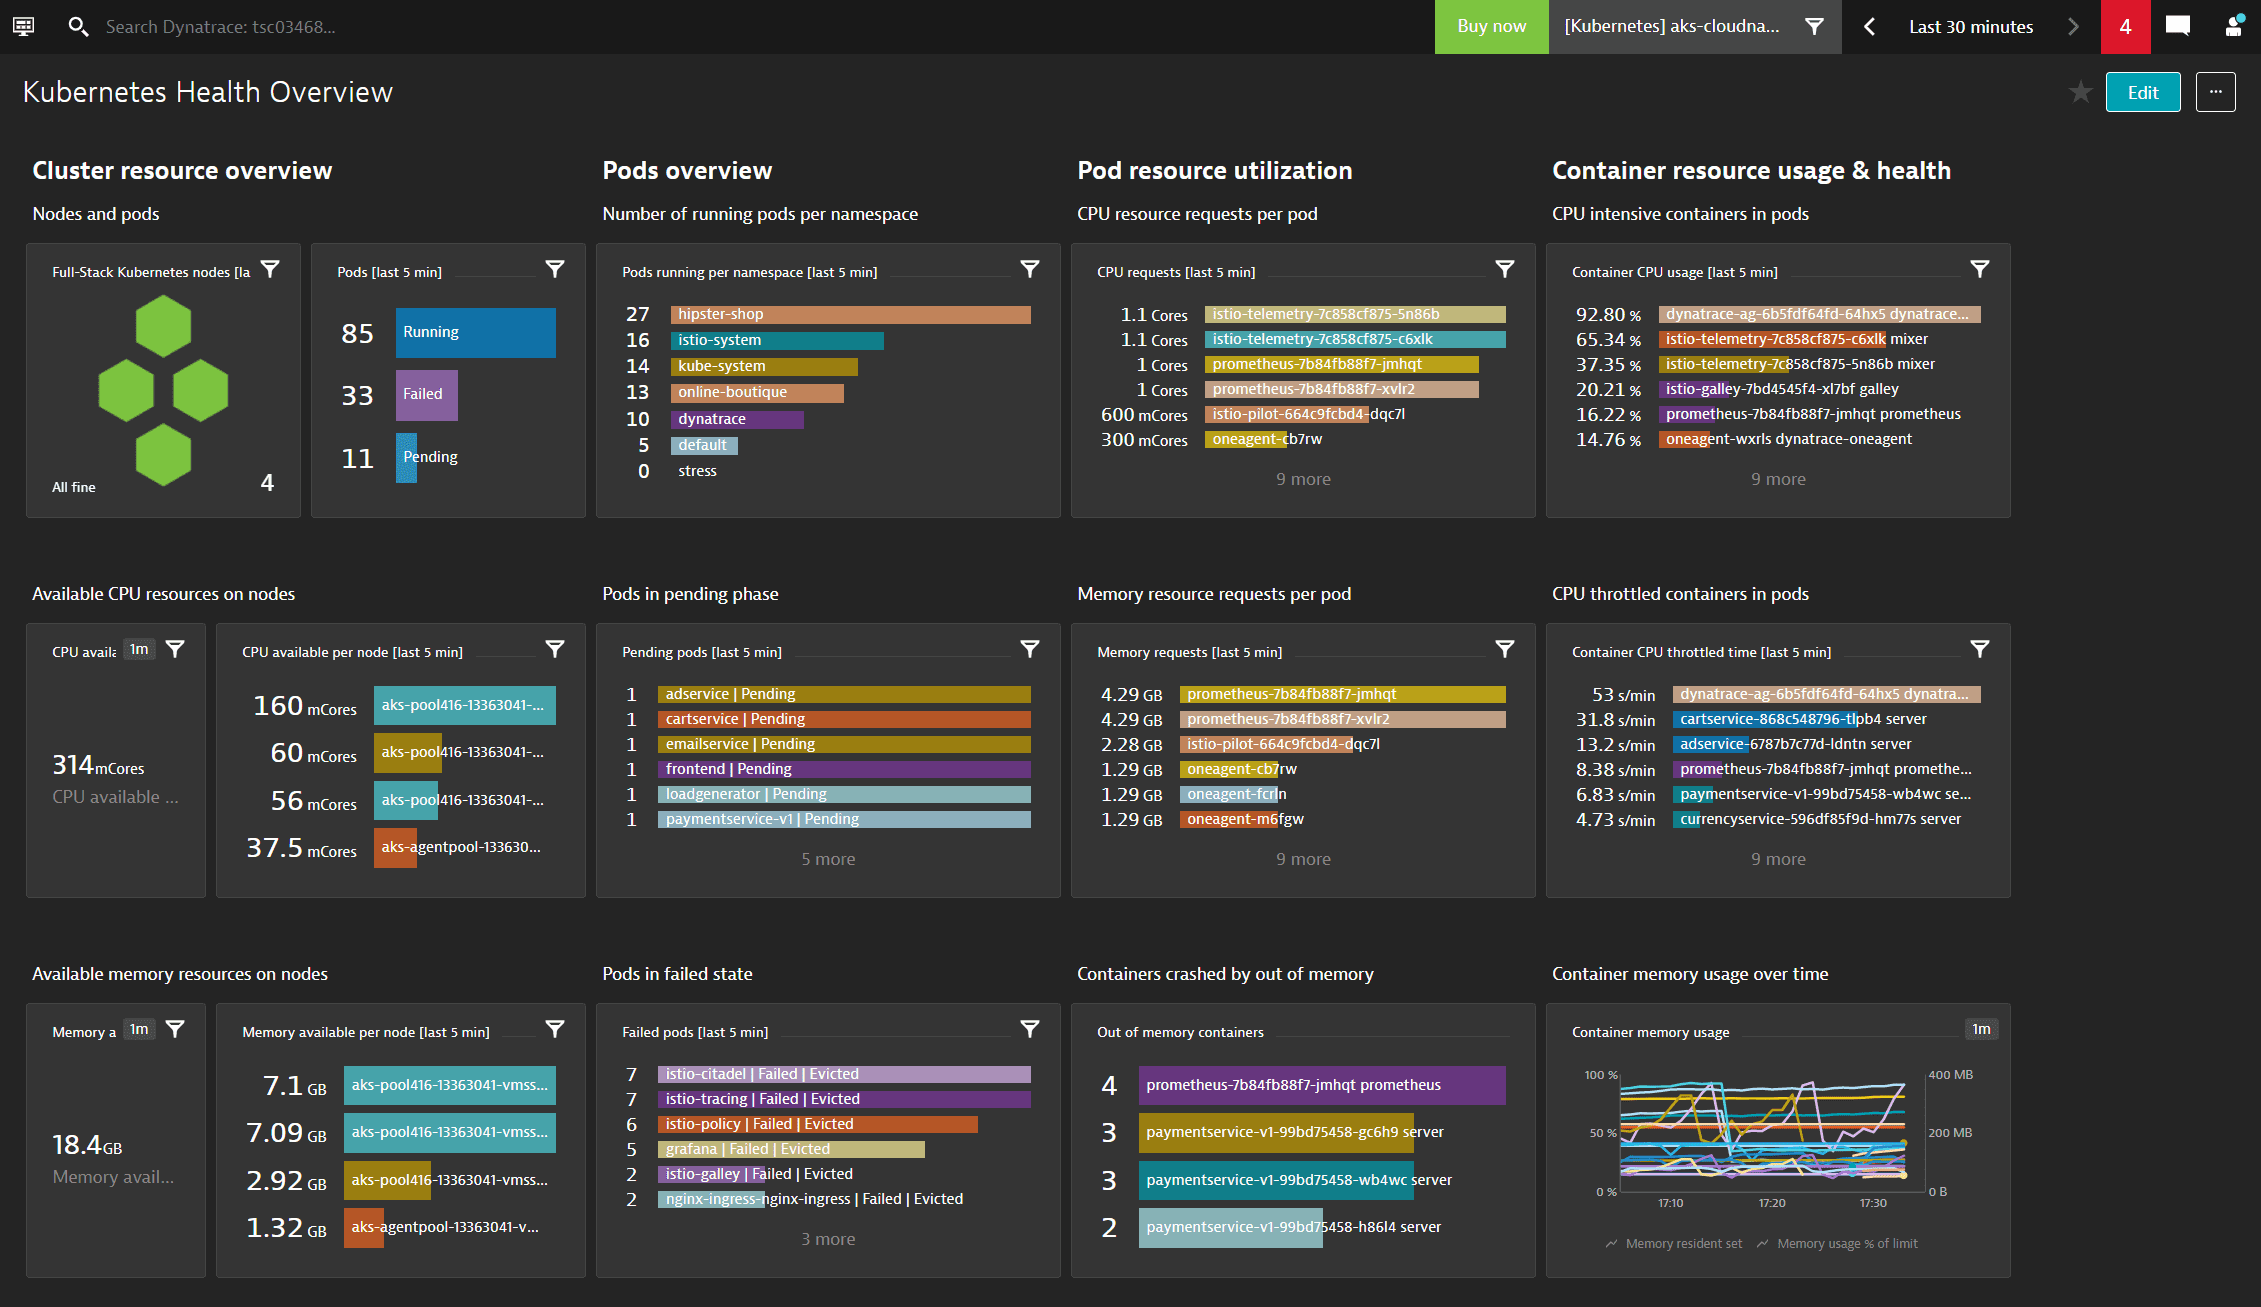
You can combine and leverage information from over 500 products, including, among others, AWS, Azure, OpenShift, Google Cloud, and Kubernetes. Even better, it reveals the inner workings of Kubernetes apps via events, traces, metrics, and behavioral data.
Pros
- Multiple integrations.
- Ease of adoption.
- Offers advanced observability using AI.
Cons
- The user interface for the management functions could be more intuitive.
- Takes time to get used to.
Pricing:
- By design, Dynatrace offers Kubernetes Monitoring as a part of its full-stack monitoring solution. It starts at $0.002 per hour for any size pod.
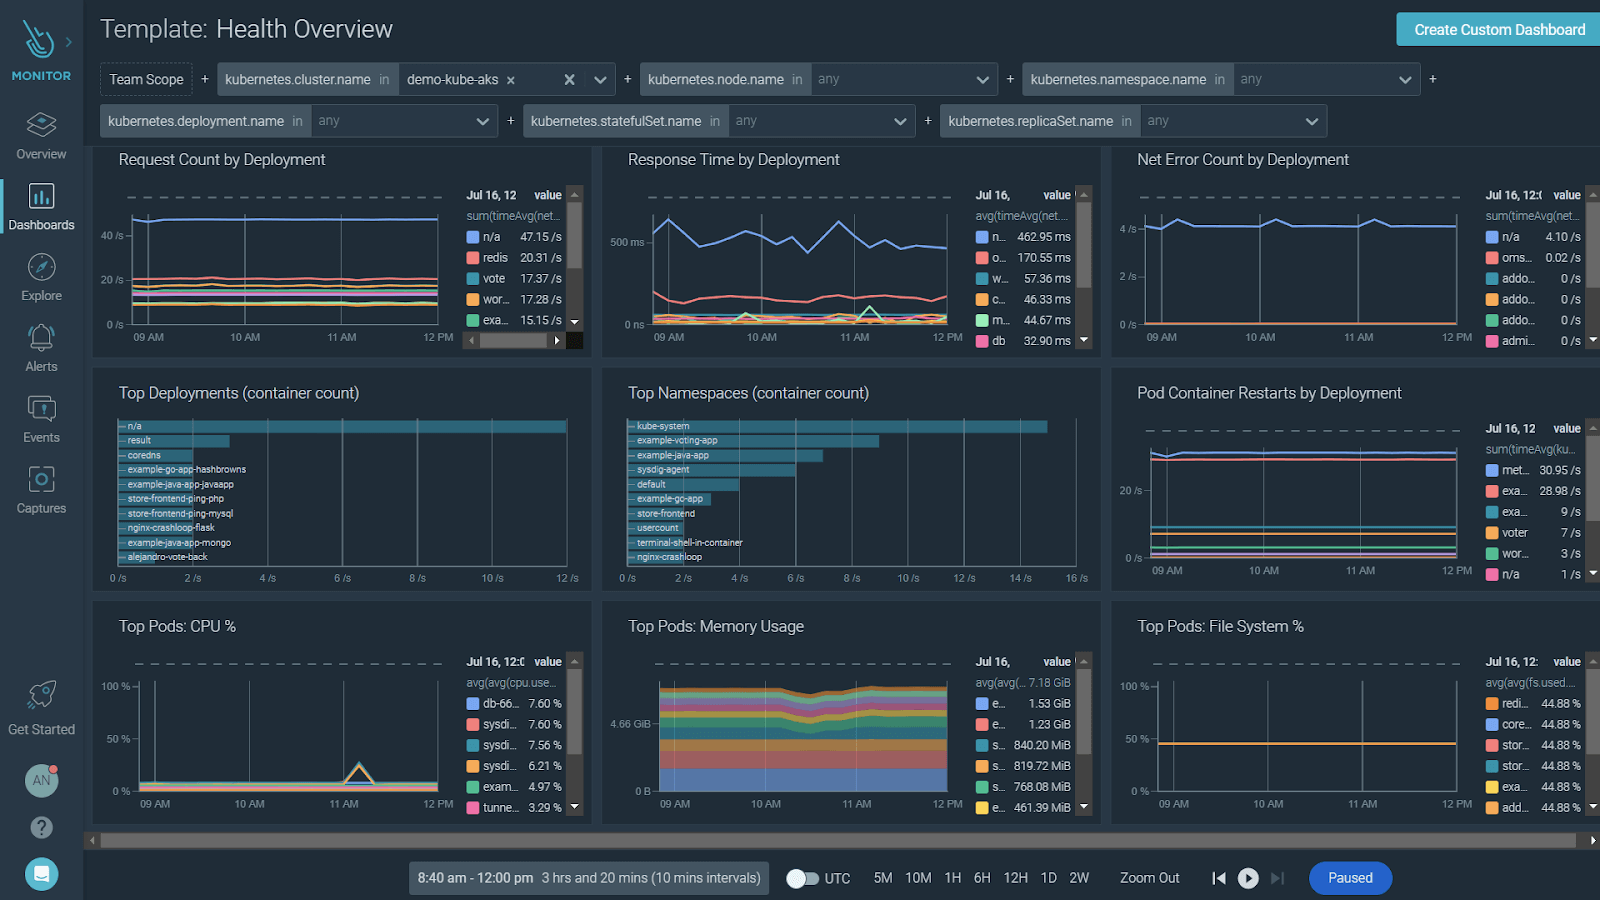
9. Sysdig
Sysdig’s Kubernetes monitoring solution is unique for its emphasis on security, troubleshooting, performance optimization, and compliance, more than basic metrics and log analysis.
It offers unparalleled visibility into containers, featuring real-time insights into their activities, including process execution, network traffic, and resource consumption. Because it’s highly scalable and flexible, Sysdig is suitable for large and complex Kubernetes deployments.
Pros
- Prioritizes security and helps identify and mitigate threats quickly.
- Offers pre-built compliance dashboards and reports for various regulations.
- It features advanced troubleshooting tools for performance optimization.
Cons
- It is slightly more expensive for large deployments.
- Some features have a steep learning curve.
Pricing
- Sysdig offers a subscription-based pricing model. The company also offers enterprise plans that are completely tailored to meet your requirements.
10. The ELK Stack
The ELK Stack is the most widely used open-source monitoring tool for logging and monitoring K8s. ELK, which stands for Elasticsearch, Logstash, and Kibana, also contains a fourth part called Beats, which are lightweight data shippers. Together, the stack’s components offer a complete and potent logging solution for Kubernetes. Each element in the stack handles a separate stage of the logging process.
Logs can be gathered and processed by Logstash before being sent to be stored. Elasticsearch will function well even when storing and searching through millions of pages because it was built to be scalable. Kibana covers the analysis interface required by users to interpret the data.
What should you be monitoring in Kubernetes?
There are plenty of metrics that can be monitored. These are typically divided into three primary categories: resource monitoring, service monitoring, and infrastructure monitoring.
Infrastructure performance
You must monitor the metrics below to determine how well your Kubernetes infrastructure performs.
CPU usage
You can gain valuable insight into cluster performance by monitoring the amount of CPU your pods are using with regard to their configured requests and limits, as well as CPU utilization at the node level. A lack of available CPU at the node level can cause the node to restrict the amount of CPU allotted to each pod, much as a pod exceeding its CPU limits.
Disk usage
Disk space is a non-compressible resource, just like RAM; hence scheduling issues with pods may arise if a Kubelet detects low disc space on its root volume. A node will be marked as being under disc pressure if its remaining disc capacity exceeds a predetermined resource threshold. You should monitor the amount of volume usage used by your pods besides node-level disc utilization. You can avoid issues at the application or service level by doing this.
Pod resources
Resource requests and limits, along with resource consumption, will provide you with a more detailed analysis of your cluster’s ability to handle existing workloads and accept new ones. It’s critical to monitor resource utilization throughout your cluster, especially for your nodes and the pods they support.
Part of pod health monitoring is tracking container exit codes. When Kubernetes scales down or evicts a pod, it sends SIGTERM first, and the container exits with exit code 143, indicating a graceful shutdown. Distinguishing this from a forced kill (exit code 137) tells you whether a pod restart was expected or a sign of instability.
Services
The best KPIs for identifying microservice concerns are those related to APIs, like request rate, call error, and latency. These matrices make it easy to find degradations in a microservice component.
Automatic detection of REST API request irregularities makes it simple to find service-level metrics. These metrics provide uniform visibility across the clusters by measuring each Kubernetes service in the same way.
Resources
To evaluate whether a cluster is underutilized or at capacity, monitor how the infrastructure and resources are used. It is crucial to keep track of node health and availability to determine whether there are enough resources and nodes accessible to replicate applications. Finally, monitor resource or chargeback utilization for each project or team.
Why is monitoring Kubernetes Important?
Proactive cluster management is made possible with the aid of Kubernetes monitoring, a type of reporting. Cluster monitoring tools make it easier to manage containerized infrastructure by keeping track of how memory, CPU, and storage are being used. When the required number of pods is not operating, resource usage is about to reach critical levels, or misconfiguration prevents nodes or pods from joining the cluster, cluster operators can monitor and get alerts.
The rapid adoption of containers in enterprise-level enterprises has benefited IT teams, DevSecOps teams, and developers globally in several ways. However, Kubernetes’ flexibility and scalability in the deployment of containerized apps also introduce additional difficulties. Without the right Kubernetes monitoring tools, it’s difficult to monitor the health of apps that have been abstracted by containers and then again by Kubernetes because there is no longer a 1-to-1 correlation between an application and the server it runs on.
1. Reliability and troubleshooting
One of the best ways to foresee issues and identify bottlenecks in a production setting is to monitor an application’s condition continuously. Cluster operators in Kubernetes monitor the cluster and provide alerts when the number of pods running, resource consumption is getting dangerously close to a critical limit, or a failure or configuration mistake stops a pod or node from joining the cluster.
Many businesses employ specific cloud-native K8s monitoring tools to get complete visibility over cluster activity besides this built-in monitoring functionality.
2. Kubernetes performance tuning
Data on the number, condition, and accessibility of different Kubernetes objects, such as pods, are released by the Kubernetes API server. Internal Kubernetes processes and components use this data to monitor whether pods are launched, maintained, and correctly scheduled for new pods.
You can get a high-level overview of your cluster’s state using these cluster state metrics. They can reveal problems with nodes or pods, alerting you to the likelihood that you need to scale back your cluster or look into a bottleneck.
3. Cost management
You can identify which services cost your company the most by checking that resources in your Kubernetes cluster are properly tagged using labels or namespaces. Monitoring is frequently the best place to start when figuring out the return on investment of various cost-cutting measures.
Setting up an overall framework is highly advised. You must make sure that you are informed if anything unusual occurs. For instance, you’ll want to be informed if a product or service unexpectedly increases in price so that you may investigate the cause and implement changes.
4. Security
By actively monitoring clusters, containers, and namespace resource allocation, Kubernetes monitoring can assist you in enhancing security. You can monitor a variety of KPIs to maintain Kubernetes security. Kubernetes monitoring tools like Prometheus may monitor some Kubernetes metrics you can use for security. To ensure you don’t miss any security threats, tools like Grafana present metrics in many dashboards.
How to choose the right k8s monitoring tool
Given all the options at your disposal, how do you choose the best tool for your organization? Your organization’s needs will ultimately determine your choice, as was already indicated. It’s crucial to consider both your existing environment and the future state of your Kubernetes cluster while making these choices. To maintain efficient operations and get the most out of your monitoring and analytics, you must select a K8 monitoring strategy that will scale as your business expands.
Recommended Read: Top 5 Kubernetes challenges & their solutions
For your Kubernetes monitoring requirements, you have a wide range of alternatives and technologies at your disposal, all of which have robust capabilities, whether you opt for an à la carte or a platform approach.
The most crucial thing is to strive for comprehensive visibility into your systems and applications. By doing this, you can maximize Kubernetes’ potential and position IT for long-term success.
Sign up now to give Middleware a risk-free try. See for yourself if our tool can get all the right data you need in one place!
FAQs about K8s monitoring tools
What are Kubernetes monitoring tools?
Kubernetes monitoring tools are software solutions designed to monitor the health, performance, and availability of Kubernetes clusters and the applications running on them.
Which monitoring tool is best for Kubernetes?
There are many tools for monitoring Kubernetes; based on our research and considering a few unbiased reviews, Middleware, Datadog, and Prometheus are the best tools for monitoring Kubernetes.
How can I monitor Kubernetes performance?
You can monitor Kubernetes performance by examining the containers, pods, their services, and other characteristics of the clusters. You can also use a monitoring tool like Middleware.
How can you monitor your Kubernetes infrastructure?
The easiest and most straightforward way to monitor your Kubernetes infrastructure is by using a K8s monitoring tool like Middleware. Other options include collecting metrics with Heapster, storing them in InfluxDB (a time series database), and visually presenting and aggregating the data with Grafana.