
Summary: Linux monitoring doesn’t have to be complicated. Install one agent, and it automatically discovers what to monitor: CPU, memory, disk, and network. Set smart alerts that only trigger when something requires attention. Combine metrics with logs to troubleshoot faster. The result? Catch issues before users notice them, prevent 80% of downtime, and stop spending hours on manual configuration.
Key Takeaways
- Reduce Linux Server downtime by up to 80% with proactive infrastructure monitoring using Middleware.
- Track the Linux Metrics: CPU, memory, disk, and network in one platform.
- Deploy Middleware in about 10 minutes with automatic discovery.
- Use smart alerts to cut noise and focus only on real Linux infrastructure issues.
- Combine metrics and logs in Middleware for complete infrastructure visibility.
If you’re not actively monitoring your Linux server infrastructure, problems don’t announce themselves. Everything looks fine until it isn’t. And when something finally breaks, you’re dealing with downtime instead of stopping it before users ever notice with proper Linux server monitoring tools.
Studies show that organizations with proactive infrastructure monitoring reduce downtime by 80% and detect issues 3x faster than those relying on reactive approaches.
This guide covers installing the Middleware agent, tracking key metrics, and setting up alerts that actually matter.
👉 Prevent Linux downtime before it starts. Start your free trial.
What Linux Metrics Should You Monitor?
Effective Linux performance monitoring requires tracking these four critical system resources: CPU, memory, disk, and network. Problems in any of these kill performance.
- CPU: High CPU usage slows everything on your server. Watch processor usage and load averages. When the CPU consistently hits 80%+ usage, you risk service degradation.
Learn how to prevent CPU overload on Linux servers before it impacts performance.
- Memory: Running out of RAM can crash apps or force your system to use slow, disk-based swap. Monitor RAM usage and swap activity.
- Disk: Slow disks create bottlenecks. Running out of space breaks service. Track read/write speeds and available storage.
- Network: Network issues cause timeouts, slow responses, and failed requests. Watch bandwidth usage, packet rates, and connection states.
Traditional monitoring tools won’t cut it. Historical data is limited, scaling gets messy, and alerts are often an afterthought. A comprehensive infrastructure observability platform automates all of that.
Proper monitoring isn’t just about collecting data; it’s about efficient server utilization that maximizes performance while minimizing costs.
For a deeper dive into maintaining optimal server performance, see our guide on Server Health Monitoring.
Linux Monitoring Tools
Traditional monitoring solutions such as Nagios, Zabbix, and Prometheus require extensive configuration and manual setup. Modern Linux monitoring systems, such as Middleware, provide automatic discovery and unified dashboards, reducing setup time from hours to minutes and offering improved visualization and alerting capabilities.
Where legacy tools focus solely on metrics, comprehensive infrastructure monitoring platforms combine metrics, logs, and traces in a single view.
Among these modern solutions, Middleware stands out for its ease of deployment and comprehensive feature set.
Follow Infrastructure Observability Best Practices
Why Choose Middleware for Linux Infrastructure Monitoring?
Middleware integrates metrics, logs, and traces into a single unified infrastructure monitoring dashboard. When you install the agent, it uses roughly 200 MB of memory and starts collecting data almost immediately, without any complicated setup.
It automatically discovers what to monitor, points it at a Linux server, and figures out which metrics matter, which processes are running, and where logs are stored.
Installing Middleware on Linux
Prerequisite
Don’t skip this part: make sure your Linux system meets the requirements and is actually supported. You’ll find the full list in the docs.
💡 New to Middleware? Check out our Guide for a complete overview.
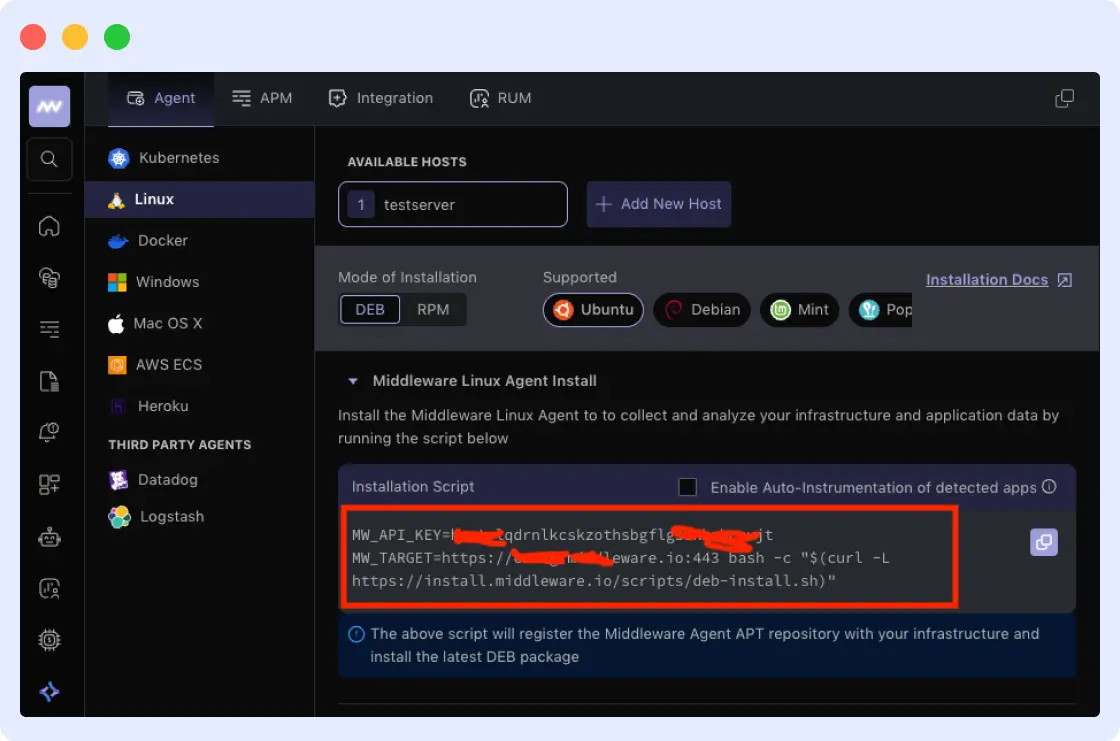
You’ll need two credentials from your Middleware dashboard (Installation → Infrastructure → Agent):
- MW API key
- MW target
The installation command shown there already includes these values. Copy and save them.
Installation Steps
This example uses Debian/Ubuntu. Other Linux distributions follow roughly the same process.
- Run the installation command
Execute this command in your terminal, replacing the placeholder values with your actual credentials:
MW_API_KEY="<mw_api_key>" \
MW_TARGET="<mw_target>" \
bash -c "$(curl -L https://install.middleware.io/scripts/deb-install.sh)"
If you copy the command from your dashboard, it should fill in the credentials for you. When you run it, the script retrieves the installation file and starts the Middleware agent. It connects to your credentials and registers as a systemd service named mw-agent.
Important: Don’t forget to actually put in your <mw_api_key> and use the full target URL, including https:// and :443.
- Verify the installation
After installation completes, confirm the agent is running properly:
You should see output indicating the service is “active (running)”. If you want to watch the agent’s activity in real-time, stream its logs:
The logs should show the agent successfully connecting to Middleware and beginning metric collection. When you’re done watching the logs, just hit Ctrl + C.
Troubleshooting Common Issues
You might run into some issues during installation, especially if this is your first time setting it up. Here are common problems and how to fix them.
- Permission Errors
This usually occurs when the installation fails or the agent fails to start due to permission issues. It needs sudo access to install system services and collect metrics.
How to fix:
- Run the installation command with a user that has `sudo` access
- Don’t run the script in restricted environments or limited shells
- If the service won’t start, check permissions and restart it:
- Multiple Agents Running on the Same Host
Sometimes, you’ll see duplicate hosts or weird metrics in the dashboard. This means multiple agents are running on the same machine.
How to fix: Make sure only one Middleware agent is installed and running. If you see more than one, stop and remove the duplicates, then restart the active agent.
Monitoring Linux System Performance with Middleware
After installation is complete, the Middleware agent starts working immediately with real-time Linux monitoring. It collects system resources, disk and network activity, running processes, and system logs. All this without any manual configuration. The agent figures out what to monitor on its own.
Once the agent is running, head to your Middleware dashboard and open Infrastructure → Hosts. If everything’s working, you’ll see your server listed by hostname.
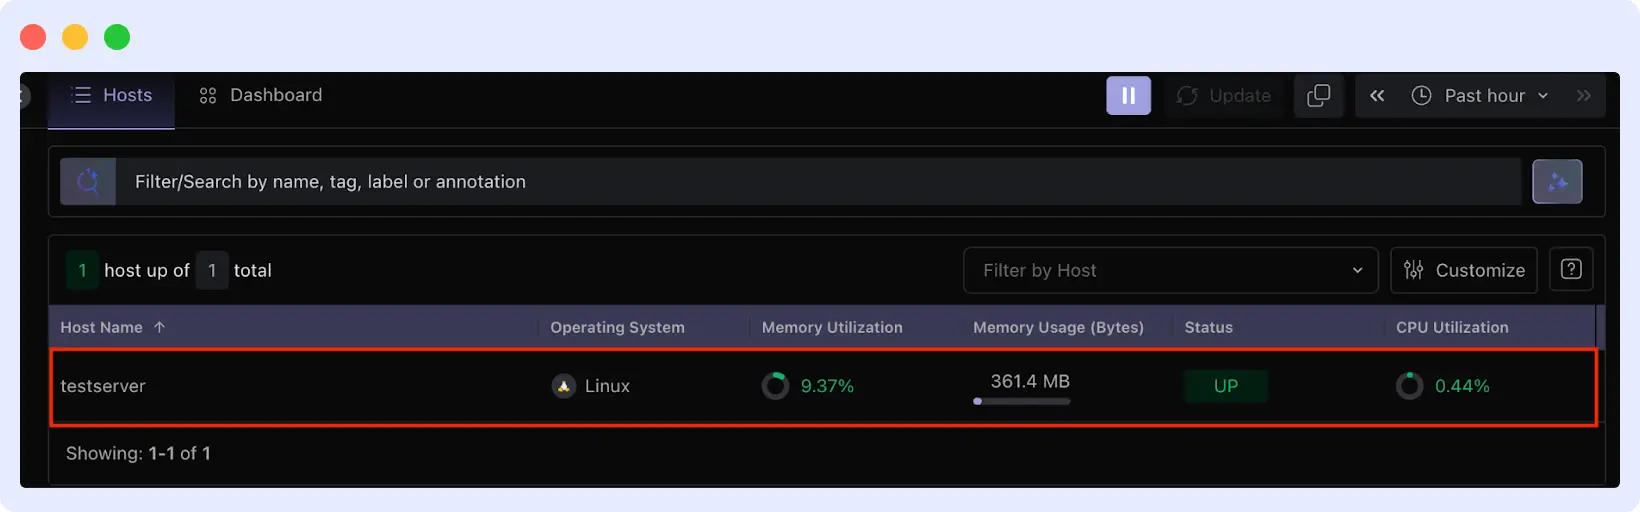
If you see your host listed, the agent is collecting data successfully. Click on the hostname to open the detailed view. This page shows everything about your system’s performance: the operating system, CPU usage, RAM consumption, and more.
What Middleware Collects from Your Linux System
The agent automatically monitors several key areas of your system. Let’s look at what data flows into your dashboard and where to find it.
- System Metrics
The Metrics tab is where Middleware surfaces real-time Linux monitoring data, including CPU, memory, disk, and network usage.
These Linux server performance metrics update continuously as data flows in, with exact values available directly from the graphs.
- Running Processes
Running processes show up under the Processes tab. You’ll see their name, ID, CPU and memory usage, and runtime. The list changes as processes start or stop.
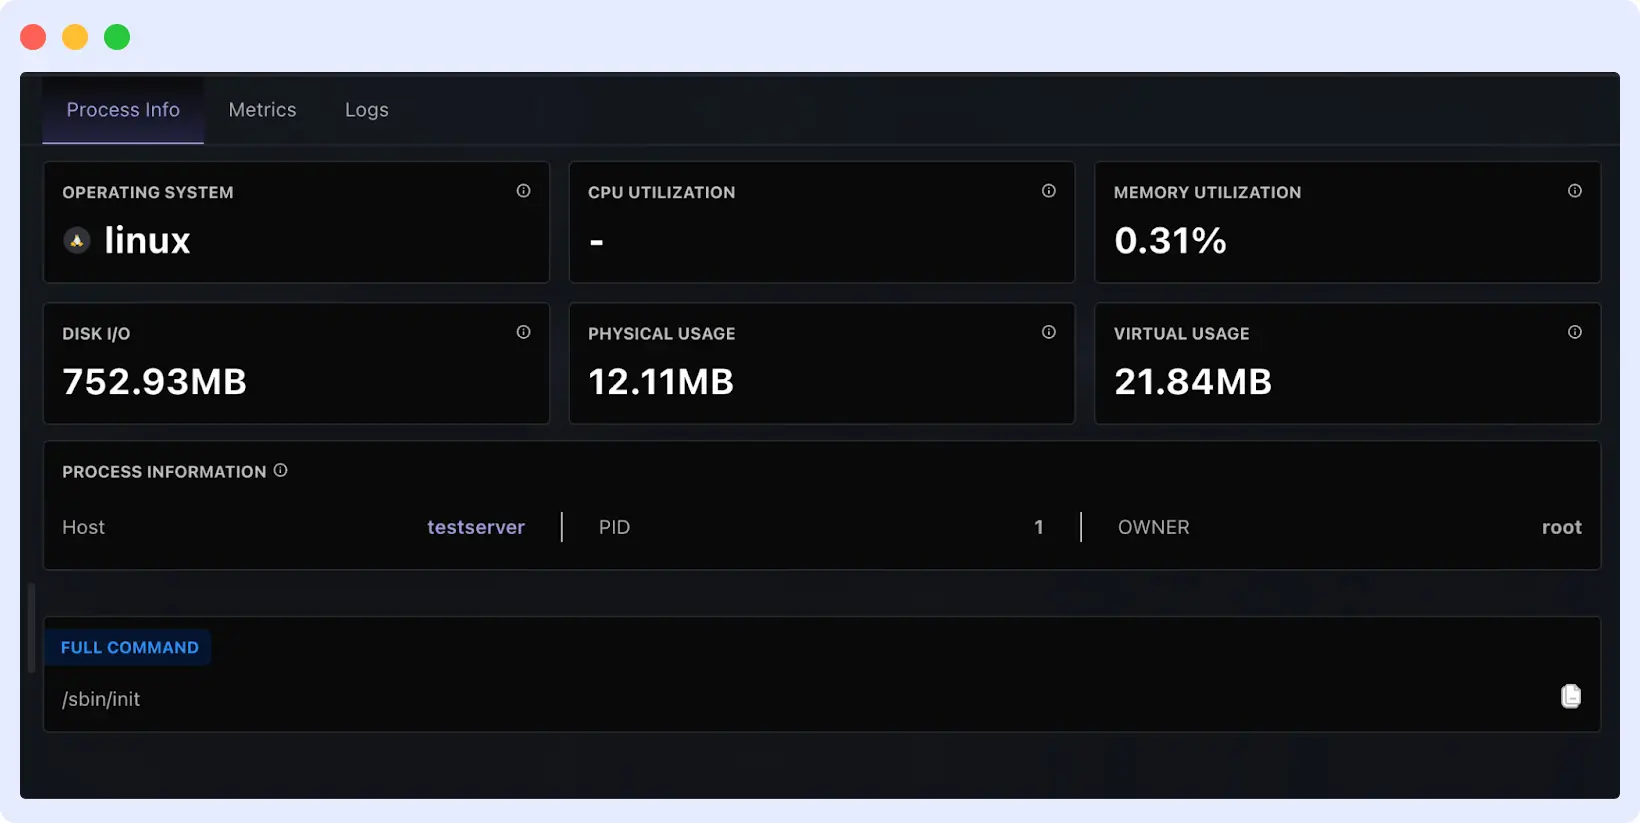
This is useful for troubleshooting. Like when your system suddenly slows down, and you need to find the cause.
- System Logs
The Logs tab collects events from your Linux system. Middleware captures system logs from syslog and journald, service start/stop events, app logs, error messages and warnings.
Each log entry includes a timestamp, so you can match events to metric changes. You can filter logs by severity level (info, warning, error) or search for specific text. The time range selector lets you focus on a particular period.
How to Set Up Linux Server Alerts
Staring at dashboards all day isn’t realistic. You need alerts that notify you when something needs attention, not false alarms that train you to ignore notifications.
Why Alerts Matter
Metrics show you what’s happening in real time with your server health monitoring. Alerts tell you when to act.
Without alerts, you’re reacting to problems after services fail. With effective server monitoring alerts, you catch issues early before they cause any damage.
The key is making alerts actionable. An alert should mean “Check this now” or “something needs fixing,” not just “a number changed.”
Configuring Alerts in Middleware
You can follow Middleware’s docs to set up alerts, including thresholds, notification channels, and testing to ensure they fire correctly.
Find the complete setup guide here: Middleware Alerts Documentation.
Best Practices for Effective Linux Infrastructure Monitoring
Monitoring doesn’t mean you should be flooded with data. It should help you identify real problems in a timely manner.
Watch Trends Over Time
Look at how metrics change over time. Is memory usage climbing steadily each day? That suggests a memory leak. Does the CPU spike every night at midnight? Probably a scheduled job. Disk filling up gradually? You need to plan for more storage.
Use the Middleware time range selector to compare current performance against minutes, hours, days, or weeks ago. Patterns reveal problems that snapshots miss.
Combine Metrics with Logs
Metrics show you what happened. Logs explain why.
See a sudden CPU spike? Check the logs from that same time period. You might find an error message, a server restart, or a failed deployment that triggered it.
Middleware timestamps both metrics and logs to facilitate correlation. When troubleshooting, always check both.
Review and Tune Thresholds
Set aside time monthly to review your alerts. Check if some firings are too often for non-issues, then raise the threshold or add conditions.
Alerts should be actionable. If you start ignoring certain alerts because they’re always false positives, fix them. Either adjust the threshold or remove the alert entirely. An alert you ignore is worse than no alert at all.
Take Action: Start Monitoring Your Linux Infrastructure Today
Start Monitoring Your Linux Infrastructure Today
Ready to implement professional-grade infrastructure monitoring? Middleware offers automated discovery, unified dashboards, and intelligent alerting, all with minimal resource overhead. Get started with Middleware’s free trial or explore the complete Linux monitoring documentation.
Conclusion
Your Linux infrastructure monitoring setup now gives you complete visibility into your servers and proactive alerts when issues arise. As your cloud infrastructure monitoring needs grow, Middleware scales with you. Simply adjust thresholds and add new services to maintain optimal performance across your entire environment.
FAQs
How many resources does the Middleware agent use?
The agent uses approximately 200 MB of memory and minimal CPU. It’s designed to run on production servers without impacting performance.
Can I monitor multiple Linux servers with one Middleware account?
Yes. Install the agent on each server using the same API key and target. All servers will appear in your dashboard under Infrastructure → Hosts.
What happens if the agent loses connection to Middleware?
The agent buffers data locally and resends it once the connection is restored. You won’t lose metrics during temporary network issues.
Do I need to configure what metrics to collect?
No. The agent automatically discovers and collects system metrics, processes, and logs. You can add custom metrics later if needed.
How do I monitor CPU usage on Linux servers?
Install a monitoring agent like Middleware that automatically tracks CPU metrics, including processor usage, load averages, and per-core statistics, in real-time dashboards. The agent requires no manual configuration and begins collecting data immediately after installation.
What is the best monitoring tool for Linux servers?
Middleware provides unified infrastructure monitoring with automatic discovery, combining metrics, logs, and traces without manual configuration. It uses approximately 200MB memory and includes built-in alerting, making it ideal for production Linux environments.
How to set up server monitoring alerts?
Configure threshold-based alerts in your monitoring platform for CPU, memory, disk, and network metrics. Set actionable thresholds that trigger only for real issues, not false positives. Review and tune alert thresholds monthly to maintain effectiveness.
What metrics should I monitor for Linux performance?
Monitor CPU usage and load averages, memory consumption and swap activity, disk I/O and available storage, network bandwidth and packet rates, and running processes. These core metrics reveal performance bottlenecks before they impact users.