The evolution of using microservices for modern software systems brings a new challenge: monitoring microservices.
At first glance, microservice monitoring is no different from monitoring a monolith. But as the number of services grows, so does the complexity, making microservices monitoring a far trickier endeavour than it initially appears.
Today, we’ll break down the essentials of monitoring microservices, share best practices, and highlight tools that make the process smoother and more effective. By the end of this post, you’ll find monitoring microservices simple, no matter how complex they seem.
Transitioning from Monolithic to Microservices Architectures
Monolithic applications are straightforward. They have a single codebase that takes care of all your needs. However, the needs of an application that grows in size and complexity may not be met well with a monolithic architecture. Due to drawbacks like slower development time, technology lock-in, clunky CI/CD pipelines, etc, engineering teams often shift to a microservices architecture.
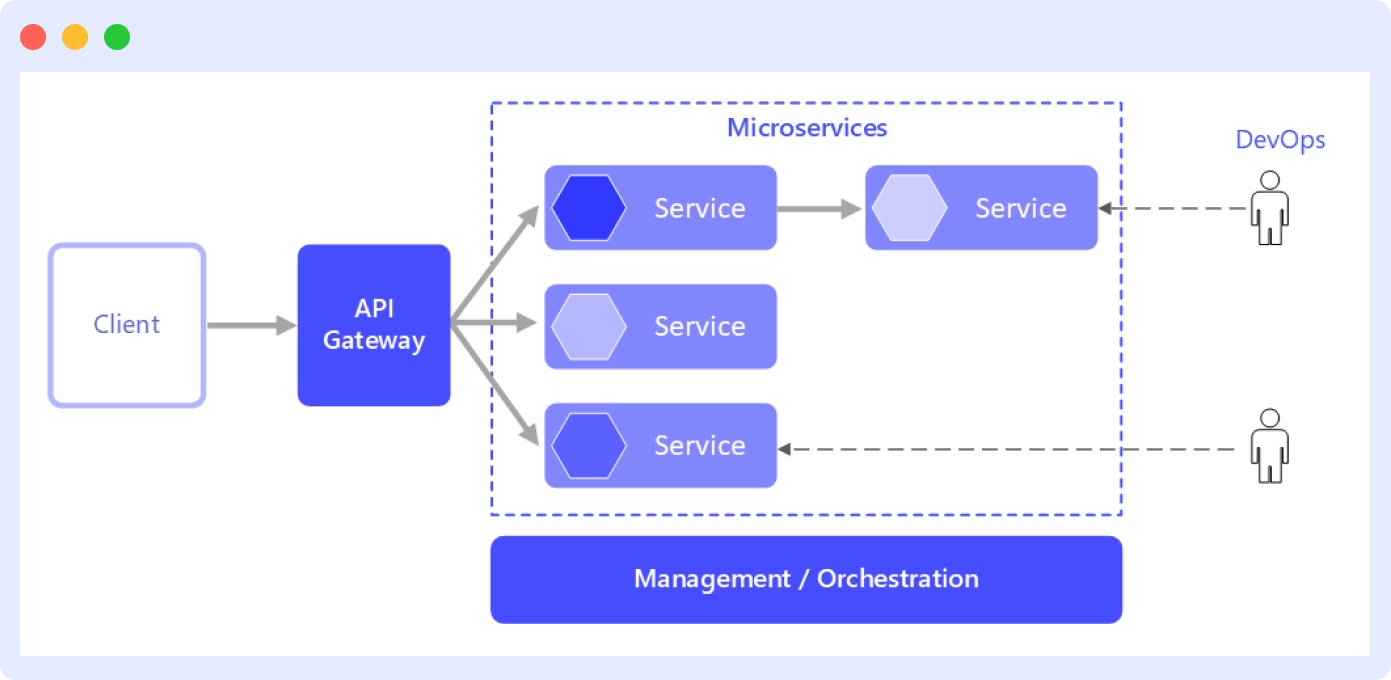
In a microservice architecture, instead of a single codebase for all your services, each service works independently in its distinct environment, having its codebase.
To gain a foundational understanding of microservices architecture, explore this guide on how microservices work.
Learn more about deploying microservice architecture in Docker.
Importance of Microservices Monitoring in Distributed Systems
As operational complexity increases and inter-service communication becomes more intricate, monitoring these services becomes not just important, but essential.
Distributed systems like microservices come with a lot of moving parts. For example, requests flowing between microservices can introduce latency, timeouts, or even partial failures. Additionally, operational complexity makes it even more challenging to narrow down issues and resolve them.
Such a complex architecture requires robust monitoring to detect and resolve issues faster, so you can fully capitalise on the benefits that microservices promise.
Discover why monitoring matters and explore key best practices every developer should know.
Key Metrics in Microservices Monitoring
Just like any monitoring system, for microservices, too, we need to first define some critical metrics. Tracking these metrics helps us understand how the microservices are performing in various aspects.
Let’s take a closer look at each of these metrics to understand how we can use them for effective microservice monitoring.
Latency
The time taken by your microservice to respond to a request, be it directly from your client-facing application or an external application, is called latency. You want your High latency indicates that your service is responding slowly, while low latency means it’s handling requests quickly and efficiently.
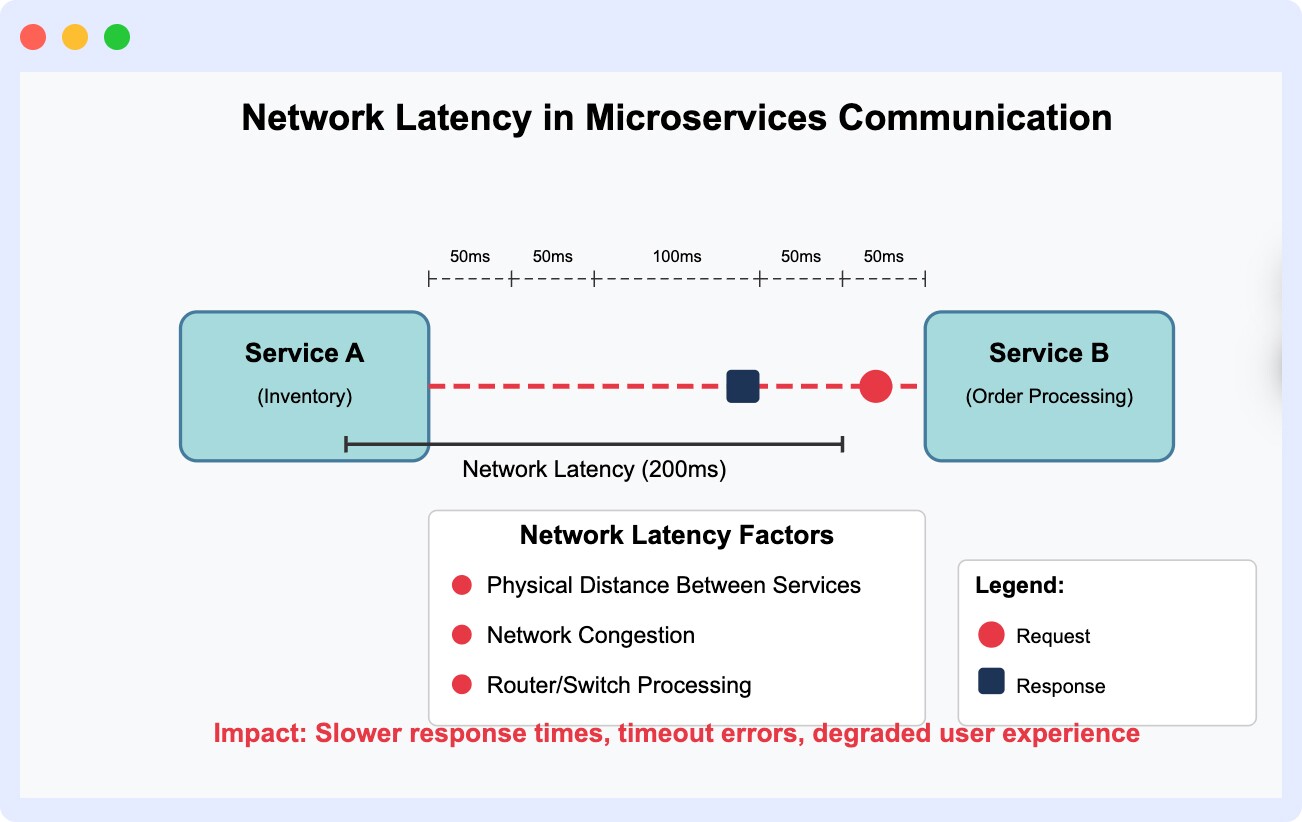
For instance, let’s say your application has a payment service that suddenly starts showing increased latency. This could lead to delays during checkout, which directly impacts your business outcomes.
However, there isn’t a one-size-fits-all latency range for any type of microservice. The P95 latency benchmark offers a reflection of the experience of 95% of users, making it a solid indicator of real-world performance. As a general rule of thumb, a P95 latency under 500 ms is considered excellent.
How Hotplate Cut Latency by 90% with Middleware
Learn how the Hotplate team optimized infrastructure, improved the user experience, and saved time by adopting Middleware’s observability platform.
👉 Read the Full Case Study
Here are some standard P95 latency ranges across common microservice use cases:
| Microservice | Typical P95 Latency Range | Example |
| Payment gateway | 100–300 ms | External payment providers like Stripe or Razorpay may influence this |
| Cart validation | 20–100 ms | Usually involves checking inventory, discounts, etc. |
| Inventory service | 10–50 ms | Needs to be fast; often backed by a cache (e.g., Redis) |
| Order creation | 50–150 ms | Includes writing to DB and possibly triggering events |
| User auth/service call | 10–50 ms | Often cached or token-based for quick access |
| Total checkout workflow | 300–800 ms | Ideally, under 1 second for good UX |
Throughput
The number of requests a microservice can process successfully in a second is termed as throughput. A real-world application can expect thousands of simultaneous requests to a single microservice. For instance, during a sale on an e-commerce store, millions of users could be hitting various microservices (for example, a microservice that fetches product details) at the same time.
A good throughput indicates that your microservices can handle request loads under abnormal circumstances smoothly. You can ensure a seamless experience for your users by monitoring your microservices’ throughput to understand how they behave during peak times.
Throughputs vary for microservices depending on the context of their use case. For example, a typical throughput for an authentication microservice would range from anywhere between 100 requests per second to 1000 requests per second.
Error Rate
Error rate, as the name suggests, is the rate of requests that fail or error out. It’s a direct indicator of your microservice’s health. A failed request could block your users partially or even completely from using your application.
By monitoring your microservice’s error rate, you can detect error rate spikes and take necessary measures to ensure your users can use your application as intended.
Take, for instance, a microservice responsible for updating user profile settings. A spike in its error rate could point to several problems, such as a failed database query, a misconfigured third-party dependency, a bug in the code, etc.
Monitoring the error rate can help us take necessary measures to reduce a high error rate. Any user-facing microservice should ideally have an error rate of less than 0.1%.
CPU and Memory Utilisation
Thank God for the loosely coupled nature of microservices; one failing service won’t necessarily take down your entire application. However, the impact of an outage for one of your microservices can still be massive. Oftentimes, time-based resource usage is the primary reason behind a microservice outage.
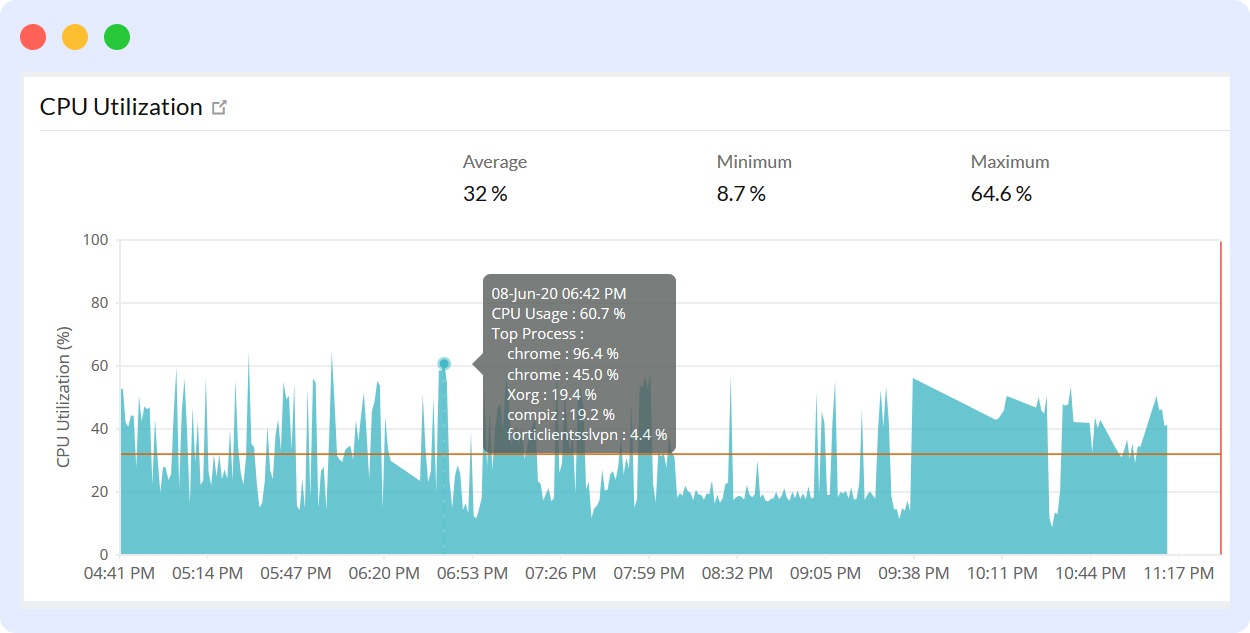
Take, for instance, a social media application with a notification microservice. Let’s say a spike in user activity due to a trending post or a viral campaign prompts the notification service to suddenly start consuming excessive CPU or memory. This could lead to performance issues with your notification service or might even crash it altogether, leading to a complete blackout of notifications for your users.
This is why it can be extremely valuable to monitor resource usage like CPU and memory. Not only can you detect how your server’s resources are being allocated but also figure out the right course of action – whether to scale up, optimize your code, or rebalance traffic.
Availability and Uptime
Availability refers to the ability of your microservice to operate and serve any incoming requests successfully. Uptime is defined as the amount of time for which your microservice is up and running. Both are closely related to each other and, in the realm of microservices monitoring, are often used interchangeably. Promptly monitoring these metrics can ensure your application is accessible to users at all times.
Network Traffic
Network traffic gives you a sense of the type and amount of requests flowing through your microservice. Let’s say one of your microservices is responsible for transcoding a video for your streaming application. All of a sudden, you notice an unexpected amount of network traffic from that service.
Let’s say the service is repeatedly sending the same file, caused by a retry load or a timeout. You can now take the necessary corrective action, like fixing the faulty retry logic or allocating resources in a way that the load is re-distributed.
By monitoring your microservice’s network traffic, you can detect unusual traffic spikes, excessive chatter between various services, and any bandwidth bottlenecks for services hosted in different regions or clouds.
Inter-Service Communication
Often in a cohesive system, microservices need to interact or communicate with one another for various use cases. For example, a payment microservice may rely on an authentication microservice to verify user credentials before updating payment details.
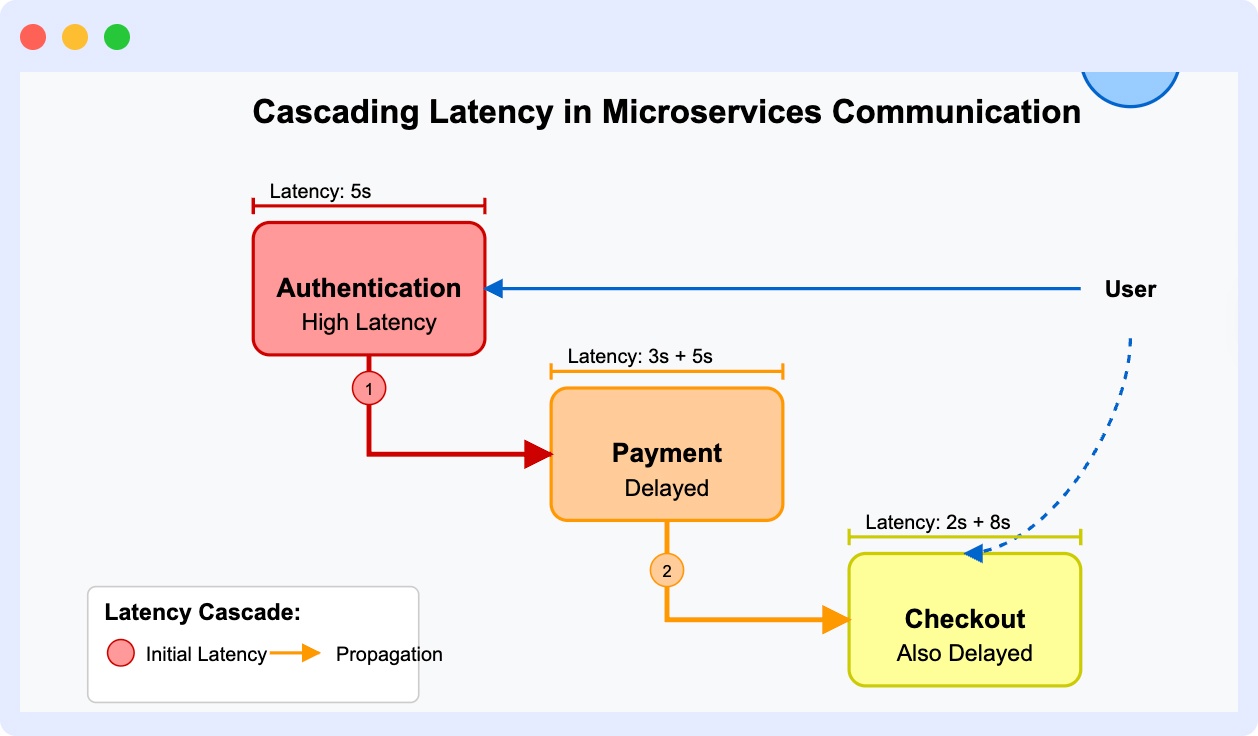
Let’s say you have an authentication microservice that is experiencing higher latency and thus takes a while to respond. Your payment microservice, which might depend on it for some data, will be delayed too.
Furthermore, your checkout microservice, which in turn depends on the payment microservice, would also be delayed. The cascading effect of repeated timeouts or latency issues can slow down your entire application.
By monitoring inter-service communication, you can keep a close eye on any unwanted patterns in these communications, such as cascaded slow response times, and take necessary action to improve your system’s overall performance.
Microservices Monitoring Best Practices
With the right metrics under our belt, let’s take a look at some of the best practices to ensure a robust microservice monitoring system.
Centralised Logging and Metrics
Logs and metrics from your microservices should have a single source of truth, a consolidated and centralized system that makes it easier to access and analyze them. Not only does this save time, but it also helps you identify issues quickly by correlating them across different microservices.
Using Distributed Tracing
Distributed tracing helps you understand how your services interact with one another and the latency across a singular request path. We’ve seen how monitoring inter-service communication can be crucial, especially to avoid cascaded slower response times.
Tracing gives you the added advantage of visualizing the journey of your requests through the various microservices, highlighting bottlenecks or problematic areas.
Set Up Alerts and Notifications
It’s important to be notified of any key performance thresholds early to take prompt action. Setting up alerts for the metrics discussed above, such as latency, error rates, resource utilisation, etc, can ensure you respond rapidly to critical issues. For example, an alert triggered by high CPU usage in a service can prompt immediate investigation before user experience degrades.
Automate Monitoring Processes
Use of automated tools not only takes the heavy lifting of automatically monitoring your microservices, but it also frees up your time for analysis and optimisation of your microservices. Automated processes can include health checks and monitoring scripts, too.
Continuous Review and Optimization
A robust and fool-proof monitoring system needs to be continuously reevaluated and regularly updated. Regularly review metrics and adapt monitoring strategies as your system evolves in scale and complexity.
Continuous infrastructure monitoring and optimisation helps anticipate new challenges and maintain effective monitoring strategies over time. Regular audits and feedback loops ensure monitoring aligns with the changing landscape of your services.
Learn how to optimize your DevOps workflows with these CI/CD best practices.
Top Microservices Monitoring Tools
The final step in this guide is selecting the right microservices monitoring tool. Let’s go through some of the most popular options so you can pick the right tool to monitor your microservices:
Middleware
Middleware is a powerful monitoring tool that provides detailed insights and visibility into your microservices, simplifying the process of monitoring microservices. It significantly simplifies monitoring complexities by enabling detailed traffic analysis and seamless communication management between microservices.
Prometheus & Grafana
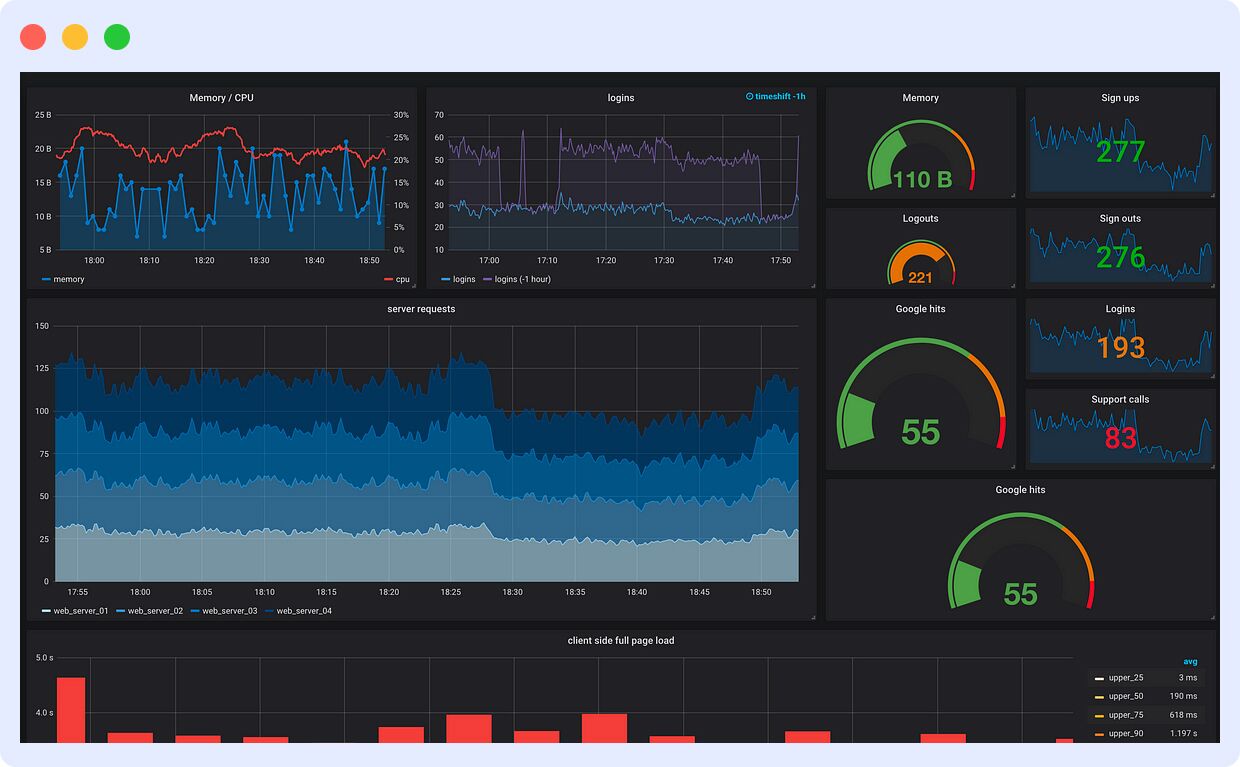
Combined, Prometheus and Grafana provide you with powerful visualization dashboards, effective metrics collection, and alerting, while being highly customizable to visualize your monitoring data effectively. The primary consideration is that you need to maintain two separate tools, which may introduce some additional overhead in terms of setup and maintenance.
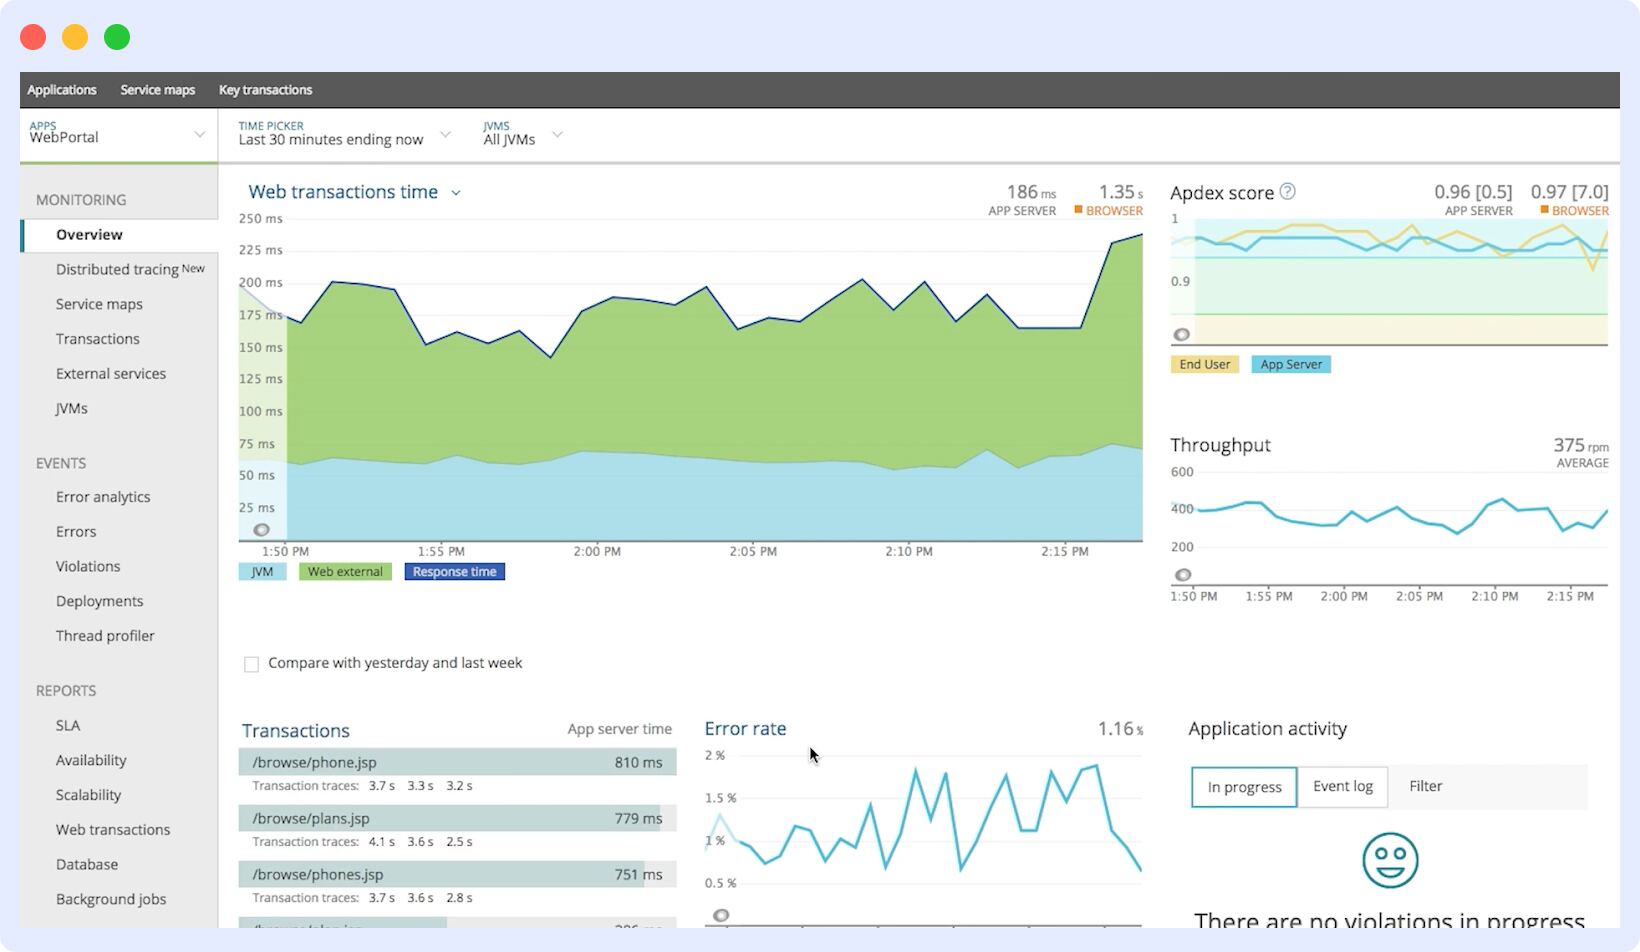
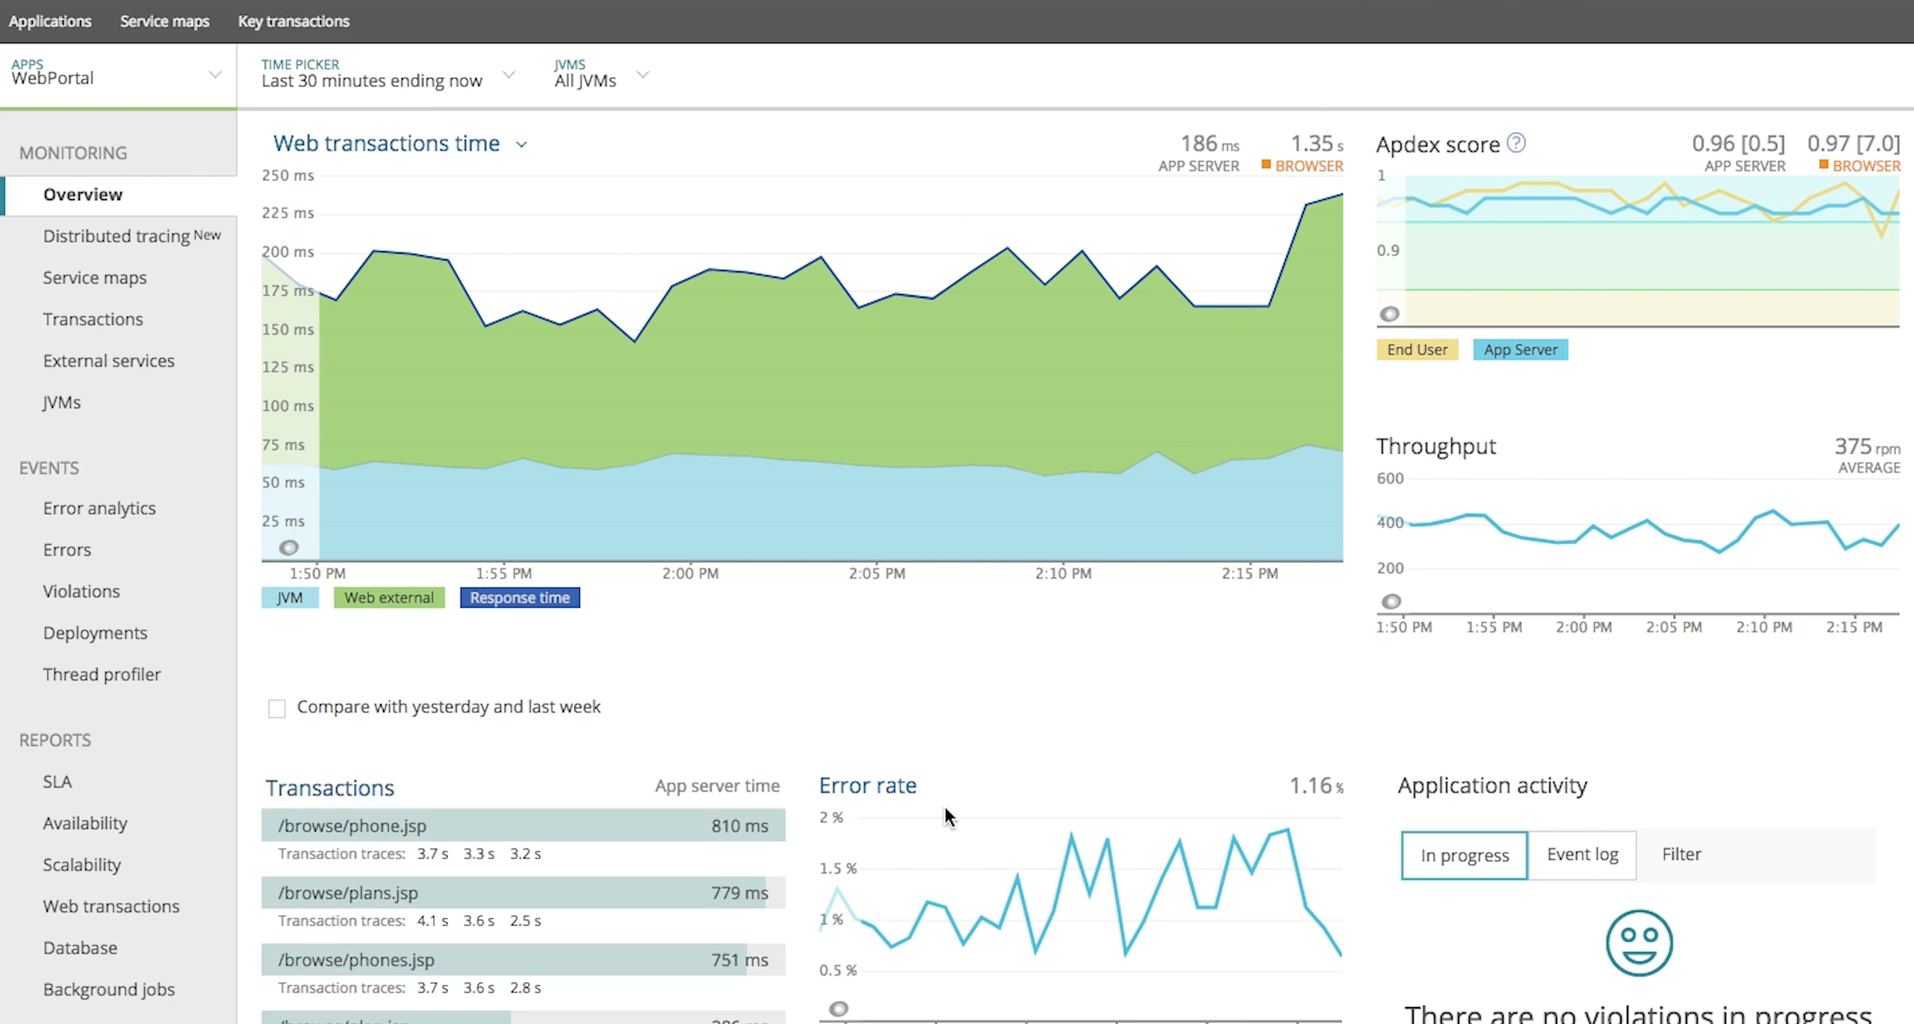
New Relic
With real-time analytics and distributed tracing, New Relic is a great microservice monitoring solution. It’s known for its ability to easily integrate with your application and provides strong vendor support. However, costs can increase significantly as your microservice monitoring needs scale.
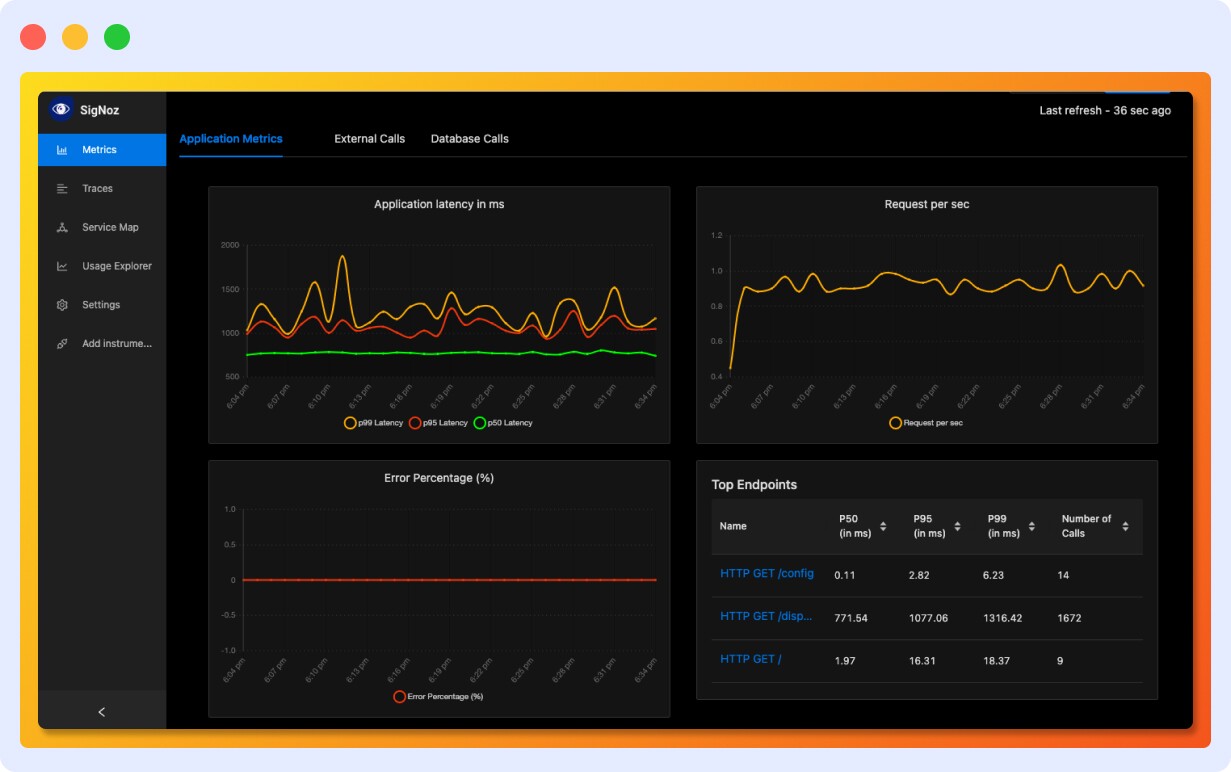
SigNoz
SignNoz is an open-source alternative to New Relic. With detailed observability into your microservices, it combines metrics, traces, and logs all into a single platform. While it’s considered to be cost-effective and flexible, it may have limited community support with respect to other alternatives.
Dynatrace
Dynatrace delivers AI-driven observability and automation, allowing proactive identification and resolution of issues while optimizing microservices performance. It offers automatic discovery of your entire technology stack with advanced AI-driven analytics for root cause analysis. However, its premium pricing structure makes it more suitable for larger enterprises with complex environments.
Microservices Monitoring in Middleware
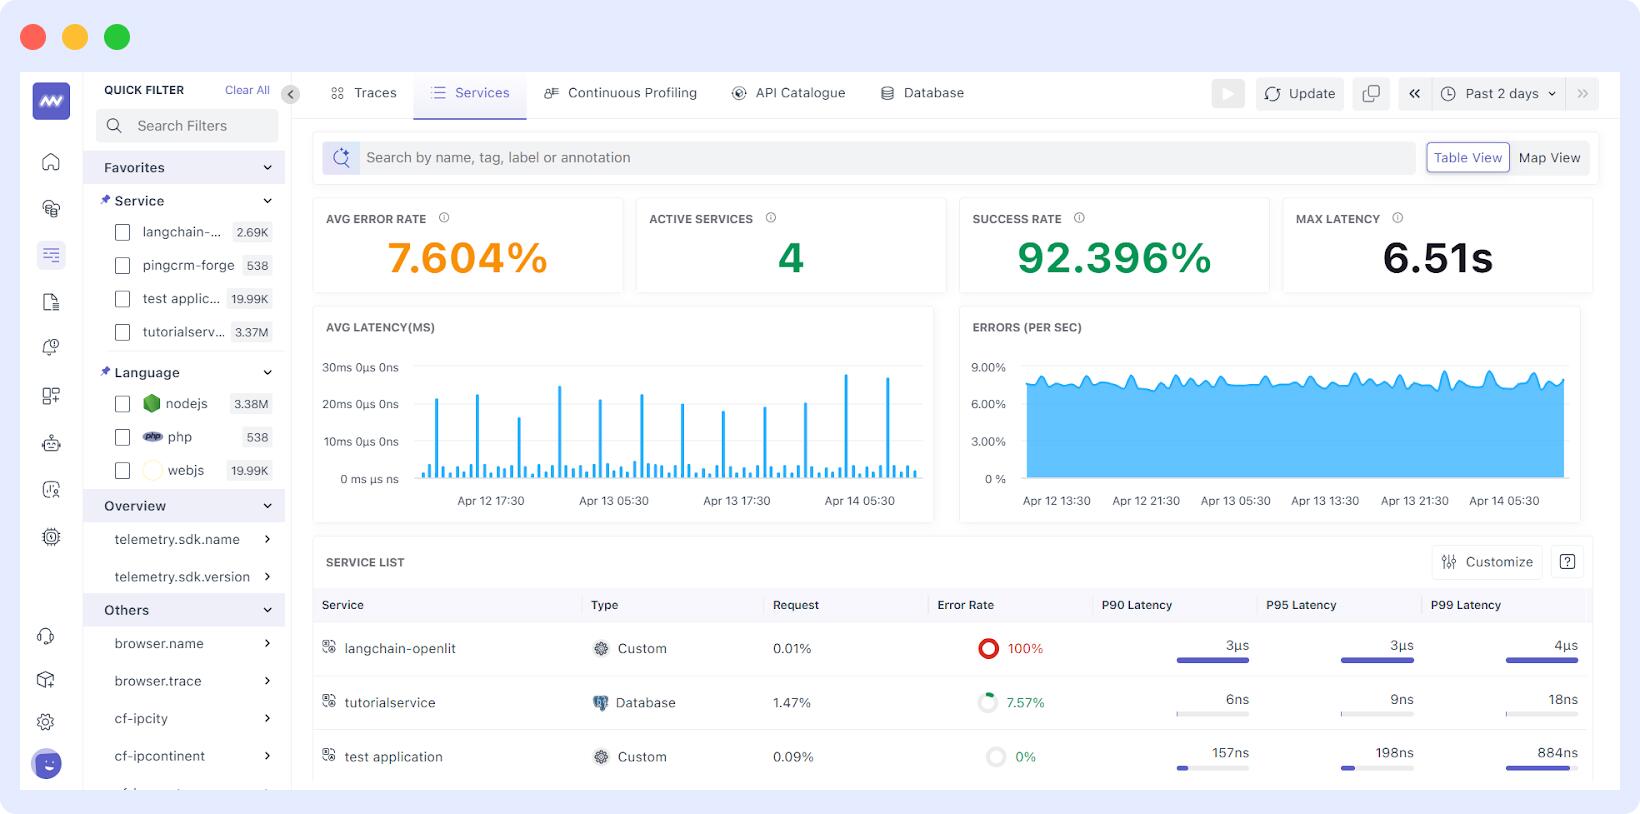
As a powerful monitoring tool, Middleware lets you monitor all the crucial metrics for your microservice, like error rate, latency, throughput, etc. It’s also very simple to set up and use.
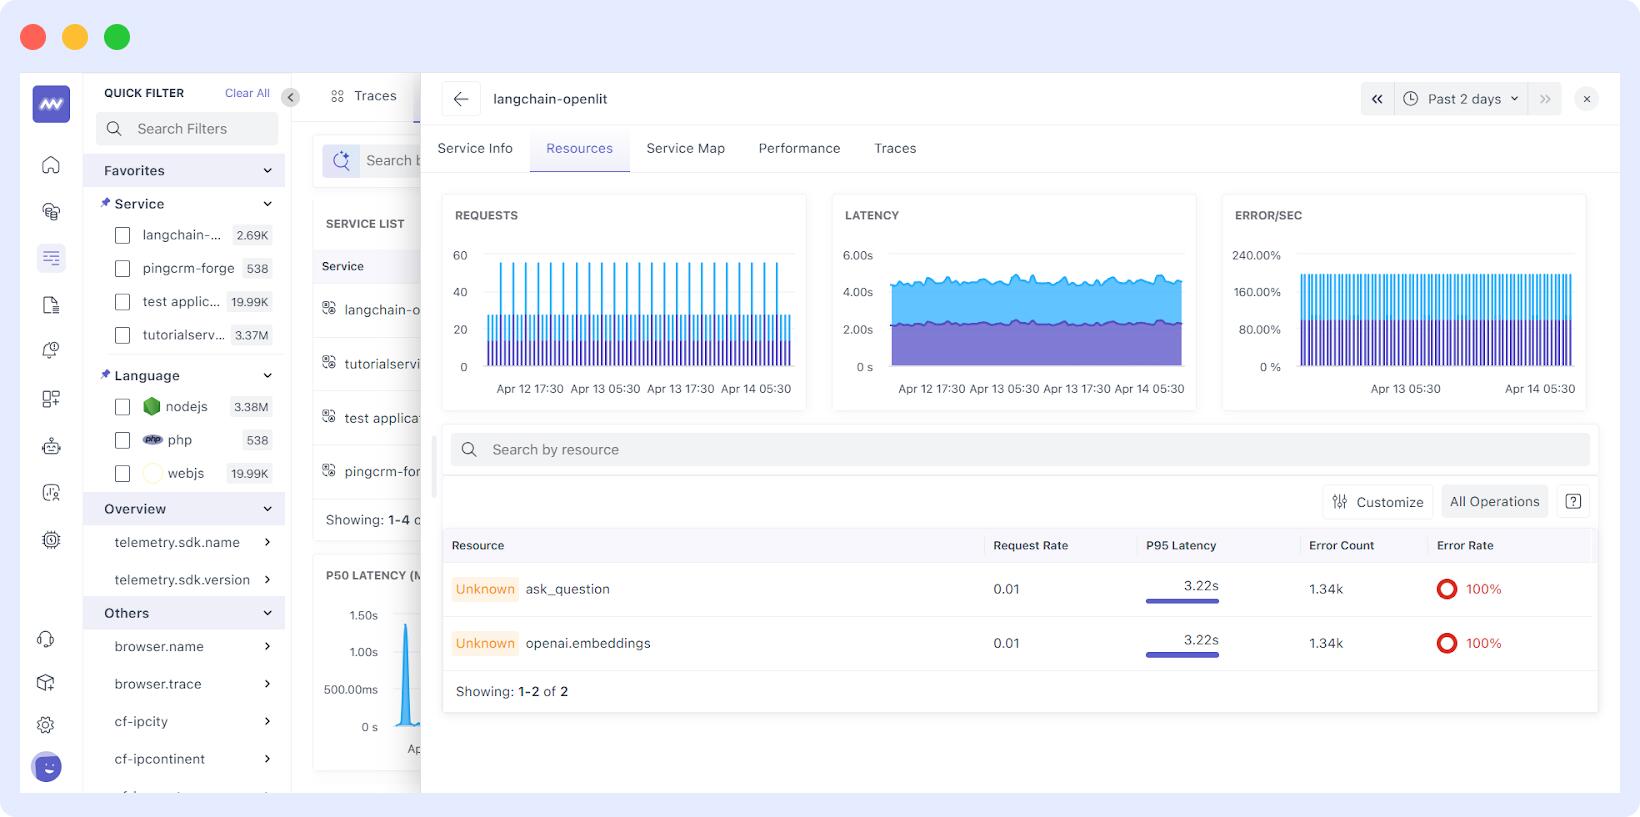
You can see all your microservices in one place alongside their key metrics and visually understand if any of your microservices need attention.
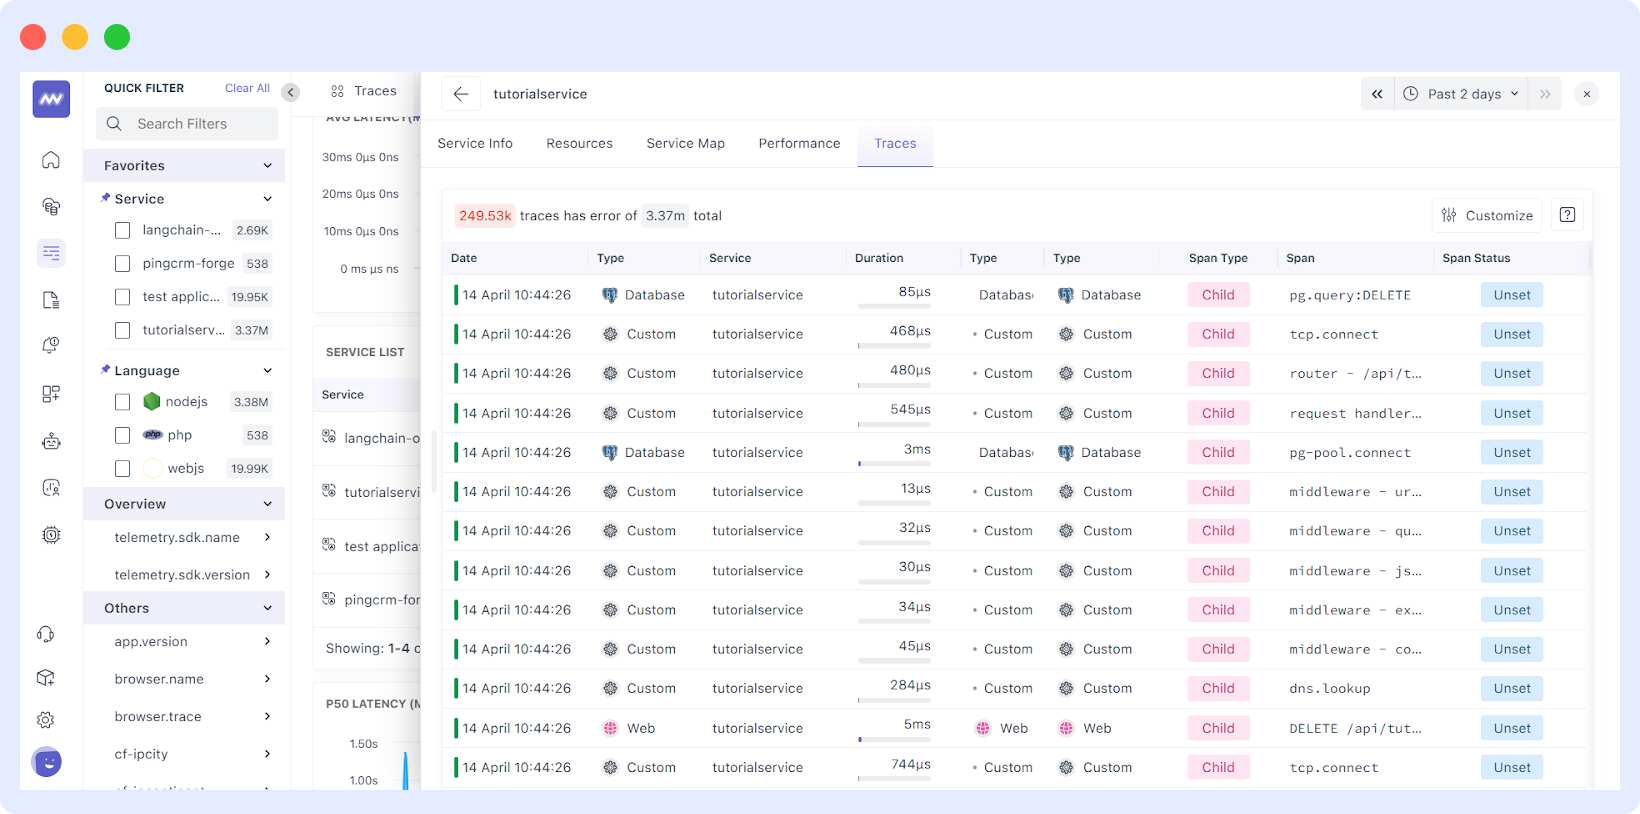
Further, you can go deeper into a specific microservice to understand how it’s performing in real-time by observing its network traffic and inspecting its service map.
You can also observe the logs and traces of a specific microservice, which can be extremely helpful in resolving issues.
Summarising Microservices Monitoring
Effective microservices monitoring will ensure that your distributed systems perform well in front of your users and remain reliable. Make sure you’re monitoring all the key metrics for your microservices, pick the right monitoring tool based on your needs, and proactively follow best practices.
FAQs
What is microservices monitoring?
Microservices monitoring is all about keeping track of how the different parts of your application are working together. In a microservices setup, your app is made up of many small, independent services. Monitoring helps you check if each service is healthy, performing well, and communicating properly with the others. By collecting things like performance data, error logs, and request traces, you can quickly spot problems and make sure your system runs smoothly for
What are the crucial metrics for monitoring microservices?
Crucial metrics for monitoring microservices are latency, error rate, throughput, uptime, availability, CPU and memory utilisation, and inter-service communication.
How does monitoring support auto-scaling in microservices?
Monitoring key metrics like CPU usage or request latency enables automated scaling policies, ensuring the system adjusts resources dynamically to maintain performance and availability.
How do you set up effective alerts in microservices monitoring?
Establish dynamic baselines and thresholds based on historical data and business requirements. Use tiered alerting (warning vs. critical) and avoid static thresholds that may not account for scaling or changing workloads.
How can you ensure your monitoring scales with your microservices?
Choose monitoring tools that are lightweight, support dynamic scaling, and automate metrics collection. Tools should adapt to the elastic nature of microservices, scaling up or down as services are deployed or removed.
What role does a service mesh play in monitoring microservices?
Service mesh provides detailed insights into service-to-service communication, automates observability, and enhances security through features like mutual TLS and traffic management.
Why is centralized logging important in microservices?
Centralized logging aggregates logs from all services into a single repository, making it easier to search, analyze, and correlate events across the system for faster issue resolution and compliance.


