As a document-oriented and flexible database, it’s a no-brainer that most developers—like you—favor MongoDB. But despite MongoDB’s industry-wide testimony of reliability, one secret sauce influences whether you’d have a seamless database experience or otherwise. That secret sauce is MongoDB monitoring.
Setting yourself up for a successful MongoDB experience only requires two things—tracking the right metrics, and using an all-round database monitoring tool.
In this article, we explain everything you need to know about these two components, and best practices you should follow.
Why is monitoring MongoDB important?
Monitoring MongoDB performance is important for five reasons:
- When you monitor MongoDB, you track resource usage; which helps you make calculated decisions about scaling. Tracking resource usage also helps you optimize your cloud spend since you now know—and can eliminate—instances and files that are not necessary but are provisioned to your database.
- Monitoring MongoDB helps you detect issues early so that you can intervene before these issues downslide the performance of your application. Similarly, you can also identify—and fix—performance bottlenecks such as slow queries and resource contention.
- Monitoring MongoDB gives you precise, cluster-level visibility into replication and sharding within your clusters so that you can identify and address replication lag, and data distribution issues.
- You gain insights into query execution and index usage, which allow you to optimize and enhance query performance and reduce response times.
- Monitoring also assists in tracking and detecting unauthorized activities within the database system and ensures compliance with security and auditing requirements.
Top 6 MongoDB metrics to monitor
Although metrics are the building blocks of your MongoDB monitoring exercise, tracking any—and every—metric is an effort as futile as attempting to store water in a basket. You must track the most important metrics to get the deserved ROI of your MongoDB monitoring exercise. Let’s examine these metrics:
1. Database operations
Database operation metrics gives you insights into the performance of your deployments within the MongoDB environment. The metrics subsumed under database operations are five—Read/Write metrics, Query and Index usage, Locking, Page Faults, Transaction Metrics.
- Read/Write metrics
This metric reflects the volume and types of operations within the database. Tracking the ratio, frequency, and distribution of these operations helps you understand the workload on your database and identify any spikes in activity. These metrics can be accessed using mongostat.
When you aggregate, insert, update, delete, and command, you’ll discover the total number of write operations in the database. In the same vein, queries and getMore aggregate reveals the total number of read operations.
- Query and Index usage
Monitoring query execution times and the frequency of slow queries usually reflects into performance bottlenecks. Furthermore, metrics such as index hit rate and the number of index key entries help you identify inefficient queries and potential areas for optimization.
- Locking
MongoDB employs locking at the database level and the collection level. Monitoring the number of lock requests and the duration of locks helps you identify contention and potential issues related to concurrency.
- Page Faults
For systems running with data size exceeding available RAM, tracking page faults help identify when data is being read from disk due to not being found in memory. High numbers of page faults indicate a need for additional memory or optimization of data access patterns.
- Transaction metrics
If you are using transactions within MongoDB, monitoring metrics related to the number of transactions, transaction response times, and transaction throughput provides insights into your transactional flow and workload.
2. Operation execution time
This metric focuses on the time taken to execute various database operations. Tracking the latency or average and peak execution times for different types of operations, such as reads, writes, and queries, provides a comprehensive view of the overall performance of your database.
It helps you identify slow-running queries along with their respective execution times. This enables you to pinpoint inefficient query patterns that need attention, and optimize them to ensure that queries and operations are running efficiently.
Also, monitoring the distribution of operation execution times across various percentiles (such as 50th, 90th, and 99th percentiles) helps in understanding the consistency and outliers in your database operation performance.
If you’re using aggregation pipelines in MongoDB, tracking the execution time and resource usage of these operations helps you optimize data processing workflows.
3. Clients or Connections
Monitoring the number of clients or connections to your MongoDB instance helps you understand how your application is interacting with the database. High numbers of connections or sudden spikes may indicate heavy application usage.
Monitoring the average duration of connections and their respective idle times will provide insights into the usage patterns of clients and help you optimize connection timeouts and resource allocation.
- Connection count & pooling
To find out the number of active clients in MongoDB, you can use the “serverStatus” command in the MongoDB shell. This command gives you access to a document called “globalLock.activeClients,” which provides information about the current client connections.
The active client count is reported at the global lock level. In MongoDB, operations can be locked at different levels—global, database, or collection—to maintain data consistency.
Also, monitoring the usage and efficiency of connection pooling highlights any issues related to connection reuse and management.
- Client metadata:
In furtherance, capturing metadata about connected clients, such as their IP addresses, authentication status, and connection duration, provides insights into the types of clients accessing the database and their behavior.
- Authentication & Network metrics:
Monitoring the rate of failed authentication attempts or unauthorized connection requests may help identify potential security threats and issues with client authentication.
Likewise, tracking the volume and types of network traffic originating from connected clients helps you understand the communication patterns related to client interactions with the database.
4. Resource utilization
This metric involves monitoring the utilization of CPU, memory, and disk resources on the server hosting your MongoDB instances. Tracking resource utilization helps you identify capacity issues and take proactive measures to address them.
- CPU & Memory usage
Keeping a tab on CPU usage provides insights into the processing load on the database server. It helps identify capacity issues related to computational resources. Also, monitoring both physical and virtual memory usage enables you to understand the memory requirements of MongoDB and highlight issues related to memory constraints and swapping behavior.
- Disk I/O
Capturing metrics related to read and write operations on disk, as well as disk latency reveals storage performance and issues with disk I/O bottlenecks. This goes with tracking file system metrics, such as disk space utilization and file system fragmentation, which helps in ensuring that the underlying file system has sufficient space and is not suffering from fragmentation-related performance degradation.
- Network throughput
Network traffic and throughput is also a key metric that gives insights into communication patterns and help with network-related issues. This includes the usage of threads and connections within the MongoDB server, which helps ensure that the server is effectively managing client connections and internal operations.
5. Queues
This involves keeping an eye on various queues within MongoDB, such as the read/write queue, replication queue, and operation queue. Monitoring these queues reveals the latency within the database system.
- Read/Write queue
Tracking the length and behavior of read and write queues helps you identify potential issues related to data access patterns and storage performance.
- Lock queue
Monitoring the lock queue length and lock wait times provides insights into potential contention and concurrency issues within MongoDB
- Operation queue
Capturing metrics related to the length and behavior of the operation queue provides insights into the backlog of pending operations and reveals issues related to database workload and resource contention.
- Replication queue
For systems employing replication, monitoring the replication queue length helps you ensure that replication operations are keeping up with the primary node and identify issues related to replication lag.
- Backup queue
If you are performing regular backups of your MongoDB databases, monitoring the backup queue length helps ensure that backup operations are running smoothly and identify potential issues related to backup performance and resource usage.
- Cursor queue
Tracking the cursor queue length helps you understand the efficiency of query processing and issues related to cursor management and query execution.
6. Replication and Oplog metrics:
MongoDB’s replication system enhances availability and fault tolerance. There is one primary node per cluster that sends data to the two secondary nodes. Monitoring replication lag, oplog size, and other related metrics helps in ensuring the reliability of your replica sets.
- Replication lag
Lag is the time it takes the secondary node(s) to replicate the data from the primary node. Tracking the replication lag between the primary and secondary nodes helps ensure that secondary nodes are keeping up with the primary.
It also helps you identify issues related to network latency, resource contention, or replication performance. High application lag indicates issues with replication performance.
- Oplog size
Operation log (Oplog) solely facilitates the replication operation in the MongoDB database. It saves the data changes in the primary node. Monitoring the size and growth rate of the oplog helps ensure that it has sufficient capacity to retain operations for secondary nodes to catch up during periods of high load or network interruptions.
- Oplog application rate
Capturing metrics related to the rate of Oplog application on secondary nodes helps you understand the throughput and latency characteristics of replication operations.
- Replica set status
Monitoring the status of replica set members, along with their respective replication Oplog window and sync source is vital for the overall stability and reliability of the replication process.
- Election Metrics
For systems with replica sets, tracking election metrics provides insights into the frequency and behavior of leader elections, which helps in identifying and troubleshooting issues related to automatic failover and replica set management.
Top 5 best practices for improving MongoDB performance
To boost MongoDB performance, consider these 5 recommendations:
1. Examine query patterns and profiling
Analyze your query patterns and the types of queries your application frequently makes, to ensure efficient data retrieval. Use projection to retrieve only the required fields, and reduce data transfer.
In addition, profiling helps in understanding which queries are taking the most time to execute. Use MongoDB’s built-in profiling tools to identify and optimize slow queries.
2. Review data modeling and indexing
Make sure your data model aligns with your application’s access patterns. Designing a model minimizes the need for complex joins, denormalizes data where appropriate, and facilitates efficient querying.
Then design indexes that align with these patterns, making reads more efficient. Strategically apply indexes to fields that are commonly queried. Well-designed indexes speed up query execution, reducing the need for full collection scans and boosting database performance.
3. Try embedding and referencing
Consider both embedding and referencing related data based on your application’s requirements. Embedding involves nesting related data within a single document, which reduces the need for multiple queries to retrieve related data.
This minimizes the use of joins, leading to better query performance, especially for read-heavy workloads. Referencing on the other hand involves storing related data in separate documents and referencing them using identifiers.
This is crucial when dealing with frequently updated or large related data, as it helps prevent data duplication and keep the main document size manageable.
4. Monitor memory usage
Keep a close eye on memory allocation and usage within the MongoDB environment, to ensure that the database has sufficient memory available to support its working set—the portion of data and indexes accessed during normal operations.
This helps maintain an appropriately sized working set, which minimizes disk I/O and speeds up query processing. It also prevents scenarios where the database constantly swaps data between memory and disk (thrashing), which can severely degrade performance.
5. Monitor replication and sharding
Monitoring replication involves ensuring the health of your replica sets by tracking replication lag to ensure that secondary nodes are keeping up with the primary, as well as ensuring data consistency and failover capabilities.
Monitoring sharding on the other hand involves overseeing the distribution of data across a sharded cluster.
It includes carefully selecting shard keys based on the query patterns, tracking data distribution, chunk migration, and balancing to ensure that the cluster is handling the workload effectively and that data is being distributed evenly.
Top 3 MongoDB performance monitoring tools
Middleware
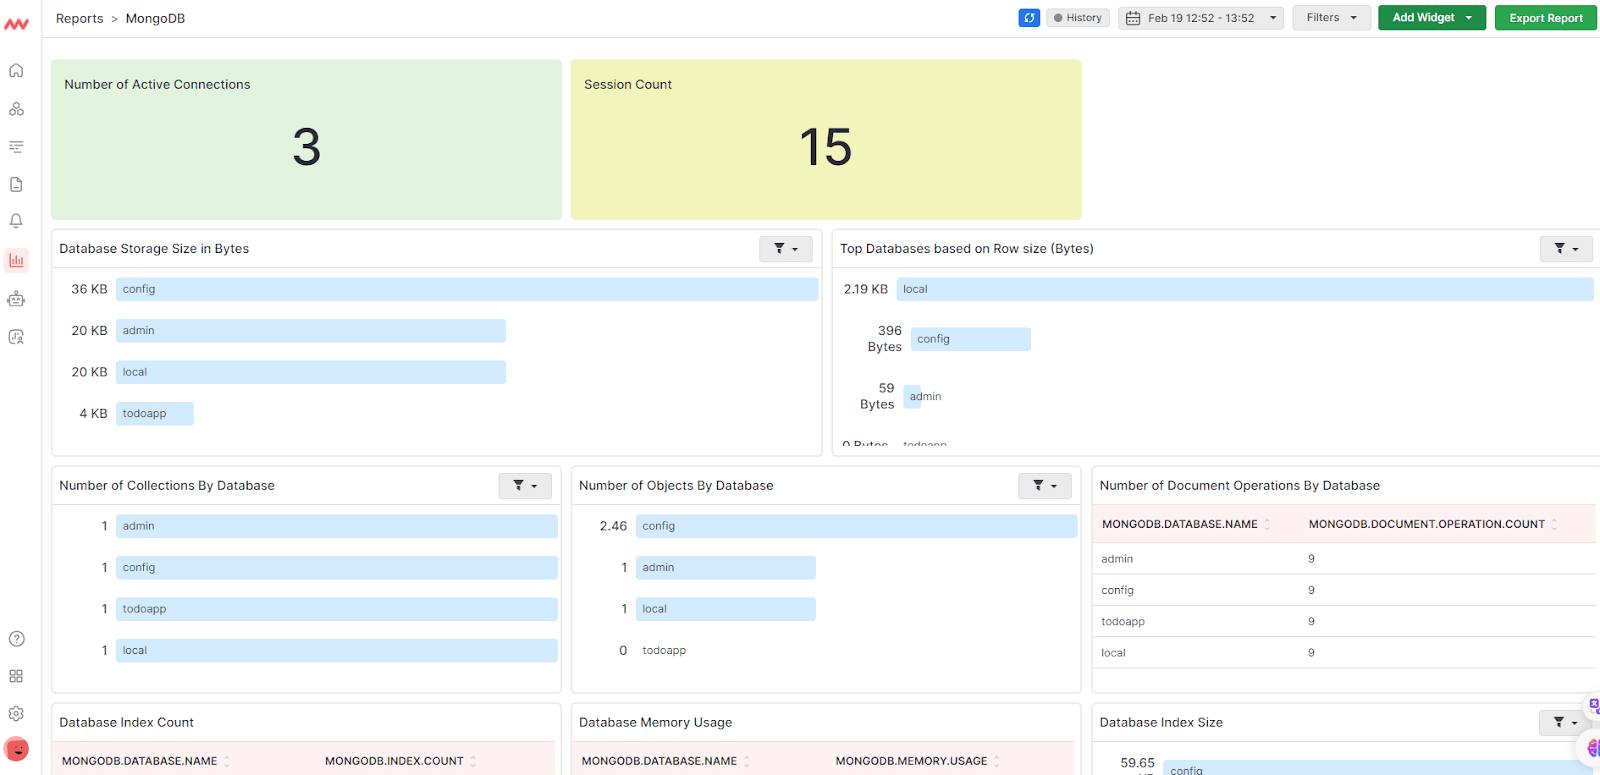
Middleware is a full-stack cloud observability platform with dashboards that offer end-to-end visibility and simplify data analysis for systems and applications.
It seamlessly integrates with MongoDB for automatic collection of metrics and displaying them in a central dashboard. You can customize the dashboard to meet your needs and ease your monitoring exercise.

Middleware also offers an smart alert system which allows you to configure alerts to trigger for anomaly detection and to notify you when certain set thresholds are passed. With Middleware, you’ll swiftly identify and fix issues across your MongoDB instances.
Middleware supports all the key MongoDB metrics in addition to mongodb.collection.count, mongodb.global_lock.time, mongodb.index.count, mongodb.memory.usage, and mongodb.operation.latency.time, among others.
Additionally, the platform offers a causation to correlation feature that spots when an issue begins and where it ends.
Check our docs to learn more about how to monitor MongoDB with Middleware.
Get started with MongoDB monitoring for free.
Datadog
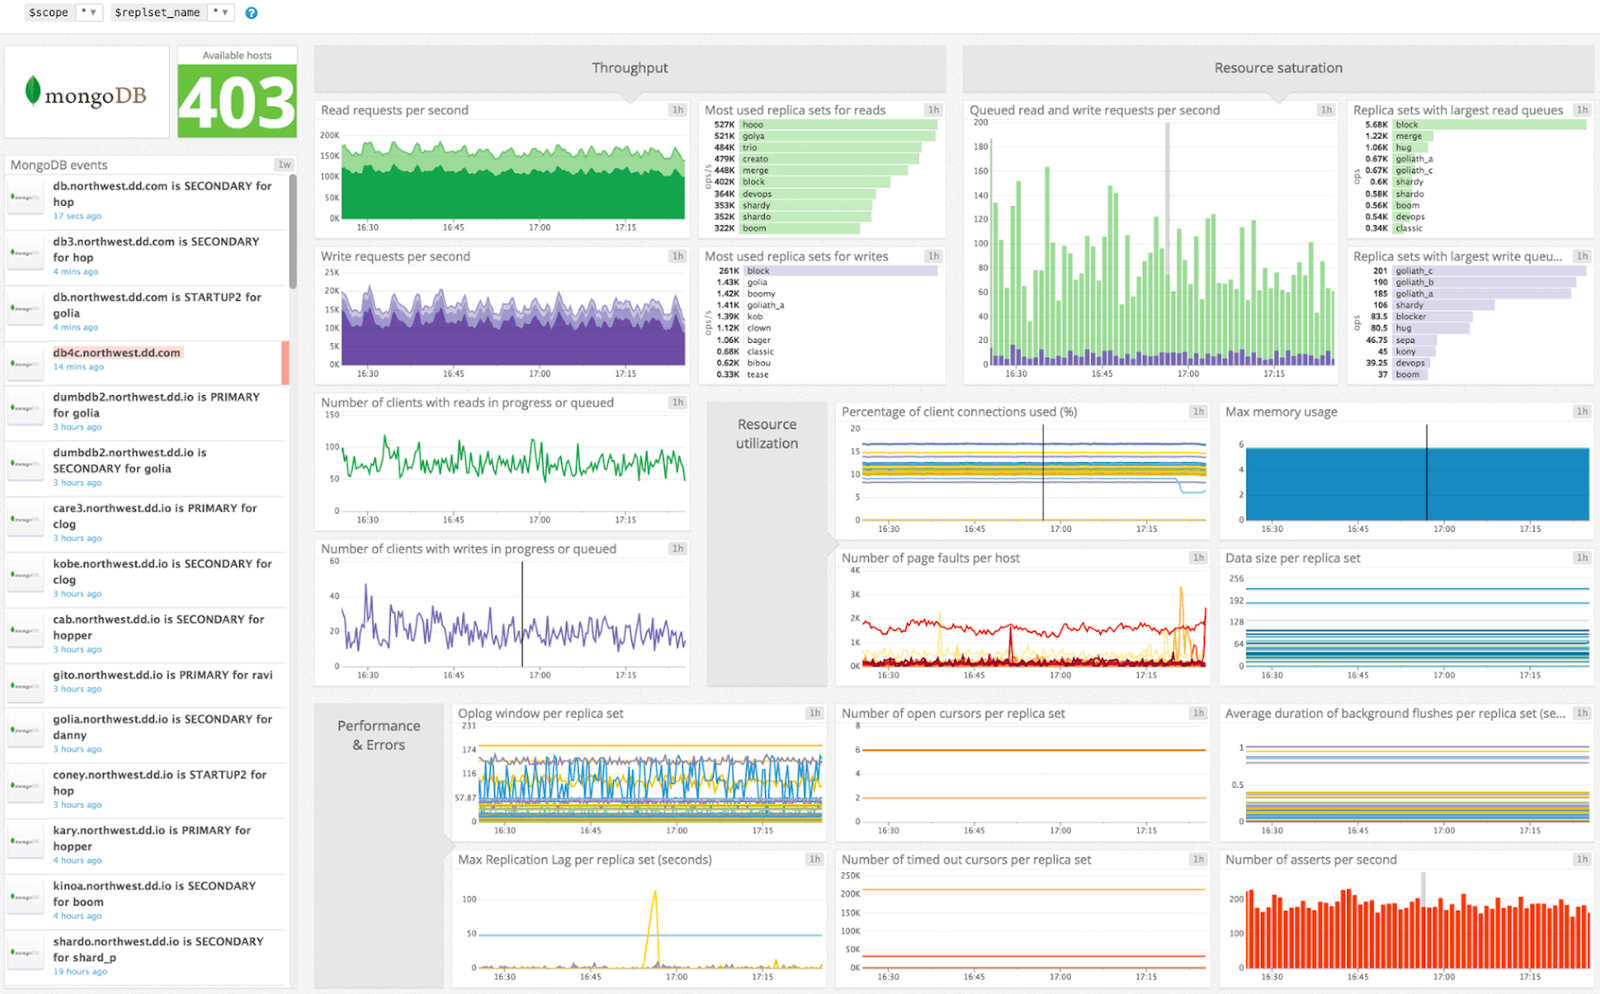
Datadog is a comprehensive monitoring solution with capabilities for MongoDB. It provides the needed MongoDB metrics for a detailed understanding of your database operations.
Additionally, Datadog employs anomaly detection and alerting supported by machine learning algorithms to prevent alert fatigue, allowing you to concentrate on critical insights concerning your MongoDB instances and clusters.

Datadog provides service auto-discovery capabilities, making it effortless to keep pace with expanding MongoDB environments. However, the pre-built, out-of-the-box dashboard may miss system-related metrics, requiring you to spend time adjusting it to have full visibility into your MongoDB instances.
SigNoz
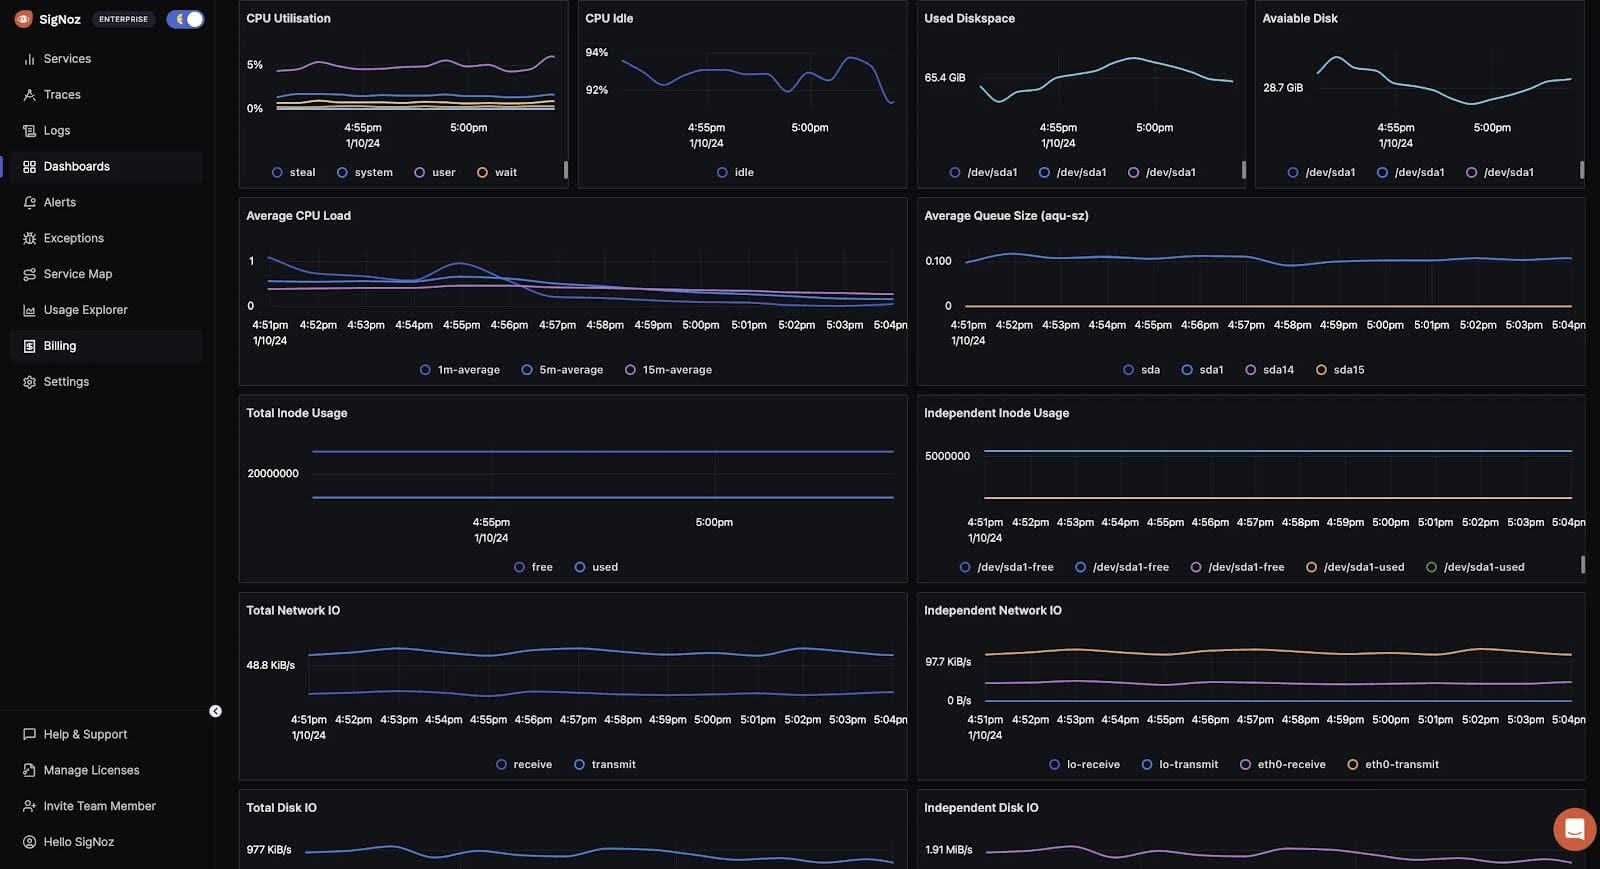
SigNoz is an observability platform for monitoring applications and generating metrics.

It works well with MongoDB using OpenTelemetry collector to ingest metrics from the database. These metrics are then fed into the SigNoz deployment for visibility. You can create your custom visualizations using the feature-rich dashboard.
Conclusion
Understanding the key MongoDB metrics to monitor is crucial. It’s equally important to have the right monitoring tool that simplifies the monitoring exercise.
Middleware offers a comprehensive solution for MongoDB monitoring, generating the key metrics and enabling the monitoring best practices.
By monitoring MongoDB metrics efficiently, you will quickly spot slowdowns or pressing resource limitations. This empowers you with the actions to take to correct these issues before they lead to user-facing consequences.


