
If you’ve ever experienced trying to debug a sluggish microservice or struggled with performance concerns when troubleshooting a distributed system, you likely experienced the agony of “too much data, not enough insight.” There are logs, traces and metrics.
OpenTelemetry (OTel), a Cloud Native Computing Foundation (CNCF) project, provides a unified, open-source framework for collecting, processing, and exporting telemetry data. It’s now the second-most active CNCF project after Kubernetes, proving its importance in modern observability pipelines.
👉 New to OpenTelemetry? Start with our complete guide on What is OpenTelemetry and How It Works to understand its core concepts before diving deeper.
Over 60% of organizations running Kubernetes now use OpenTelemetry for observability, with adoption accelerating among cloud-native teams.
In this guide by Middleware, we’ll demystify the OpenTelemetry Collector vs. Agent debate, explain how they fit into the OpenTelemetry architecture, and help you decide which is best for your observability pipeline. Understanding the OpenTelemetry Collector vs Agent comparison helps observability teams optimize their pipelines for efficiency and scale.
Most teams get stuck with this “Should I use the OpenTelemetry Collector vs. Agent, or both?”
What Are the Main Components of the OpenTelemetry Architecture?
Before exploring the OpenTelemetry Collector vs Agent differences, it’s essential to understand how both components function within the OpenTelemetry architecture.
What is the OpenTelemetry Collector?
The OpenTelemetry Collector acts as a centralized service for managing telemetry data. When comparing the OpenTelemetry Collector vs Agent, the Collector serves as the central processing hub for telemetry pipelines.
It is one service that collects traces, metrics, and logs from your applications, sorts them, and then sends them to the observability tools or backends you employ. In a sense, it is the center of your monitoring environment.
For an in-depth breakdown, see our guide: OpenTelemetry Collector: Architecture and Setup.
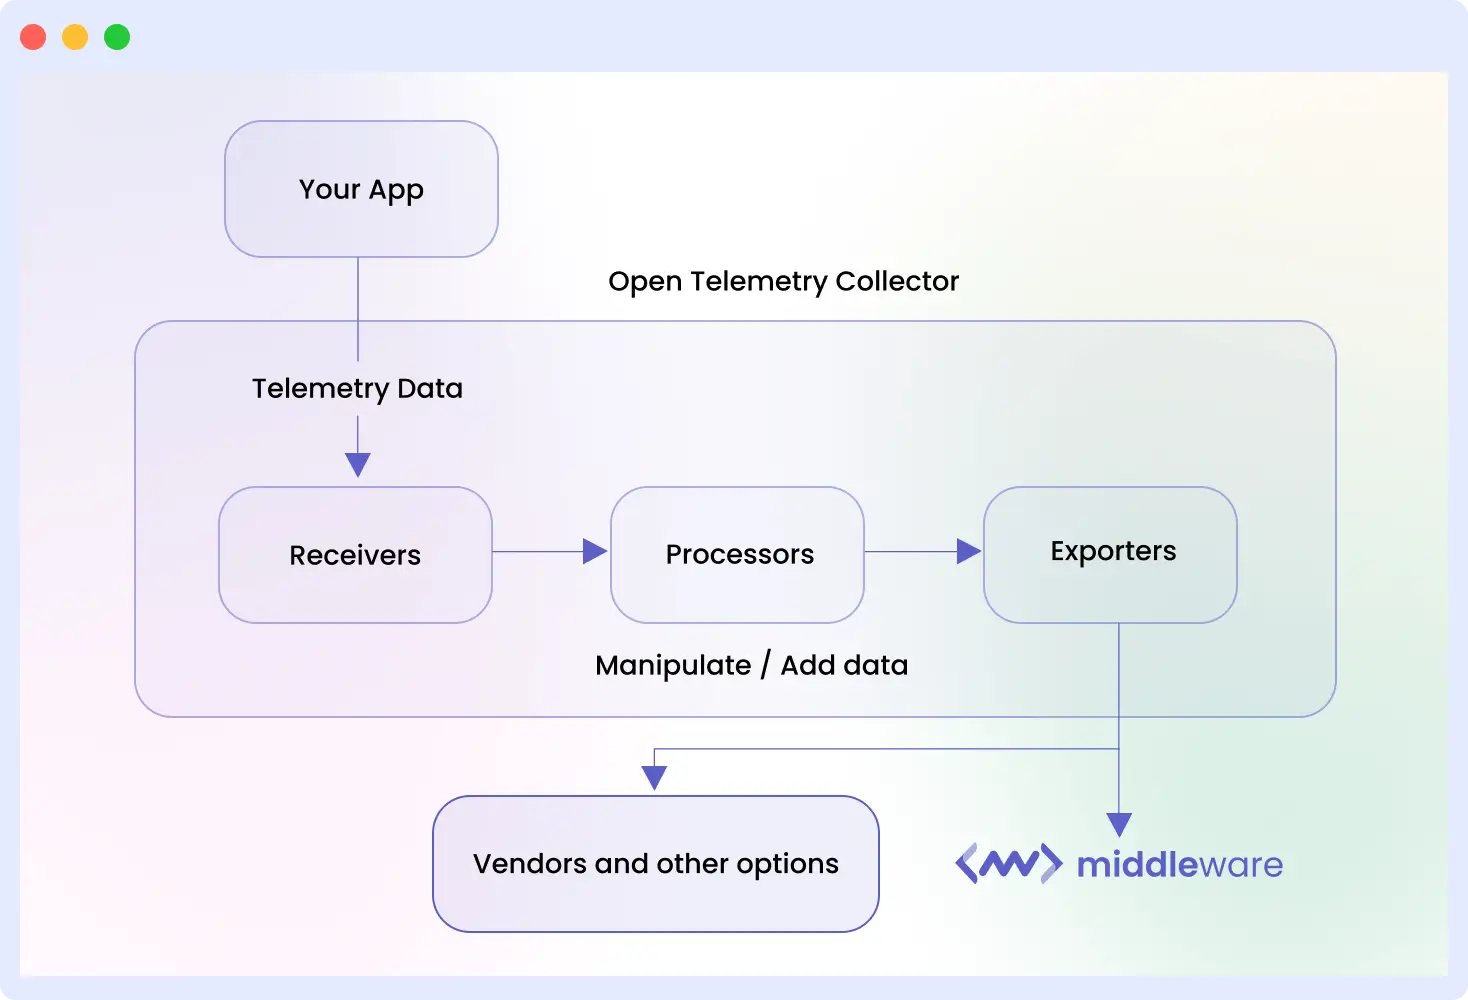
Instead of your apps talking directly to monitoring backends such as Middleware, Prometheus, or Jaeger, the Collector comes in between. It normalizes and prepares all that data before forwarding it to the destination where it should go.
Collector: Central hub for telemetry aggregation, transformation, and export.
What makes Collector so useful?
- Data Collection: The Collector can receive telemetry from various sources through receivers, including OpenTelemetry SDKs, agents, and other observability tools.
- Data Processing: This step allows you to clean up the data before it is stored. You can filter out the junk you don’t need, batch it up for better efficiency, or tweak it in other ways. You can also add helpful context (metadata) and reduce noise before sending it off.
- Data Exporting: Once the data is processed, this feature takes over. It uses exporters to send the data to your storage and analysis tools (backends). The big benefit here is that it doesn’t matter what observability tools you’re using this makes the data compatible with your entire stack.
What is the OpenTelemetry Agent?
The OpenTelemetry Agent is a lightweight process that runs alongside your applications to collect telemetry data locally with minimal overhead before forwarding it to a Collector or backend. You can think of it as a lightweight sidecar or daemon that runs along with your app and collects telemetry data from it directly.
Agent: Lightweight sidecar for data capture at the application level.
Its main job is straightforward: capture and forward. The Agent collects traces, metrics, and logs emitted by your app and sends them (often to a Collector) with minimal processing.
💡 Want to start collecting telemetry data? Follow our step-by-step OpenTelemetry Getting Started Guide.
Where does it differ from the Collector?
- The Agent focuses on local data collection, which captures telemetry as close to the source as possible.
- It performs minimal data processing, keeping overhead low to minimize impact on app performance.
- It’s ideal for containerized or microservices environments, where deploying an agent alongside each service ensures complete visibility and control.
Within the OpenTelemetry ecosystem, the Agent, Collector, and SDKs integrate with observability tools such as Prometheus, Jaeger, and Grafana. Together, they form a complete pipeline for metrics, logs, and traces across Kubernetes and hybrid cloud environments.
Together, the Agent and Collector form the foundation of an observability pipeline. To see how they integrate with metrics, logs, and traces, explore our insights on OpenTelemetry Observability.
Feature-by-Feature Comparison
Choosing between the OpenTelemetry Collector vs. Agent depends on scale and needs. Neither is “better”; they complement each other in robust pipelines.
The key difference between the OpenTelemetry Collector and OpenTelemetry Agent lies in their scope: the Agent collects data locally, while the Collector aggregates and processes telemetry data centrally before exporting it to backends.
Here’s a breakdown:
OpenTelemetry Collector vs. Agent
| Feature | OpenTelemetry Collector | OpenTelemetry Agent |
| Deployment Model | Runs as a centralized service (standalone, gateway, or clustered) that gathers telemetry from multiple sources. | Deployed alongside applications (as a sidecar or daemonset) to collect telemetry data locally. |
| Primary Role | Acts as a data pipeline receives, processes, and exports telemetry data to various observability platforms. | Functions as a lightweight collector focused on capturing and forwarding raw data from application instances. |
| Data Processing Capabilities | Offers advanced processing such as batching, filtering, sampling, and transformation before exporting. | Performs minimal processing, prioritizing speed and low overhead. |
| Scalability | Highly scalable, capable of handling data from hundreds of services or instances. | Scales naturally with the number of application instances each handles its own telemetry. |
| Performance Impact | Offloads heavy processing away from apps, reducing runtime load. | Very lightweight minimal impact on application performance. |
| Flexibility & Customization | Extensive customization via multiple receivers, processors, and exporters. Easily integrates with diverse observability tools. | Simpler configuration with limited customization, ideal for consistent deployments. |
| Security & Compliance | Requires proper access control, TLS encryption, and authentication for centralized communication. | Operates within the application’s trusted boundary, reducing exposure but limited to local scope. |
| Integration & Compatibility | Compatible with multiple backends (Prometheus, Jaeger, Elastic, etc.) and supports hybrid or multi-cloud setups. | Tightly integrated with OpenTelemetry SDKs and supports major programming languages. |
| Best Fit | Ideal for centralized, large-scale environments that need data aggregation and transformation. | Best for application-level observability and containerized or distributed architectures. |
Key takeaway:
Use the Collector when you need centralized control and scalability; use the Agent when you want localized, low-overhead telemetry capture near the source.
📘 Learn how to visualize your telemetry data effectively: Check out Middleware’s OpenTelemetry Logs Guide and OpenTelemetry Metrics Explained to understand how data from Agents and Collectors is stored, parsed, and displayed.
Now let’s look into OpenTelemetry Collector vs. Agent and understand how each plays its role in building a complete observability setup.
Pro Tip: In 2025, hybrid models dominate use Agents for edge collection and Collectors for centralized processing to cut costs by 30-50% via sampling and batching.
When Should You Use the OpenTelemetry Collector or Agent?
Deciding between OpenTelemetry Collector vs Agent, really boils down to how big, complex, and spread out your systems are. They each play a distinct role in your observability setup: one is built to handle data coming from everywhere , and the other is focused on grabbing data with the least amount of fuss right where it’s created.
When to Use the OpenTelemetry Collector
Use the OpenTelemetry Collector when your environment requires centralized telemetry management, data transformation, and multi-source aggregation across large or distributed systems.
The Collector is ideal for scenarios requiring significant telemetry data management from many applications or services. It is designed for centralized control, data transformation, and scalability.
To learn how to configure and deploy Collectors efficiently, check our developer documentation on OpenTelemetry Collector Setup.
Best-fit scenarios include:
- Centralized telemetry processing for large-scale systems: This is suitable for enterprises or distributed architectures that require gathering data from numerous microservices, clusters, or nodes.
- Advanced data transformation, filtering, and aggregation: This is ideal for teams that wish to clean, enrich, or normalize telemetry before sending it to observability tools. The collectors enable data transformation which will help to optimize your measurable insights throughout the data ingestion process by transforming raw metrics, traces, and logs.
- Multi-source telemetry pipelines:
This is particularly handy when you have data coming in from various sources, such as Prometheus for metrics, Jaeger for traces, and OTLP for logs. It allows you to capture all different formats and protocols and send them to multiple destinations (backends) simultaneously. It’s like a universal translator and traffic cop for your monitoring data.
- Hybrid or multi-cloud environments:
In complex infrastructures, the Collector can act as a central telemetry hub, ensuring consistent data handling and policy enforcement across diverse environments.
A fintech firm uses Collectors as gateways to comply with regs, processing 1M+ spans daily without app disruption.
When to Use the OpenTelemetry Agent
Use the OpenTelemetry Agent for application-level observability, particularly in containerized or microservice architectures where low latency and minimal overhead are priorities.
The Agent is excellent for lightweight, application-level monitoring. The Agent is useful in environments requiring low latency and low overhead, such as microservices or edge systems.
You can start instrumentation directly from your app using our guide on Application Instrumentation with OpenTelemetry.
Best-case scenarios include:
- The Agent is typically located close to where the data originates, pulling metrics and traces from an application instance with minimal processing overhead.
- In those situations in which performance matters, Agents may push telemetry directly to a backend/collector and with extremely low CPU and memory usage.
- The Agent shines on Kubernetes, Docker, and other container infrastructures where it can be deployed as a sidecar or DaemonSet to ensure localized observability for each application instance.
- For low-latency or real-time user analytics; the Agent provides input of telemetry at the edge location before forwarding it to the backend for more detailed analysis.
E-commerce teams deploy Agents per service for trace propagation, feeding Collectors for correlation—boosting MTTR by 50%.
In most production-grade observability pipelines, organizations use both components together. The Agent collects telemetry data at the application level, while the Collector aggregates, processes, and exports it efficiently.
With Middleware, managing this hybrid setup becomes effortless. Middleware integrates natively with OpenTelemetry, collecting data from Agents or Collectors and offering one unified view for all telemetry.
Visualizing OpenTelemetry Data with Middleware
Middleware is a unified observability layer built on OpenTelemetry, combining metrics, logs, and traces into one intelligent platform.
✨ Want to see how Middleware integrates with OpenTelemetry metrics.
Raw OTel data is powerful, but visualization turns it actionable. Middleware trusted by 500+ enterprises natively ingests from Agents/Collectors, adding AI smarts without config headaches.
According to Middleware’s observability experts, teams combining OpenTelemetry Agents and Collectors achieve faster incident resolution and more predictable telemetry costs.
- Unified Telemetry View: Middleware consolidates your traces, metrics, and logs into one unified view. You no longer need to switch between multiple tools to find the cause of a latency spike or error. Middleware brings everything together in a single timeline view.
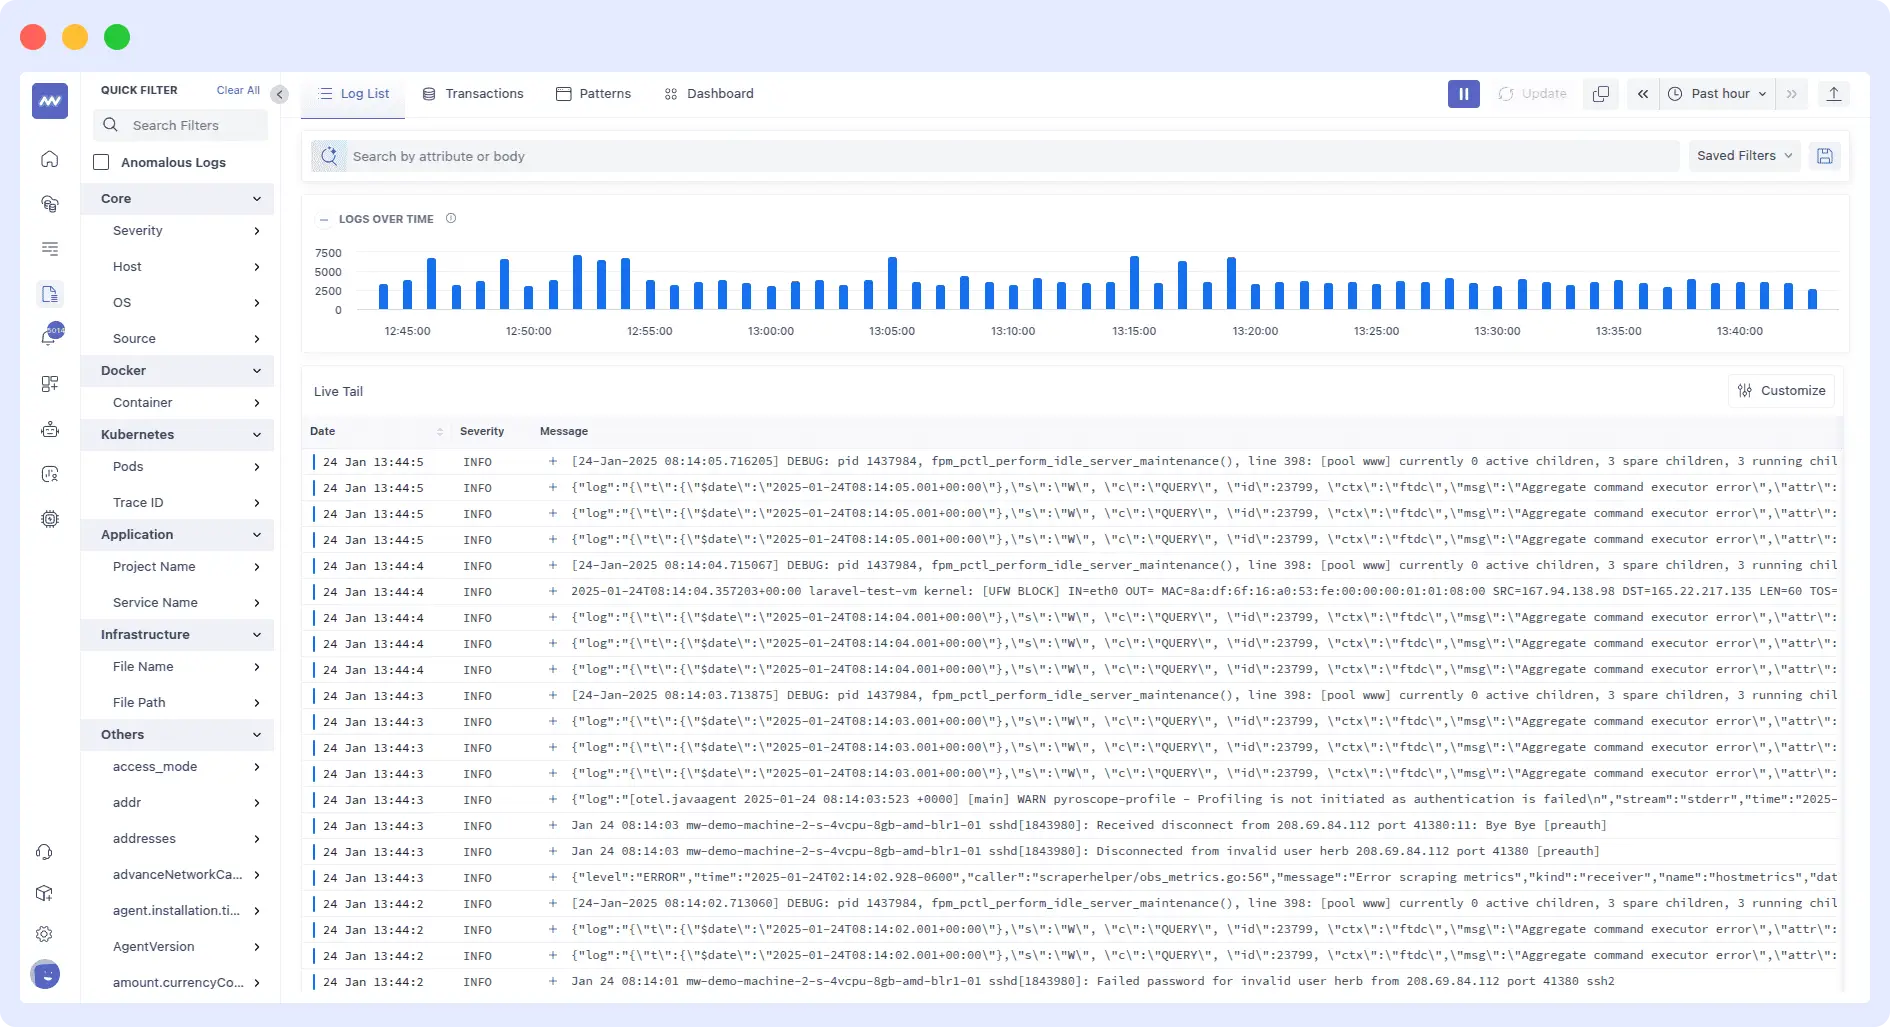
- Real-Time Correlation & Drill-Down: Since Middleware is intimately integrated in the pipeline, you can correlate performance from a high-level alert down to the specific span, metric or log entry. You won’t lose context when jumping levels of granularity between, for example, an error rate widget and the underlying trace paths.
In my experience consulting for SRE teams, Middleware cuts setup time by 60%, letting you focus on insights over infra.
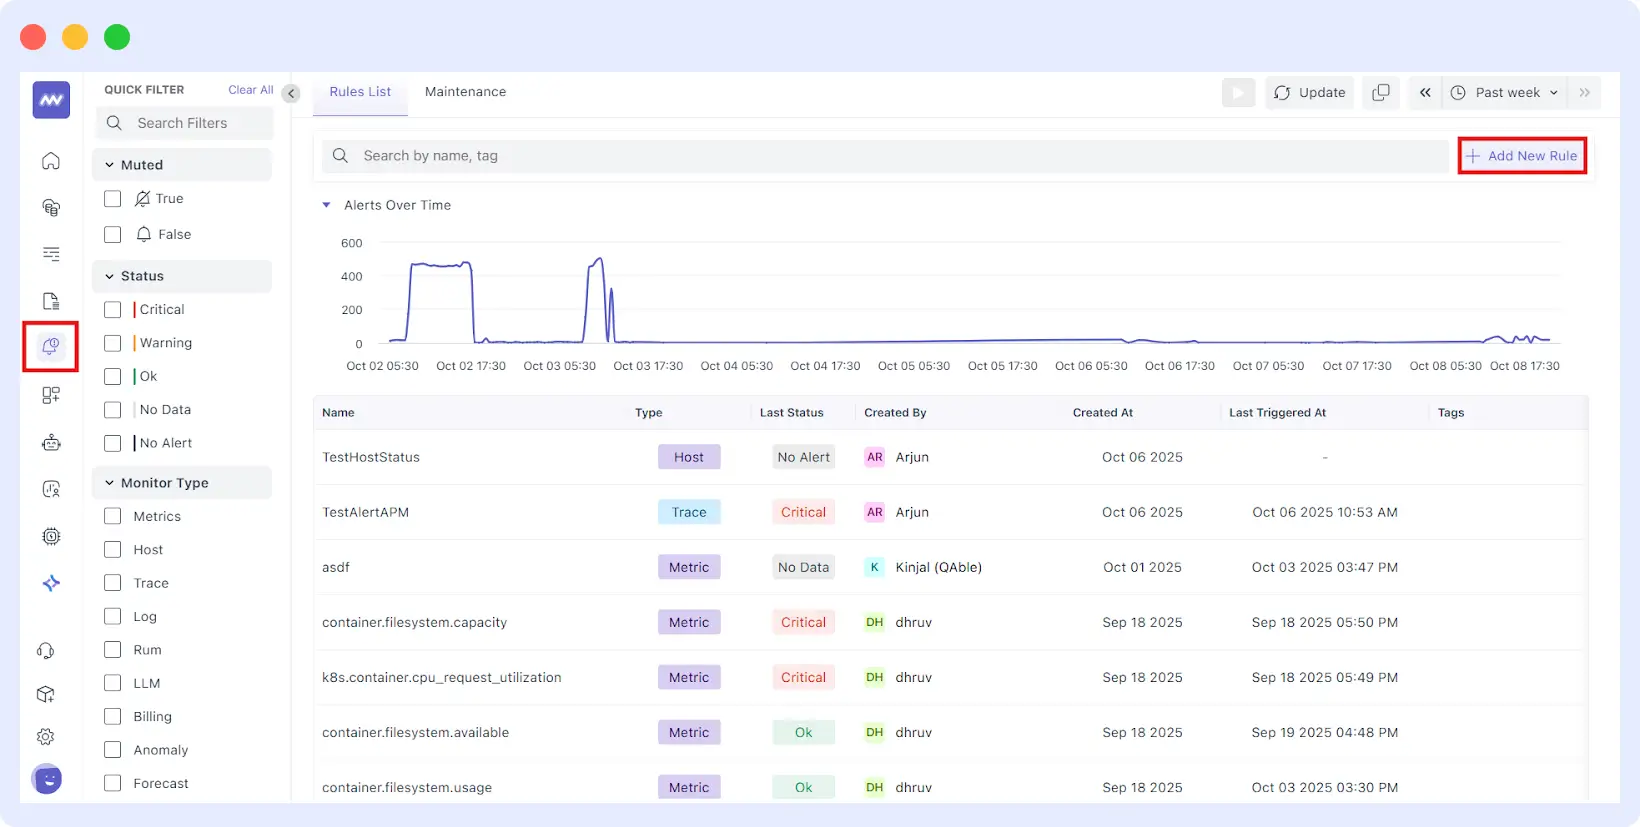
- Smart Alerting & Anomaly Detection: If telemetry is a yardstick for measuring, Middleware layers’ intelligence builds upon it. You can set alerts when metrics cross thresholds, or you can let anomaly detection notice deviations without you having explicitly defined the rules. The system helps identify patterns and root causes more quickly.
- Flexible Telemetry Routing & Control: Middleware is not something passive and solely for visualization. It can be thought of as a control plane for your telemetry pipeline. Middleware can transform data, route it to multiple backends, and filter noise without modifying Collector or Agent settings.
- Cost & Data Volume Optimization: If you don’t manage observability data carefully, costs can add up quickly. Middleware enables you to control incoming data through sampling, throttling, or drop rules, thereby reducing costs without compromising key insights.
Final Recommendations
The right choice between the OpenTelemetry Collector and Agent depends on your system’s size and observability goals.
- Use the Collector for centralized data aggregation and transformation across multiple services.
- Use the Agent for lightweight, local telemetry collection near your applications.
- For most setups, combining both delivers the best performance and scalability.
🔗 Next Step: If you want to implement OpenTelemetry end-to-end, follow our OpenTelemetry Getting Started Docs and learn how Middleware automates setup and visualization.
FAQs
Can I use both in one pipeline?
Absolutely, Agents collect locally, Collectors process centrally via OTLP. This hybrid is standard for scalable setups.
When should I use the OpenTelemetry Agent?
Use the Agent for early development, prototyping, or low-traffic standalone apps needing zero-config auto-instrumentation. It’s excellent for resource-constrained environments, such as serverless functions. Avoid it for multi-app aggregation or advanced processing.
When should I use the OpenTelemetry Collector?
Choose the Collector for production microservices, high-scale setups (e.g., Kubernetes), or applications with specific needs such as sampling and data transformation. It unifies exports across languages and backends. Skip it for lightweight, single-app scenarios to avoid extra deployment.
Can the OpenTelemetry Agent and Collector be used together?
Yes, commonly: Agent instruments in-process and forwards data via OTLP to the Collector. The collector then processes and exports centrally, reducing app load. This hybrid balances ease and robustness, for example, an Agent in a Node.js app and a Collector to Datadog.
How do I pick the right approach for my telemetry needs?
Assess if Single app/dev? Use Agent. Distributed system? Use Collector. Both? Combine them. Factor in team skills, scale, and backends; test via OpenTelemetry quickstarts.
What is the main difference between the OpenTelemetry Collector and Agent?
The Collector centralizes telemetry processing and export, while the Agent captures data locally from applications.
How does Middleware improve OpenTelemetry observability?
Middleware provides centralized visualization, intelligent alerting, and flexible telemetry routing built on OpenTelemetry architecture.
Ready to simplify your OpenTelemetry setup? Explore Middleware’s Observability Platform to visualize metrics, logs, and traces in one place.


