OpenTelemetry (OTel) is reshaping observability through its open-source principles and unifying data collection via telemetry pipelines. It standardizes the consolidation of traces, metrics, logs, and telemetry data within a single, developer-friendly framework, simplifying tasks for developers and engineers.

The project results from the merger of Google’s OpenCensus with the Cloud Native Computing Foundation’s OpenTracing, and contributions from industry experts drive its evolution.
Unified data collection remains a core objective, facilitating comprehensive observability across diverse telemetry pipelines. This eradicates the complexities of managing various agent libraries and vendor dependencies.
Supported by the CNCF, OpenTelemetry signals a shift toward an open standard that benefits the entire developer community, from SREs to DevOps practitioners and developers. In essence, OTel is not merely transforming observability; it is rewriting the rules.
Read on to understand OTel’s components, challenges, solutions, best practices for its adoption, and how the framework interjects with observability.
Understanding OpenTelemetry
OpenTelemetry is an open-source observability framework that instruments software applications to collect and export telemetry for analysis in various observability backends.
Users can instrument code and capture telemetry at different stages of the software development lifecycle (SDLC). OTel standardizes the capture and transmission of metrics, traces, and logs to enhance observability, regardless of the underlying application infrastructure.
For example, owners of e-commerce applications can use OpenTelemetry to measure how quickly they respond to customer requests and track the number of successful conversions (e.g., completed purchases). OTel can also help capture data on user interactions, such as page views, clicks, navigation patterns, and the occurrence/frequency of errors.
By collecting this data, users can assess the effectiveness of marketing campaigns, identify slow or failing services, and track dependencies, ultimately resolving issues that affect customer experience and drive sales.
Now that we’ve defined OpenTelemetry and its offerings, let’s explore the importance of observability and how it intersects with OTel’s capabilities.
Importance of Observability
Observability is the practice of measuring the internal states of applications through their external behavior. It is essential for the following reasons.
Easy Detection and Resolution of Issues
Detecting potential problems in complex distributed software systems can be challenging. However, observability enables users to capture and analyze telemetry data to identify pattern changes or security breaches, allowing them to address these issues before they impact application performance and user experience.
Troubleshooting and Debugging
When issues arise in distributed systems, observability facilitates root cause analysis by providing the necessary tools and data to trace requests and sequences of events across multiple services.
Users can also configure alerts with thresholds tailored to critical metrics, ensuring a swift response to anomalies and reducing the mean time to repair (MTTR).
Understanding User Behavior
Observability, by capturing telemetry data on user interactions, enables users to gain a deeper understanding of user behavior and preferences. This, in turn, helps improve the user experience, personalize offerings, and drive customer engagement and satisfaction.
Precision
Unlike manual monitoring, which can be slow and error-prone (e.g., software developers may overlook metrics and misdiagnose software issues), observability increases the accuracy of error detection through automated, round-the-clock telemetry collection while providing dashboards for visualization and analysis.
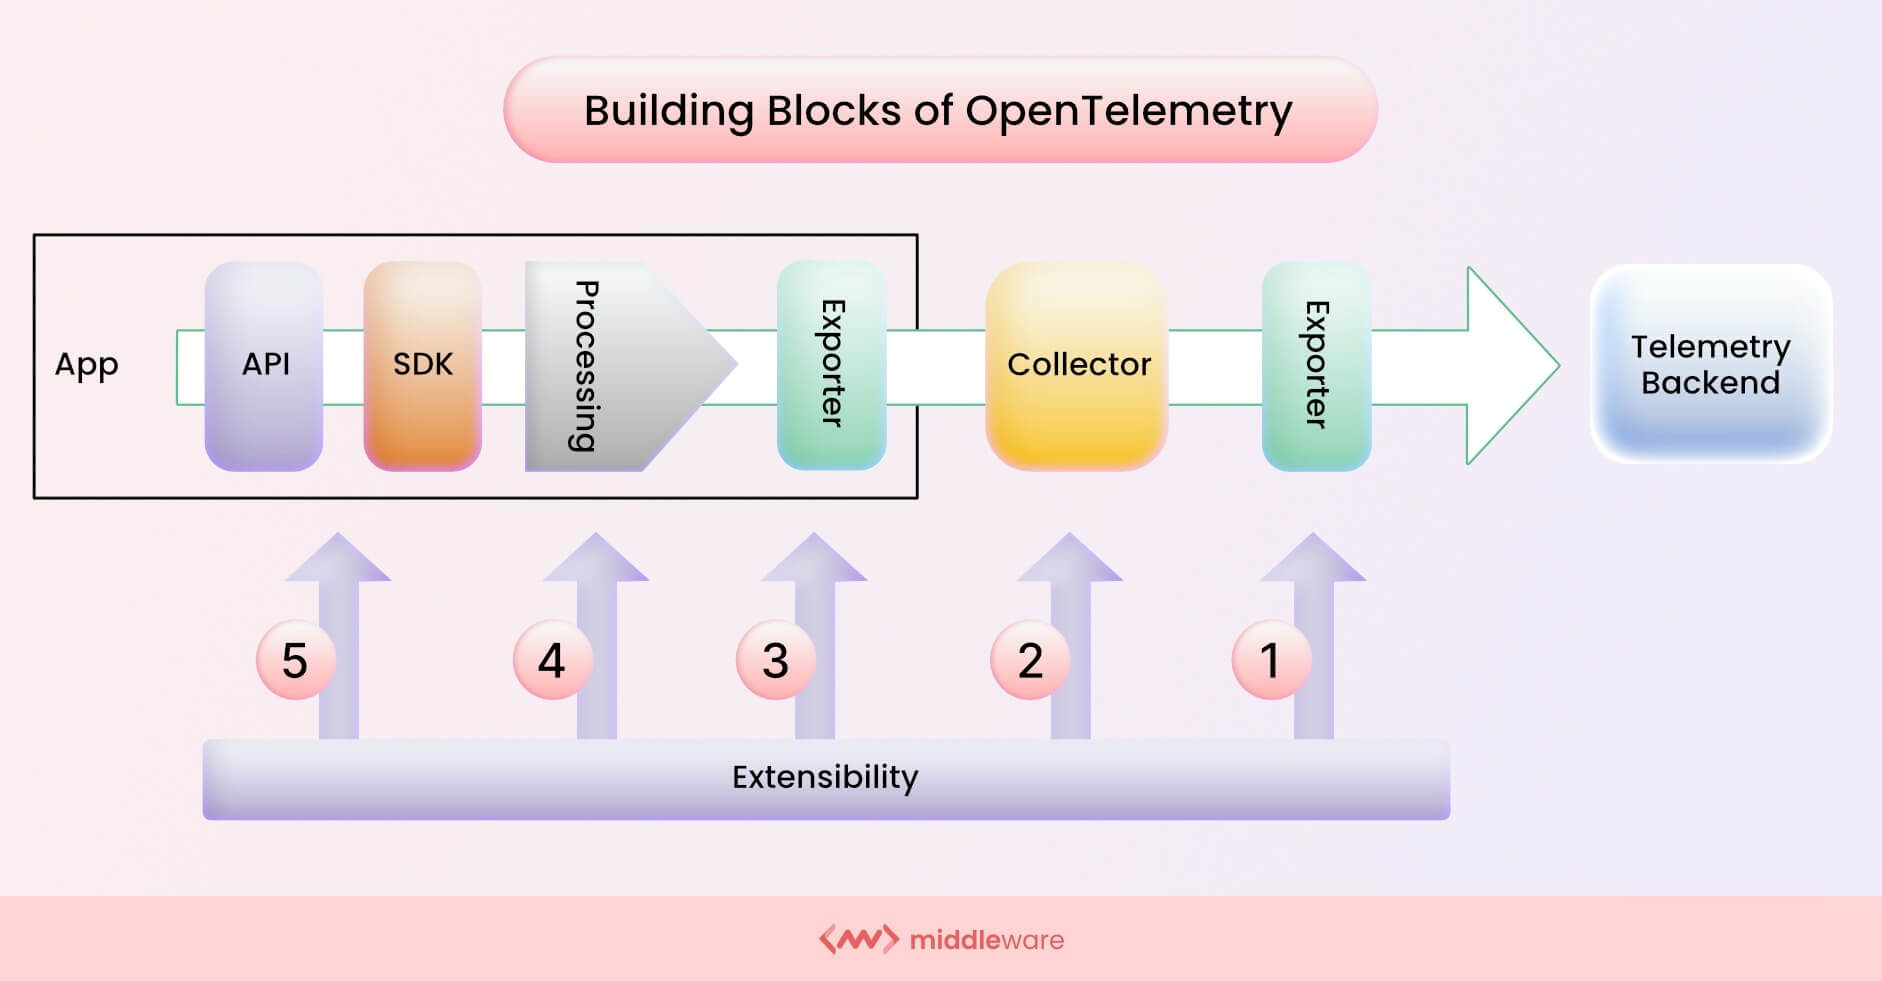
Building Blocks of OpenTelemetry
OpenTelemetry consists of several components that enhance its functionality and aid its integration with various visualization systems.
Below, you’ll find some building blocks that compose OpenTelemetry.
Instrumentation
client libraries to generate telemetry events. You can perform instrumentation manually using OpenTelemetry SDKs or automatically with the assistance of various language-specific frameworks and libraries.
For automatic instrumentation, OpenTelemetry provides instrumentation libraries for various programming languages and frameworks. This method requires no code changes, allowing users to quickly gain insights into software behavior.
However, manual instrumentation involves coding against the OTel API, providing users with fine-grained, custom-based observability. Even in manual instrumentation, not all dependencies require instrumentation, as some are natively instrumented. To manually instrument OTel, you can add the SDK as a dependency in your project and configure it in the application code. Then, instrument your code with OpenTelemetry API calls to capture telemetry data.
Users can also use manual and automatic instrumentation simultaneously to leverage the benefits of both.
SDKs
OpenTelemetry offers language-specific SDKs that provide instrumentation libraries for different programming languages. These SDKs enable users to instrument their applications with OpenTelemetry without requiring extensive manual modifications.
Currently, SDKs are available for popular languages such as Java, Python, JavaScript, Go, .NET, Ruby, and PHP.
Tracers and meters
Tracers are used to generate and manage traces and spans, while meters are used to measure and report metrics. Traces represent the flow of requests as they traverse different components of a system, and spans offer a means of identifying and assembling traces. Metrics are numerical measurements of services captured at runtime.
Tracers capture information about each request’s journey, including the time taken at each step and any errors encountered. By generating and managing these traces, tracers enable observability of the interactions of services in distributed systems. Similarly, meters capture metric events to visualize software behavioral patterns and their frequencies.
OpenTelemetry Collector
The OpenTelemetry Collector acts as an intermediary between instrumented applications and observability backends. It receives, filters, aggregates, and transforms telemetry before sending it to exporters for further analysis.
The Collector enables advanced processing, batching, and routing of telemetry data, improving scalability and performance in complex distributed environments.
Exporters
Exporters are responsible for sending telemetry to various backend systems for storage, analysis, and visualization. OpenTelemetry allows users to export telemetry through the Collector or directly to an observability backend.
However, using the Collector has the added advantage of allowing users to export multiple telemetry streams/types to various observability platforms simultaneously.
OpenTelemetry supports a rich array of exporters, including Jaeger, Prometheus, Zipkin, AWS CloudWatch, Google Cloud Monitoring, New Relic, and Azure Monitor. These exporters send telemetry to monitoring, tracing, logging, and storage systems.
OTel exporters seamlessly integrate with existing monitoring infrastructure, reducing the need for individual instrumentation in each microservice architecture and simplifying the overall setup.
The Essence of OpenTelemetry Observability
OpenTelemetry offers various functionalities designed to handle the complexities of capturing telemetry in modern software. Notable among these are automatic instrumentation, context propagation, and standardization, as discussed below.
Automatic Instrumentation
When you require swift, rather than granular observability, OpenTelemetry’s automatic instrumentation libraries enable developers to instrument, collect, and export telemetry quickly, regardless of the programming language and infrastructure used in the application. This provides a definite advantage when compared to manually instrumenting distributed software.
Context Propagation
Context propagation enables users to correlate telemetry and trace the flow of requests and events across different parts of a distributed system.
To implement context propagation in a microservice architecture (where services communicate with each other via APIs) using OpenTelemetry, you can take two services, “A” and “B,” for instance.
In “Service A,” configure OpenTelemetry to create and propagate a trace context when handling incoming requests.
python
import opentelemetry.trace as trace
from opentelemetry.propagate import inject, get_current
def handle_request(request):
    tracer = trace.get_tracer(__name__)
    with tracer.start_as_current_span("request handling"):
        # Perform some business logic
        # Inject the trace context into the outgoing request
        inject(get_current().get_span_context(), request.headers)
        # Make an API call to "Service B"
        response = http_client.post(url="http://service-b:8000", headers=request.headers, data=request.body)
        # Process the response
        return response
Configure OpenTelemetry in ‘Service B’ to extract and utilize the incoming trace context.
python
import opentelemetry.trace as trace
from opentelemetry.propagate import extract, set_current

def handle_request(request):
    tracer = trace.get_tracer(__name__)

    # Extract the trace context from the incoming request
    trace_context = extract(request.headers)

    # Create a new span using the extracted trace context
    with tracer.start_as_current_span("request handling", context=trace_context):
        # Perform some business logic

        # Process the request

        return response
OpenTelemetry ensures that it captures and links the entire flow of the request by propagating the trace context from Service “A” to “B” in the observability data.
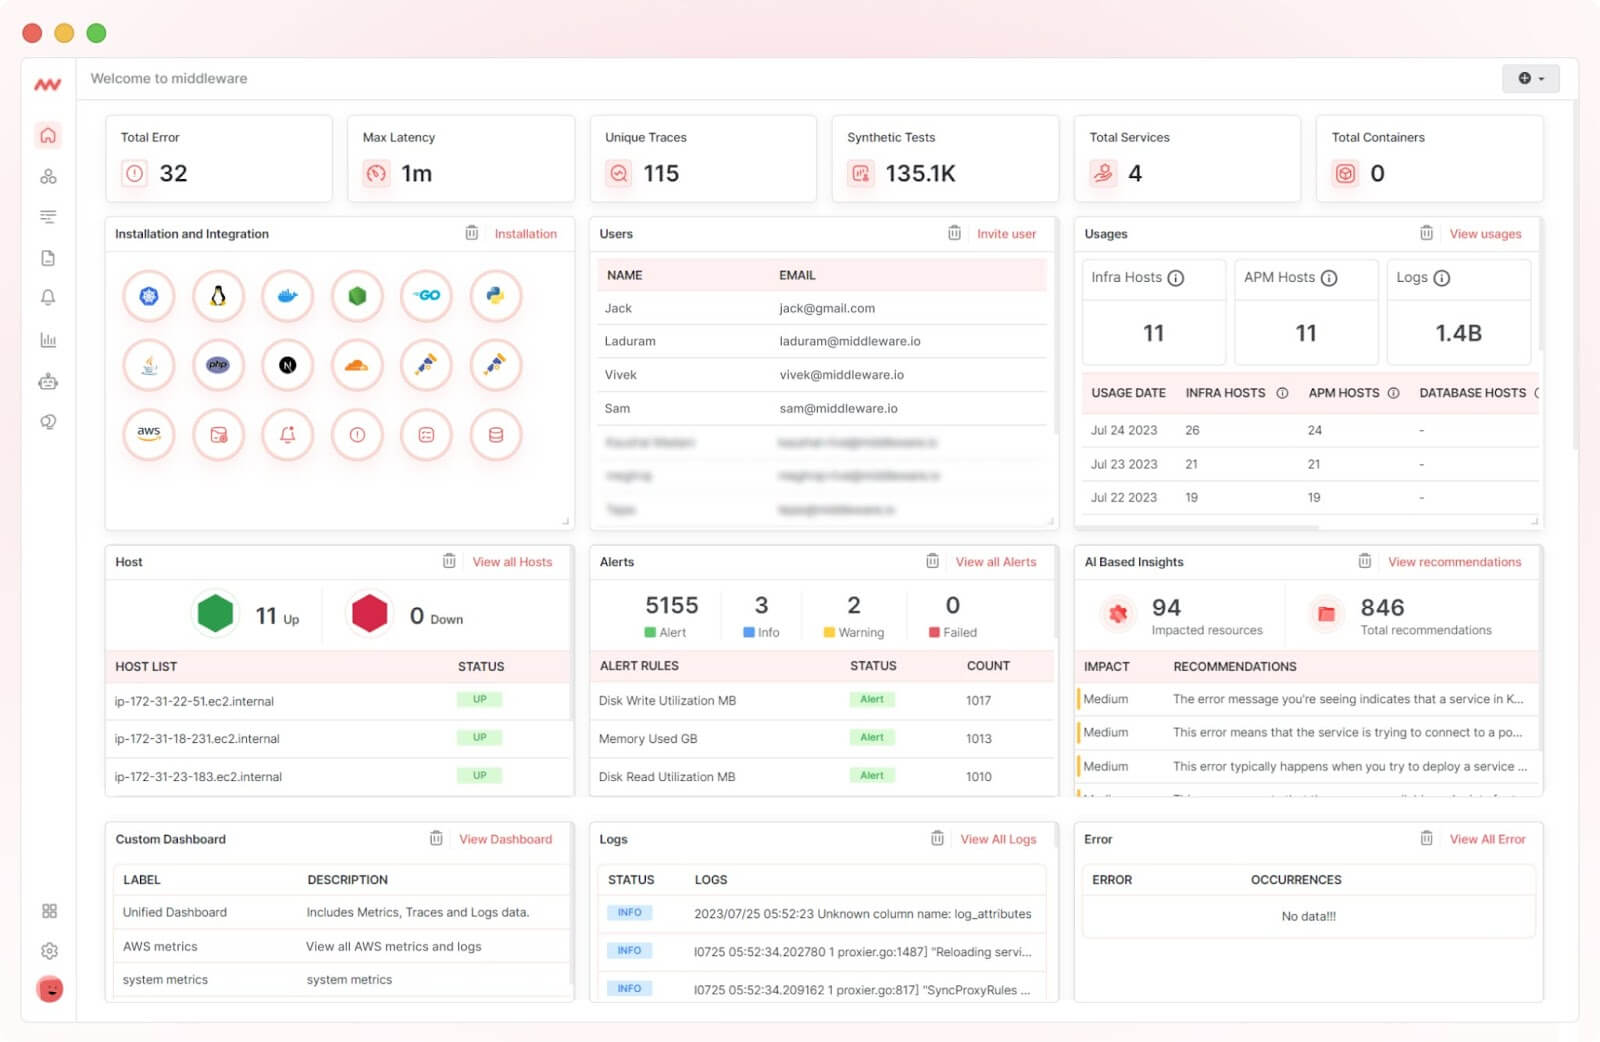
However, with Middleware, users can propagate context without needing to execute any command. It assists users in identifying, understanding, and resolving issues across their cloud infrastructure by simply filtering searches.
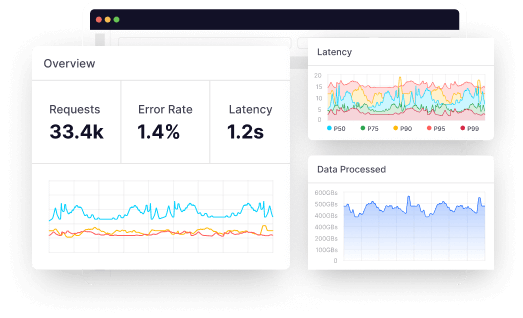
Middleware displays the results in comprehensive tables and various types of graphs, allowing users to bring different kinds of telemetry data (metrics, logs, and traces) to a single unified timeline for debugging the issue.
Standardization and Interoperability
OpenTelemetry adheres to a standardized set of APIs and protocols that ensure its vendor-neutrality, making it an invaluable framework for modern distributed systems.
It abstracts compatibility issues and vendor lock-in, enabling users to consistently share and analyze telemetry data, regardless of the software complexity or technology stack they use.
Exemplifying How to Troubleshoot with OpenTelemetry
A lagging e-commerce software that experiences delayed processing of customer orders can utilize OpenTelemetry for root cause analysis through the following steps:
- Capturing Traces: Traces provide a detailed record of request and execution paths across different components of the system. By tracing key software functionalities, users can narrow their investigation down to specific services or API calls that might cause the delays.
- Analyzing Spans: Spans represent individual units of work within a trace. Analyzing spans helps users identify performance bottlenecks occurring within a specific service or API call. Users can then visualize the trace in tracing backends to better understand how to resolve the issue.
- Correlating Logs and Metrics: When troubleshooting performance issues, users can examine logs, such as application error logs or infrastructure logs, to identify patterns of abnormal behavior. Metrics can also help users track how many customers experienced delays and how often latency occurred. Similarly, tying alerts to metrics, logs, and tracking can provide a complete insight into the current state of your system.
- Context Propagation: By propagating the trace context, users can track the journey of requests from the initial client request through different microservices to see which particular application function triggered the delay.
- Integration with External Systems: By exporting telemetry to external observability systems, users can interpret the data to resolve the identified performance issue, thereby improving customer experience and satisfaction.
For instance, Middleware offers integration with cloud platforms like AWS and GCP, as well as databases like MongoDB, Redis, and others.
Users can acquire data from these sources to Middleware and leverage our integration for alerts and notifications, so relevant alerts can be directly seen on Slack, MS Team, PagerDuty, etc.
The OpenTelemetry Ecosystem
In addition to a wide array of components and functionalities offered by OTel, the OpenTelemetry project boasts a rich ecosystem of compatible observability backends with varying features.
OpenTelemetry also adheres to and implements industry standards and protocols for telemetry data, ensuring extensibility and interoperability across various systems and vendors.
Key standards include the OpenTelemetry Protocol (OTLP) for transmitting telemetry data, Resource semantic conventions for providing standardized metadata, and OpenTelemetry semantic conventions for consistent attribute naming across different languages.
Top 8 Best Practices for Comprehensive Observability
Here are eight best practices to consider for effectively adopting OpenTelemetry in application environments.
Define Clear Observability Goals
Understand what types of telemetry you need to collect and analyze, along with the level of granularity required, based on the specific observability challenges you are trying to address.
Well-defined goals will also help you choose the right instrumentation strategy for your application environments. Automatic instrumentation simplifies and speeds up the process, while manual instrumentation offers more flexibility and control.
Start with a Small, Focused Implementation
To avoid overwhelming your team, begin by instrumenting critical components of the application stack. Focus on areas that handle user requests, external API integrations, data pipelines, databases, message queues, or performance-sensitive operations.
Focus on instrumenting these components first to validate the effectiveness of OpenTelemetry for your specific use case before scaling it across the entire application.
Maintain a Consistent Instrumentation Approach
OpenTelemetry provides semantic conventions that offer standardized attribute names for common use cases. Maintain consistent naming conventions, tags, and labels when instrumenting the application components for better metrics, traces, and logs correlation. This will make it easier to understand the relationship between different parts of the application.
Leverage Distributed Context Propagation
Distributed context propagation allows you to propagate contextual information, such as trace, span, user, and transaction ID, across software services for a holistic view of request flows and system behavior.
Monitor and Fine-Tune Performance
Instrumentation should not negatively impact application performance. Optimize the configuration, sampling rates, and data collection based on performance metrics and feedback received.
For example, sampling rates determine how frequently traces and metrics are collected, which impacts resource consumption and storage costs.
Configure sampling rates based on the importance of specific services or request types, as this will help balance observability needs and resource utilization.
Utilize OpenTelemetry Exporters and Integrations
Leverage OpenTelemetry collectors, exporters, and integrations to seamlessly integrate OpenTelemetry with the observability infrastructure.
Consider Security and Privacy
Ensure that sensitive information, such as personally identifiable information (PII), is handled securely and not included in telemetry data. OpenTelemetry provides mechanisms to filter or redact sensitive data to protect privacy and comply with regulations like GDPR.
Stay Up-to-Date
OpenTelemetry, as an open-source project, is ever-evolving. Regularly update instrumentation libraries, exporters, and integrations to exploit new capabilities and optimizations.
Participate in the community, attend conferences, and engage with relevant forums to stay connected and share knowledge with other OpenTelemetry users. Also, adapt the instrumentation based on evolving application requirements.
Implementing OpenTelemetry: Challenges and Solutions
While OpenTelemetry is a powerful observability framework, it poses the following implementation challenges.
Instrumentation Complexity
Determining which parts of the application to instrument, understanding the required telemetry data, and correctly instrumenting the codebase can be challenging.
Also, manually instrumenting code or retrofitting old applications can be time-consuming.
To mitigate this challenge, leverage OpenTelemetry language-specific SDKs and instrumentation libraries, which provide automated instrumentation for popular frameworks and libraries.
Also, utilize integrations with other observability tools and frameworks to simplify the instrumentation process and bridge the gap between existing monitoring solutions.
Performance Overhead
Adding OpenTelemetry instrumentation may introduce additional overhead, which can be a concern for performance-sensitive applications.
Adjust sampling rates for traces and metrics based on performance requirements to solve this issue. Use adaptive sampling techniques to balance the need for observability with performance overhead.
Configuring Exporters and Integrations
Configuring exporters and integrations for OpenTelemetry to send telemetry data to various backends and tools can be challenging when dealing with multiple observability platforms.
It is advisable to leverage community-supported exporters and integrations that align with preferred observability tools. These exporters often come with setup guides and examples to facilitate a smooth configuration process.
Learning Curve
OpenTelemetry is a comprehensive observability framework with multiple components and concepts. Getting started and understanding its architecture, instrumentation, and configuration may require extensive learning. Participating in training and studying documentation will help immensely.
Parting Thoughts
OpenTelemetry enhances visibility into system behavior. By following the best practices discussed above, you can unlock the power of distributed tracing, monitoring, and logging for proactive troubleshooting and improving application performance.
This will enhance the user experience and business bottom line. Given its industry-wide adoption, the OTel ecosystem will continue to expand, and there may be synergies between the OTel ecosystem and the AI world in the future.
Achieve observability in 60 seconds with Middleware!


