In today’s era, where most organizations are using a combination of multiple servers, containers, and cloud providers, imagine you are a developer trying to troubleshoot a complex application running across your company’s entire tech stack. Yes, it is not impossible, but it is not an easy task either.
This is where solutions like OpenTelemetry logging come into play, allowing developers to collect and analyze logs most efficiently by providing a single standard framework for observability.
Read on to understand what OpenTelemetry Logging is, how to collect OpenTelemetry logs, and how to use Middleware to tackle the challenges of log management in distributed systems.
What is OpenTelemetry?
OpenTelemetry is an open-source, vendor-neutral observability framework that provides a standard, unified approach to capturing telemetry data in modern applications. It offers a set of APIs, instrumentation libraries, SDKs, and integrations for collecting telemetry data, including metrics, traces, and logs.
OpenTelemetry is built and designed around three core components: instrumentation, collection, and exporting. The instrumentation component allows you to add code to your app for telemetry collection.
Once your app is instrumented, the OpenTelemetry Collector gathers telemetry from various sources in your stack at runtime and processes it for further analysis. OpenTelemetry then exports the collected telemetry to various backends, such as observability platforms, logging systems, and monitoring tools.
What are OpenTelemetry Logs?
OpenTelemetry Logs are time-stamped text records of events and activities with metadata. Any data—such as events or spans—that is not part of a distributed trace or a metric in OpenTelemetry is a type of or attached to a log.
Logs provide detailed insights into application health, including errors, warnings, and significant events. They facilitate debugging and enable proactive decision-making for app improvements. With OpenTelemetry, you can integrate alerting systems that notify you when specific log patterns or keyword triggers appear.
Unlike metrics and traces, logs have traditionally been collected using built-in programming language capabilities or external libraries. OpenTelemetry supports existing logging libraries while enhancing integrability and observability. The Logs Bridge API allows seamless log collection by incorporating existing logging frameworks into your stack.
Additionally, OpenTelemetry connects logs to traces and metrics, providing richer telemetry and easier troubleshooting. By capturing span events that add context, simplify log interpretation, and enable deeper insights into application behavior.
We at Middleware use OpenTelemetry standards to provide a full-stack logging solution that not only simplifies log management but also improves the overall observability of modern applications.
OpenTelemetry Logging Standards
OpenTelemetry logging standards are a set of rules designed to ensure that captured logs are structured and consistent across all the logs for a distributed system. These standards make it easier to generate and analyze log data, ensuring that every log entry has the context required for troubleshooting and monitoring.
Log Data Model components
The log data model in OpenTelemetry is built around three core components:
- Attributes: These are the key-value pairs that add necessary context to each log entry for better understanding. For example, attributes can include the service name, error code, or environment details. This way, they help in filtering and searching through log data, making it easier to highlight issues.
- Resources: Resources are used to identify the source of the log, such as the specific service or instance that generated the log. This can be particularly helpful in distributed systems, where knowing the source of a log entry can help you save a lot of time that you might spend tracing the log source.
- Events: Events capture specific actions along with timestamps. This allows you to see exactly what happened and when it happened, which is necessary to correlate logs with traces and metrics to know the exact performance of the application.
Log Data Model Format
OpenTelemetry supports multiple log formats to cater to different needs:
- JSON: JSON is widely adopted for its human-readable format. Having this format makes it easy to inspect and debug logs directly. It is also well-supported by many log management tools, including Middleware.
- Protobuf: Protobuf is ideal for environments that demand high performance and efficiency. The USP of Protobuf is its compact binary format which reduces the overhead associated with high-volume logging, which makes it perfect for large-scale systems.
This flexibility in log formats allows organizations to choose the one that best fits their performance requirements and operational constraints.
OpenTelemetry Logging API
The OpenTelemetry logging API simplifies the process of integrating logging into your applications. It provides standard methods to generate logs that automatically include all the necessary attributes. By using OpenTelemetry API, developers can ensure that logs are uniformly structured across different services and tech stacks.
Opentelemetry Logs Components
Log components are the building blocks of an effective logging system, which enables efficient collection, processing, and management of log data. These components break down the logging process into different roles to ensure that every log entry is accurate and securely transferred for effective analysis.
Log Producer: Generating Logs
The log producer is responsible for creating log entries. Whether integrated directly into your code or through dedicated instrumentation libraries, the log producer will make sure that each incident is captured as soon as it occurs.
Additionally, it adds important context to each log entry, including attributes and resources so that every log that is captured carries all the necessary details to help troubleshoot the issue later.
Log Exporter: Sending Logs to the Backend
Once the logs are generated by the log producer, the next step is to transmit the generated logs securely to the central location, and this is where the log exporter comes in. The log exporter takes the formatted logs (in JSON, Protobuf, or another supported format) and sends them to a backend system.
Apart from sending logs to a central system, preserving the data integrity during transit and ensuring that logs are available for analysis are two main roles of a log exporter.
Log Collector: Collecting Logs from Multiple Sources
In distributed systems, where logs are generated from multiple services and instances, the log collector makes sure that these logs are collected and stored in a single central repository. By collecting logs from multiple locations, it provides you with a holistic view of the system’s performance.
This centralization is important for effective monitoring as it allows you to correlate log data with traces and metrics, by which you can streamline the troubleshooting process.
To sum up all the points that we discussed in this section, here is a Python code that covers all the points.
It acts as a log producer by configuring a LoggerProvider with resource attributes so that each log entry is enriched with important details (like service and host information), it then uses an OTLPLogExporter as the log exporter to securely send these enriched logs to a central location, and this central endpoint represents the log collector that aggregates logs from multiple sources, enabling easy correlation with traces and metrics for comprehensive monitoring and troubleshooting:
from opentelemetry import logs, trace
 from opentelemetry.sdk.resources import Resource
 from opentelemetry.sdk.logs import LoggerProvider, LoggingHandler
 from opentelemetry.sdk.logs.export import SimpleLogRecordProcessor
 from opentelemetry.exporter.otlp.proto.http.logs_exporter import OTLPLogExporter
 import logging

 # Initialize LoggerProvider with resource context
 resource = Resource.create({"service.name": "order-service", "host.id": "server-12"})
 lp = LoggerProvider(resource=resource)
 logs.set_logger_provider(lp)
 lp.add_log_record_processor(SimpleLogRecordProcessor(OTLPLogExporter(endpoint="http://localhost:4317")))

 # Set up standard logging
 logging.basicConfig(level=logging.INFO, handlers=[LoggingHandler()])
 logger = logging.getLogger("order_logger")

 # Emit a log with trace context if available
 span = trace.get_current_span()
 ctx = (f"TraceId: {span.get_span_context().trace_id}, SpanId: {span.get_span_context().span_id}"
    	if span.get_span_context().is_valid else "No span")
 logger.info(f"Order processing failed. {ctx}",
         	extra={"http.method": "POST", "http.status": 500, "error": "Timeout"})
Log Records
A log record provides details of an app event and contains two kinds of fields—which include descriptions of the log character. The fields are discussed below.
Named Top-level Fields
These are fields of specific type and meaning. These include mandatory or regularly occurring fields in both legacy and upcoming log formats (e.g., timestamps and TraceIds, respectively).
The semantics of top-level fields must be identical across all known log and event formats. It must also be easily and unambiguously convertible to the OpenTelemetry log data model.
Resource and Attributes Fields
Also called arbitrary key-value pairs, these fields are stored as “map<string, any>” and offer flexibility for log representation. They allow you to define custom fields and values in log messages using standardized or arbitrary semantic conventions.
They capture information specific to the application’s needs, such as user IDs, request IDs, and error codes.
The fields are described in the table below.
| Field Name | Description |
| Timestamp | This represents the time the event occurred, measured by the source time. |
| ObservedTimestamp | This shows the time the event was observed by the collection system. |
| Trace Context Fields | These include the TraceId, SpanId and TraceFlags, and are useful in data correlation. |
| SeverityText | This is also known as log level, which are TRACE, DEBUG, INFO, WARN, ERROR, FATAL. |
| SeverityNumber | This is the numerical value of severity; includes 1-4 for TRACE, 5-8 for DEBUG, 9-12 for INFO, 13-16 for WARN, 17-20 for ERROR, and 21-24 for FATAL. |
| Body | This is the main message of the log record. It can be a human-readable string message describing the event in a free form. |
| Resource | This describes the source of the log. It can contain information about the instrumented app or the infrastructure on which the app runs. |
| InstrumentationScope | This describes the scope that emitted the log. It is often represented in a tuple of strings. |
| Attributes | This contains additional information about the event. Unlike the Resource field, which is fixed for a particular source, Attributes can vary for each occurrence of the event coming from the same source. |
These fields are usually represented in a typical log record as exemplified below.
OpenTelemetry Log Record Examples
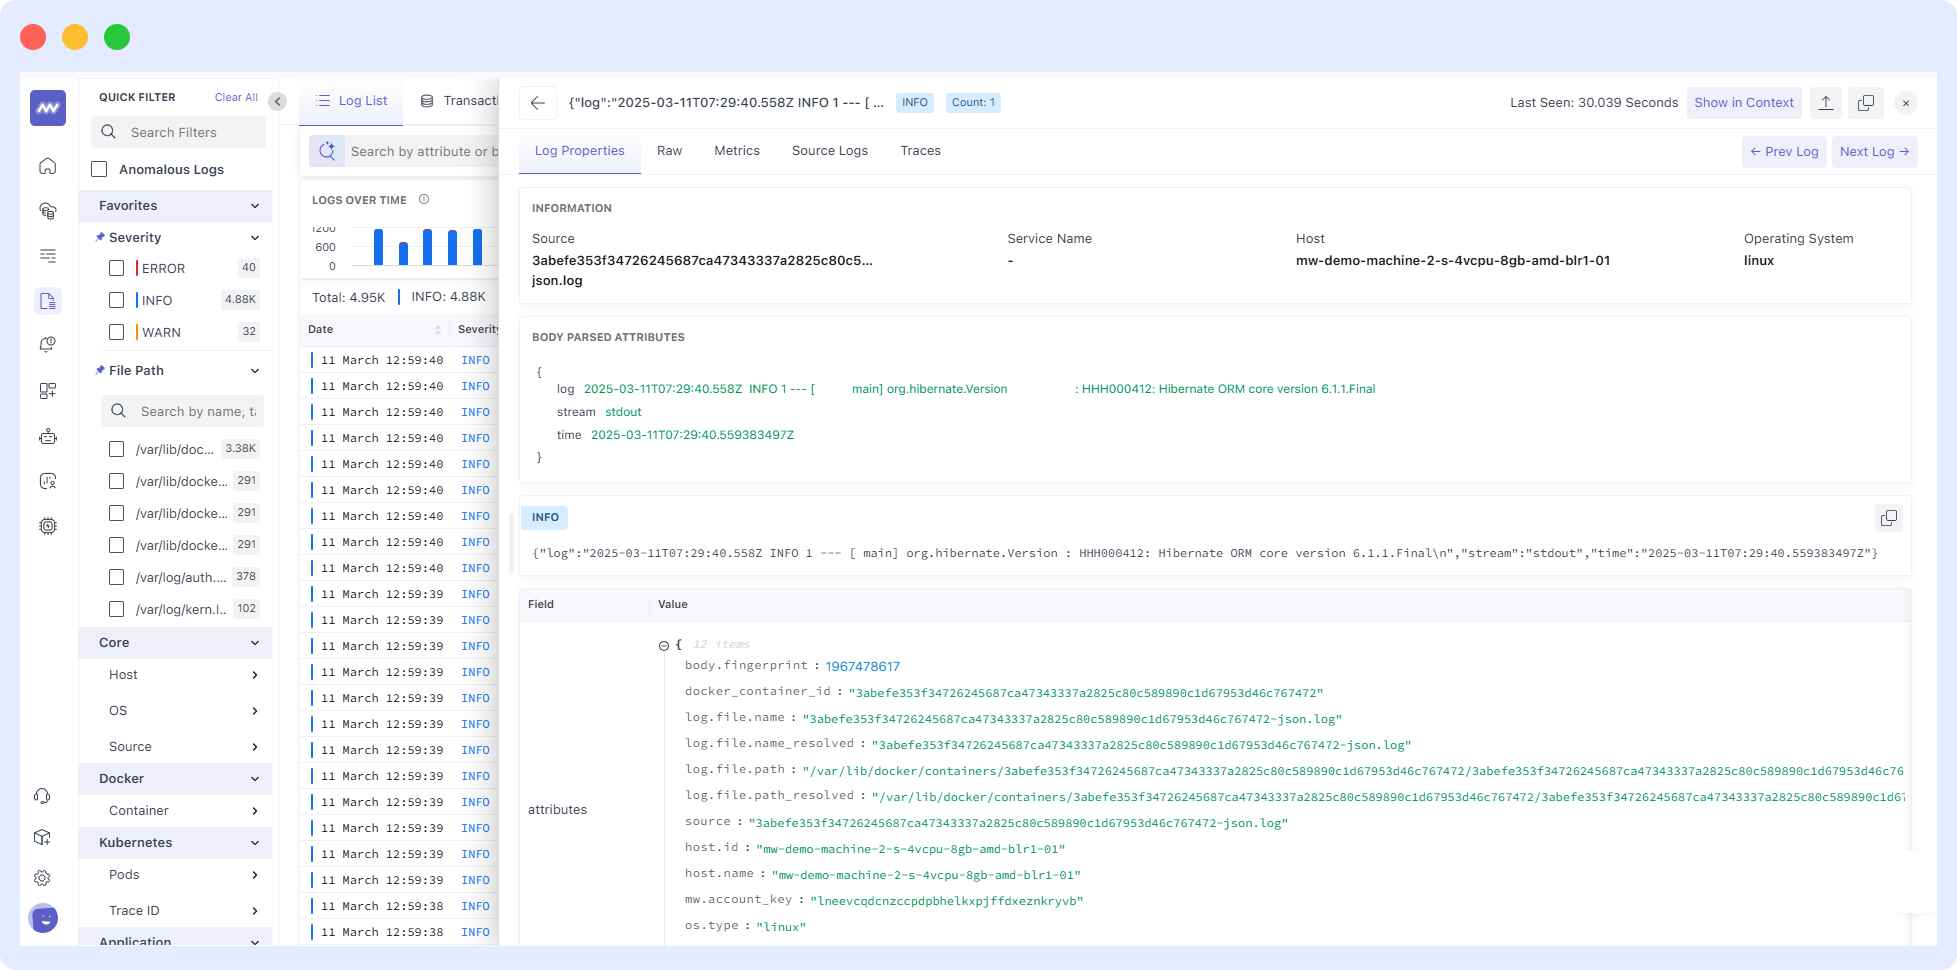
For example, this OpenTelemetry log captures an HTTP 500 error in an order processing backend. TraceId/SpanId links to distributed traces in Middleware’s dashboard for full request context. Resource identifies the service/environment, while Attributes adds HTTP/user context for filtering.
The SeverityNumber 17 (ERROR) triggers Middleware’s alerting rules:
{
   "Timestamp": "2025-03-09T20:21:00Z",
   "TraceId": "7bba9f33312b3dabc8f8e90c7c61f194",
   "SpanId": "2a3f5c8d1e6b4a09",
   "SeverityText": "ERROR",
   "SeverityNumber": 17,
   "Body": "HTTP 500 error processing /api/v1/orders",
   "Resource": {
 	"service.name": "order-backend",
 	"middleware.environment": "production",
 	"k8s.cluster": "east-cluster-01"
   },
   "Attributes": {
 	"http.method": "POST",
 	"http.route": "/api/v1/orders",
 	"user.id": "cust_7890",
 	"error.stacktrace": "TimeoutException: Database connection failed"
   }
 }
Also, this is what an OTel’s Log record might look like, following the log data model and in JSON format.
"Timestamp" : "1634630600000",
  "ObservedTimestamp" : "1634630601000",
  "TraceId" : "xyz7890",
  "SpanId" : "ijkl4321",
  "SeverityText" : "INFO",
  "SeverityNumber" : "6",
  "Body" : "A successful request has been processed.",
  "Resource" : {
    "service.name" : "web-backend",
    "host.name" : "web-server-2"
  },
  "InstrumentationScope": {
    "Name" : "JavaLogger",
    "Version": "1.0.0"
  },
  "Attributes" : {
    "http.method": "POST",
    "http.status_code": "200"
  }
So, how do we collect this data?
Methods of Log Data Collection
Whether you are instrumenting a system, first-party app or third-party app, OpenTelemetry offers two approaches to data collection. We’ll discuss them below.
Via File or Stdout Logs
This is a method where logs are written to an intermediary medium (e.g. file or stdout). An important advantage of this method is that it minimizes the need for changes in the way logs are produced and where they are written by the application.
This approach requires the ability to read file logs and handle them correctly, even when log rotation is used. The approach may also optionally require the ability to parse the logs and convert them into more structured formats using various types of parsers.
This approach requires the ability to read file logs and handle them correctly, even when log rotation is used. The approach may also optionally require the ability to parse the logs and convert them into more structured formats using various types of parsers.
To do this, OpenTelemetry recommends using the Collector or (if it is unable to) other log collection agents (e.g., FluentBit). Parsers can be configured to handle custom log formats or common ones—such as CSV, Common Log Format, LTSV, Key/Value Pair format, and JSON.
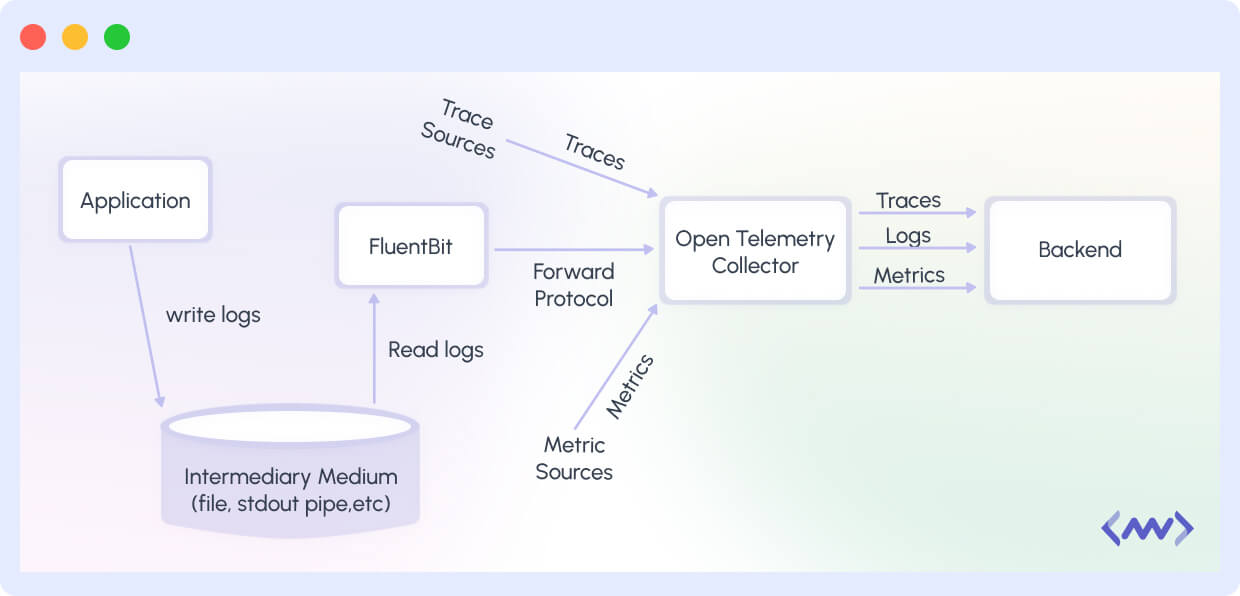
An important drawback of using the intermediary medium is that it requires file reading and parsing, which can be difficult, time-consuming, and unreliable if the output format is poorly defined.
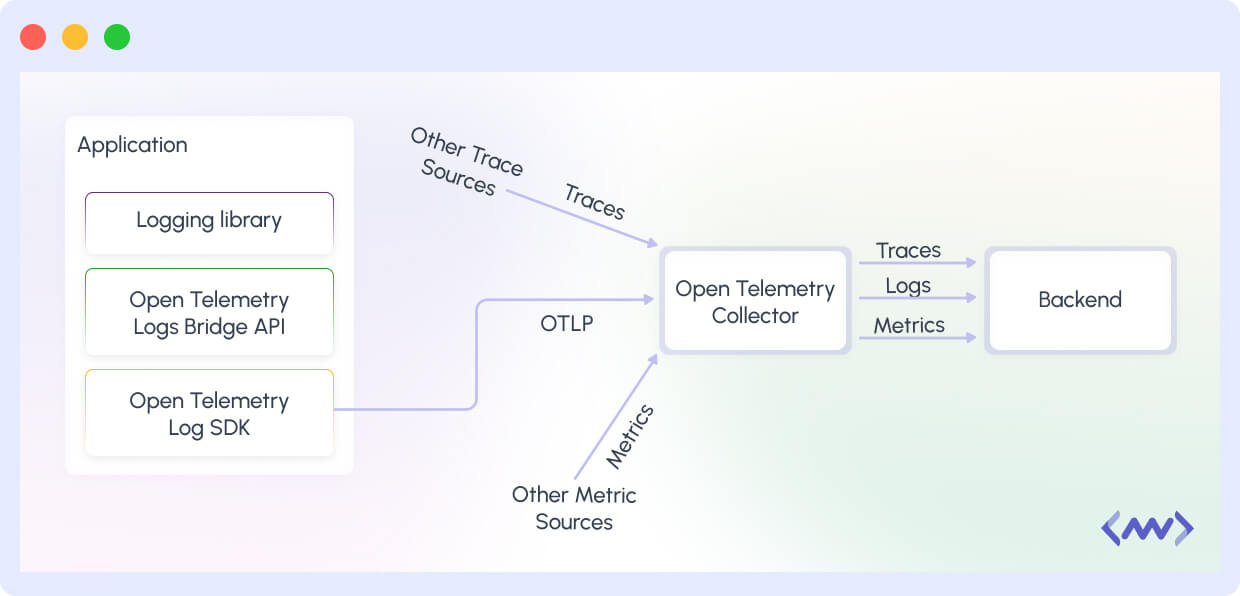
Direct to Collector
This approach involves modifying the application to output logs via a network protocol, such as OTLP. This can be achieved conveniently by providing add-ons or extensions for commonly used logging libraries.
The add-ons send logs over the selected network protocol. This requires you to make minimal localized changes to your app code, typically focused on updating the logging target.
Once logs are collected, the Collector enriches them with resource context, similar to how it is done for third-party apps. This enrichment ensures that the logs have comprehensive correlation information across all context dimensions.
The advantages of this approach are that it reduces the complexities associated with emitting file logs (such as parsing, tailing, and rotation), emits logs in a structured format, and allows logs to be sent directly to the logging backend without a log collection agent.
However, this approach is not without its disadvantages. It removes local log files, which simplifies local log reading from the equation. It also adds a compatibility challenge: the logging backend must be capable of receiving logs from OTLP or any other OpenTelemetry-compatible network protocol.
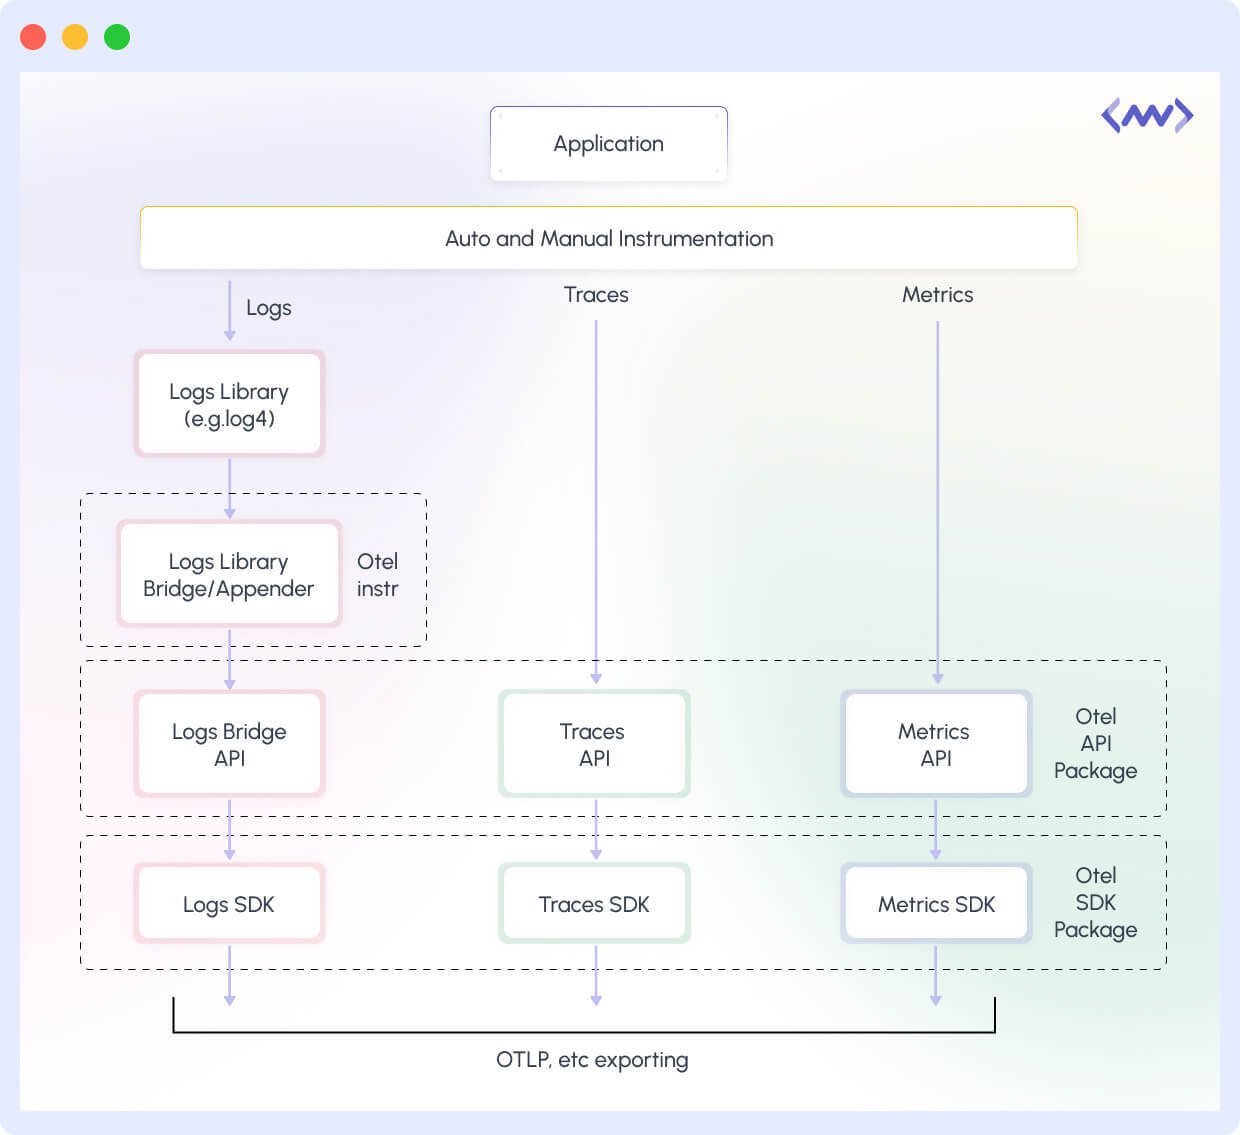
To facilitate the approaches discussed above, OpenTelemetry offers a Bridge API and SDK. This tool can be used alongside existing logging libraries to automatically include trace context in emitted logs and simplify the process of sending logs via OTLP.
Log appenders utilize the API to bridge logs from existing libraries to OpenTelemetry’s data model, and the SDK ensures proper processing and export of the logs.
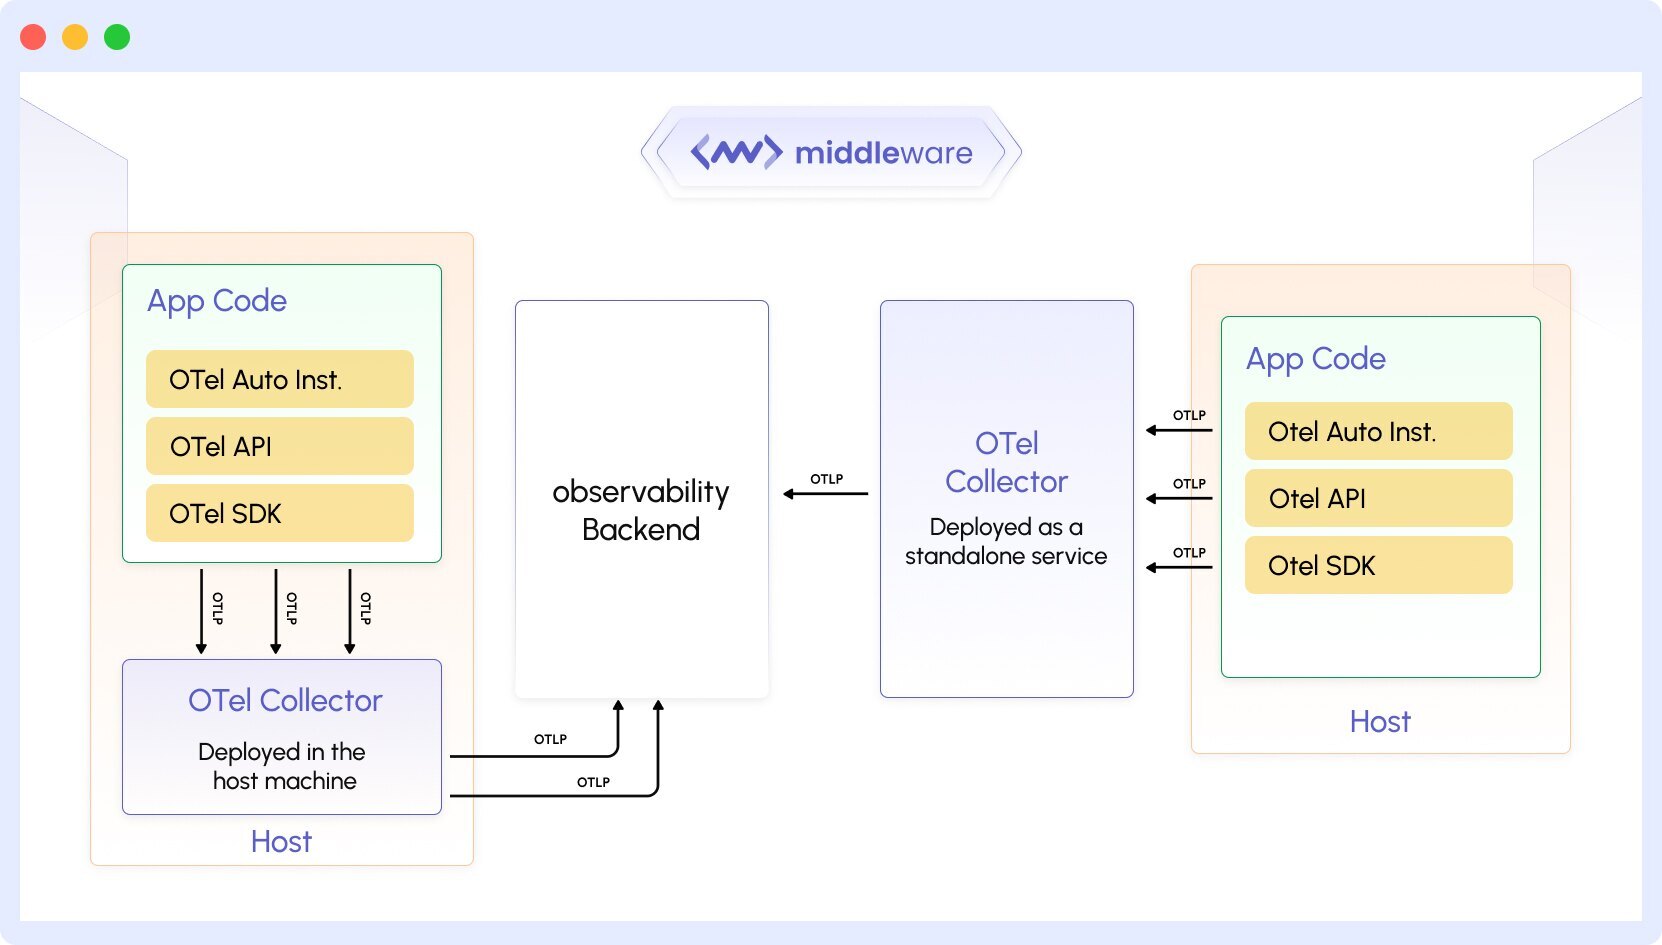
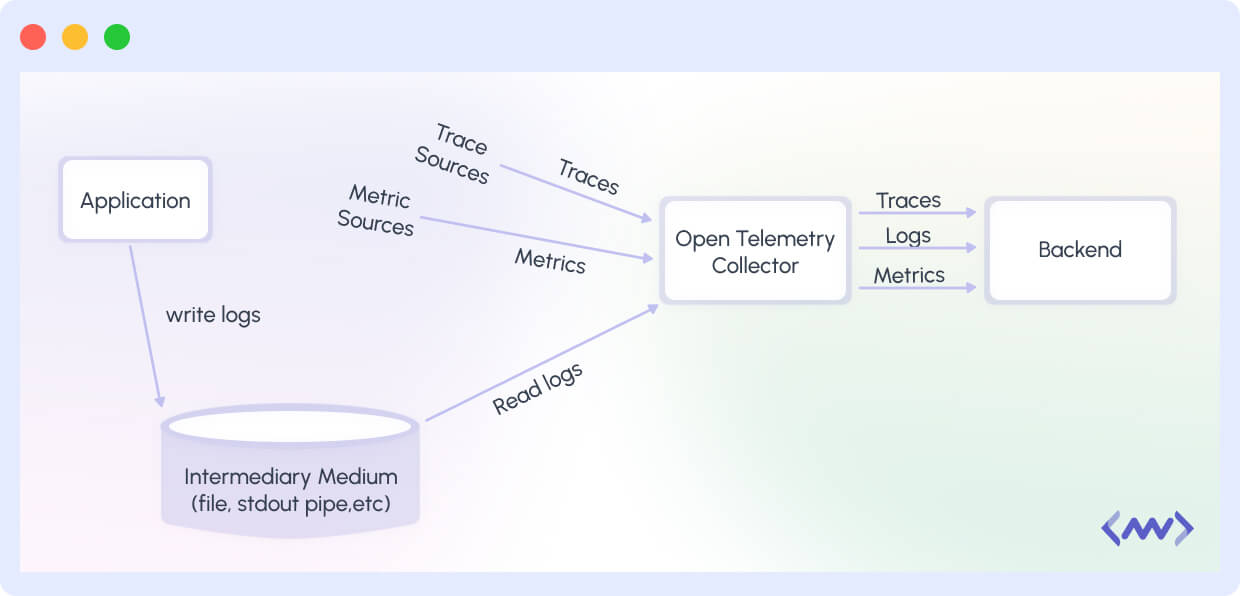
The image above displays how the two approaches work in legacy first-party application logs, third-party application logs, and system logs. The diagram below shows how a new first-party application uses OpenTelemetry API, SDK, and the existing log libraries.
The logs are directed to the OpenTelemetry Collector via OTLP. OpenTelemetry Collector’s logs apparently follow the OTel Logs Data Model, which eases the process.
Having explained the architecture of the OpenTelemetry Data Model, let’s consider why and how OpenTelemetry improves on existing logging solutions.
Integration with Other OpenTelemetry Components
OpenTelemetry was developed to create an ecosystem for observability platforms, and its logging capabilities follow its roots as well. By integrating logs with other telemetry data, you can have a complete understanding of the deployed application, including its performance metrics and issues.
In this section, we will walk you through how OpenTelemetry logs work along with tracing and metrics.
Tracing: Correlating Logs with Traces
Tracing allows you to view the path taken by a request as it goes through multiple services. By correlating logs with these traces, you can see the exact number of events leading up to an error or a performance bottleneck.
When you link logs to traces, you can not only identify what went wrong but also where and why it happened altogether, eventually helping you troubleshoot more efficiently.
Metrics: Combining Logs with Metrics
Metrics are representations of your system’s performance in numbers, which include numerical performance indicators such as response times, error rates, and throughput. When logs are combined with these numerical indicators, you get a better context for understanding system behavior.
For example, you can cross-reference a sudden spike in errors with log entries to reveal underlying causes, which makes it easier to resolve issues and optimize performance.
Benefits of OpenTelemetry Logs
The OpenTelemetry log offers multiple benefits that improve the monitoring and management of distributed systems. These benefits are not only limited to streamlining the operations but also improving the overall reliability and efficiency of deployed applications.
Standardized Logging Format
By implementing a uniform structure for logs, OpenTelemetry ensures that all log entries are consistent, regardless of their diverse sources. The structured format, which includes attributes, resources, and events, makes it easier to collect, analyze, and correlate logs across different services.
This way, the result is a more efficient logging process with minimal need for custom integrations, which overall improves the observability ecosystem.
Improved Observability
When you combine a standardized logging format with traces and metrics, you provide a detailed view of your system’s behavior. When all components speak the same “language,” it becomes easier to monitor application performance and understand the context of each log entry.
With improved observability, you can detect and address problems before they start impacting the end customers.
Enhanced Troubleshooting
When you encounter a crash or a minor issue, with detailed log data, you can fast-track the diagnosis and come up with a solution a lot faster than traditional diagnosis. OpenTelemetry logs are context-rich with all the necessary and additional data allowing teams to quickly trace errors to their source.
By linking logs with distributed traces and performance metrics, developers can track the root cause of issues, effectively reducing downtime and speeding up the resolution process.
Implementing OpenTelemetry Logs
For effective implementation of OpenTelemetry logs, you are required to do thorough planning and configuration of logging infrastructure to get the most out of standardized logging. Here’s how to get started:
Choosing a Logging Backend
The first and most essential step is to choose the right backend that supports the OpenTelemetry data model. You can choose from popular options like Jaeger and Zipkin, which are widely used for their effectiveness in handling distributed tracing and logging data.
These platforms offer scalable storage and efficient querying features which are necessary for processing high volumes of log data in modern, cloud-native applications.
Here is a simple Python code that sets up your logging backend by defining essential resource attributes (like service name and environment) and initializes a LoggerProvider:
 from opentelemetry.sdk.resources import Resource
 from opentelemetry.sdk.logs import LoggerProvider
 from opentelemetry import logs

 # Define resource attributes to identify your service and environment
 resource = Resource.create({
 	"service.name": "my-backend-service",
 	"environment": "production"
 })

 # Initialize the LoggerProvider (the log producer) with these attributes
 logger_provider = LoggerProvider(resource=resource)
 logs.set_logger_provider(logger_provider)
Configuring Log Exporters and Collectors
After choosing a backend, you need to set up log exporters and collectors. Log exporters let you convert your logs into the required format such as JSON, Protobuf, or another supported format and securely send them to your chosen backend.
Meanwhile, the log collector collects logs from multiple services and instances and stores them in a central repository for data analysis.
Here is a simple Python code snippet that configures the log exporter by creating an OTLPLogExporter that sends logs to your central backend. A BatchLogRecordProcessor is added to efficiently batch and export these logs.
Finally, it integrates with Python’s logging module so that all generated log entries are automatically forwarded for centralized collection and analysis:
Middleware: Full-Stack Log Management
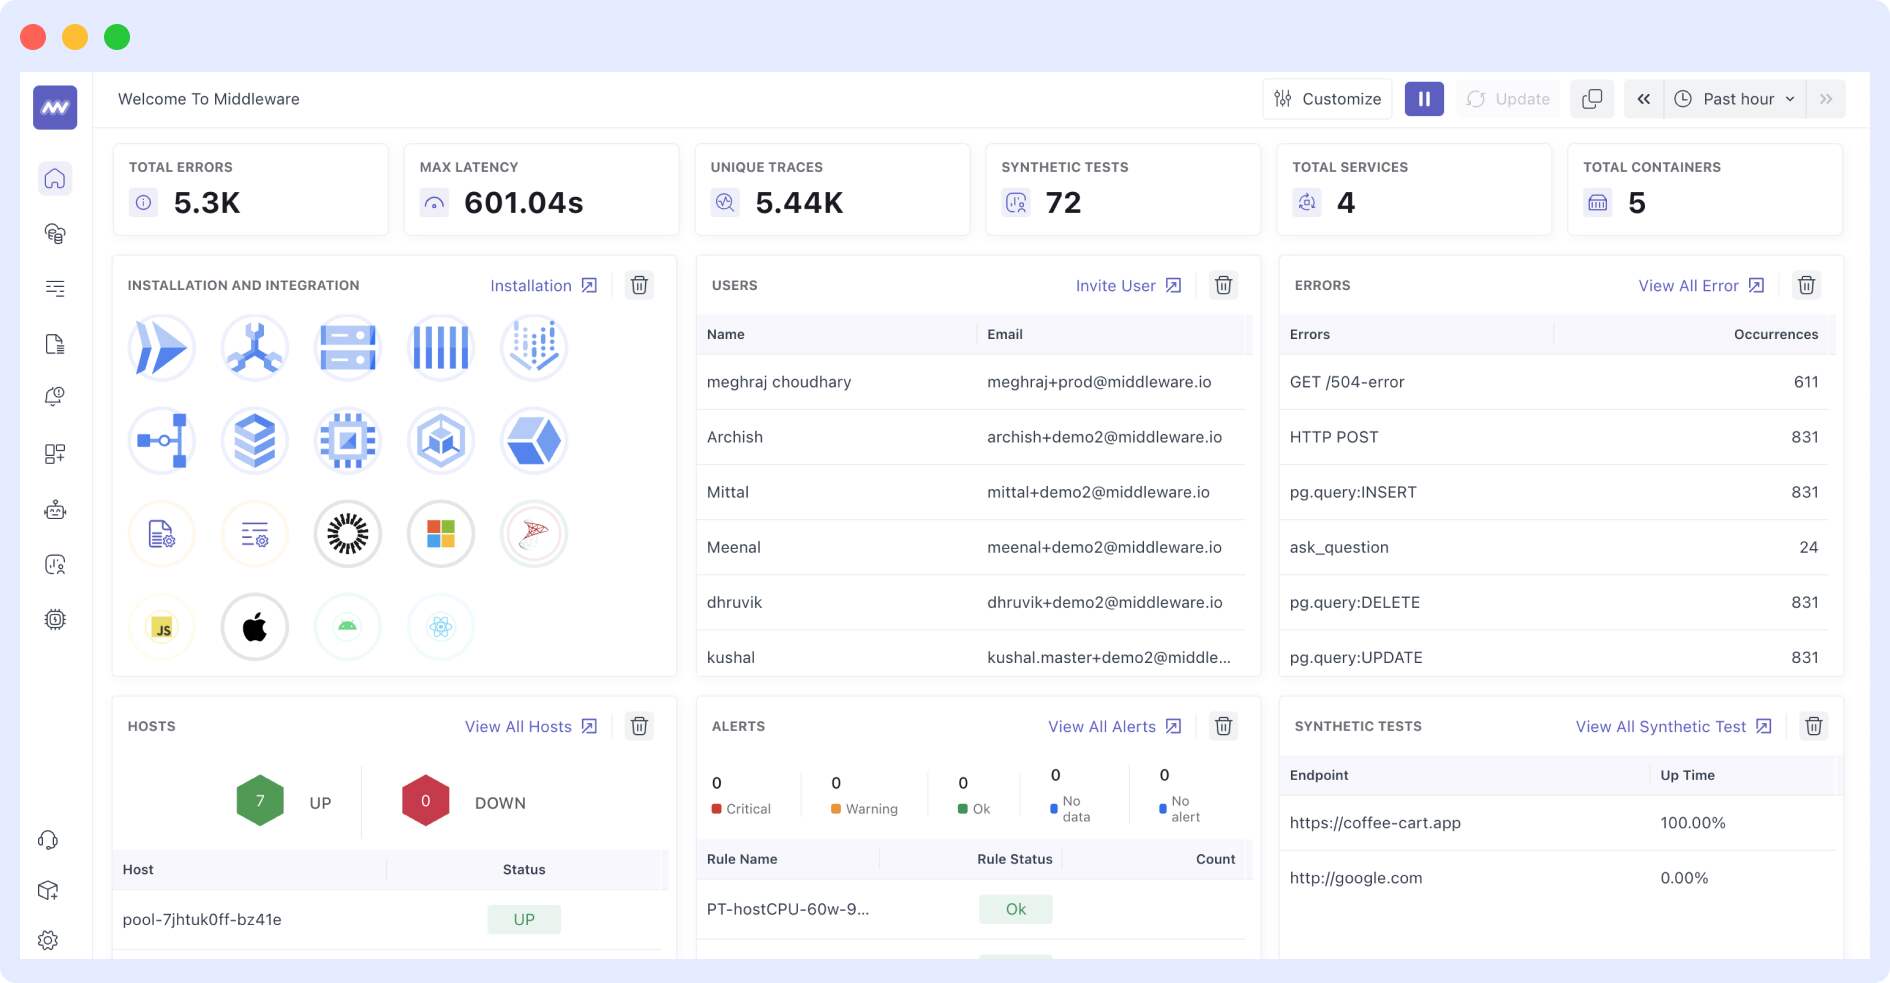
Middleware provides a logging solution that follows OpenTelemetry standards to simplify the management of logs across distributed systems. By unifying log generation, transmission, and analysis, Middleware ensures that your observability stack is efficient and easy to manage.
Log Integration with Middleware
Middleware aims to simplify the integration of OpenTelemetry logs into your observability ecosystem. The platform automates the configuration of log producers, exporters, and collectors, ensuring that every log entry is generated, transmitted, and collected consistently.
Key benefits of Middleware include:
- Automated Instrumentation: Middleware uses OpenTelemetry APIs to automate the entire process of instrumenting applications.
- Effective Correlation: We make sure that logs are correlated with traces and metrics to provide a complete view of the application’s performance.
- Optimized performance: Our platform was developed to handle high volumes of log data and ensure secure transmission of logs to the backend.
We have designed our platform to be straightforward so that even if you are using an observability platform for the first time, you will get there in no time.
Here are four basic steps that you can follow to get started:
- Sign Up: Like any other platform, you are required to create an account to gain full access to logging and observability tools.
- Instrument Your Application: Follow our guided setup to integrate OpenTelemetry logging APIs into your application.
- Configure Your Pipeline: Use Middleware’s dashboard to configure log exporters and collectors based on your system’s needs.
- Monitor and Analyze: Now, sit back and monitor logs in real-time.
In addition, the platform allows you to set up intelligent log-based alerts, which are sent via various channels such as Slack or Microsoft Teams to notify you when specific log events occur. You can configure alert rules based on log message patterns, log levels, or specific attributes.
By using Middleware’s array of powerful log visualization and analysis functionalities for your OpenTelemetry-instrumented applications, you can proactively identify and resolve issues, resulting in better software quality and user experience.
FAQ
How do you collect logs with OpenTelemetry?
Logs can be collected via File or Stdout Logs, sent directly to the Collector, depending on your app’s requirements and your preferences. Both options have their pros and cons.
What is the difference between a Log and an Event in OpenTelemetry?
While logs capture discrete events and messages, events capture the context of operations, including timing and causal relationships between different components of an app.
What is the difference between Telemetry and Log?
Telemetry is a broader term that encompasses logs, metrics, and traces, while logs specifically refer to captured messages or events representing the state and execution of an app.


