A simple internet search for a website monitoring tool will likely lead you to a Pingdom alternative if you’re looking beyond the basics. Pingdom is a website monitoring solution used to monitor the uptime, availability, and performance of websites and web applications. It offers tools to verify site accessibility and proper functionality for users.
With Pingdom, you can create uptime checks, mimic user behavior such as logins and checkout operations, and capture real user performance metrics from all over the globe.
Why Consider a Pingdom Alternative?
Pingdom adequately covers the basics. However, as their teams expand over time or the complexity of their requirements increases, they usually seek alternatives. Let’s explore key reasons why teams start looking for Pingdom alternatives.
Pricing Limitations: As usage scales, more checks, more users, more features. Pingdom’s pricing can become expensive compared to other flexible alternatives.
Limited Alerting & Notification Options: Pingdom’s alerting capabilities are relatively basic and may not support complex alerting logic or integrations needed for faster incident response.
Lack of Specialized Monitoring: For teams requiring in-depth APM, synthetic transaction monitoring, or log-level insights, Pingdom doesn’t offer sufficient depth.
Basic Incident Management Workflow: Pingdom lacks built-in tools for effective incident resolution, collaboration, and root cause analysis, pushing teams to integrate third-party tools.
Scalability Challenges: As infrastructure grows, teams need more than just uptime checks. Pingdom’s platform isn’t always ideal for scaling microservices or hybrid environments.
This article highlights 10 Pingdom alternatives with more advanced features, flexible pricing, and improved support for scaling teams.
Quick Comparison of Pingdom Alternatives
Before diving into the details of each tool, here’s a quick comparison of Pingdom alternatives to help you quickly identify which tools align with your needs and budget. This table covers the most important features teams typically look for when choosing a monitoring solution.
| Tools | Uptime Monitoring | Synthetic Monitoring | RUM | APM | Alerting | Integrations | Pricing |
| Middleware | ✔︎ | ✔︎ | ✔︎ | ✔︎ | ✔︎ | ✔︎ | Free/Usage-based |
| UptimeRobot | ✔︎ | ✔︎ | ✗ | ✗ | ✔︎ | ✔︎ | Free / $8 per month |
| StatusCake | ✔︎ | ✔︎ | ✗ | ✗ | ✔︎ | ✔︎ | Free/ $24.49 per month |
| Site24x7 | ✔︎ | ✔︎ | ✔︎ | ✔︎ | ✔︎ | ✔︎ | $8/month billed yearly |
| Betterstack | ✔︎ | ✔︎ | ✗ | ✗ | ✔︎ | ✔︎ | Free / Pay as you go |
| HetrixTools | ✔︎ | ✔︎ | ✗ | ✗ | ✔︎ | ✔︎ | Free / $9.95 per month |
| Checkly | ✔︎ | ✔︎ | ✔︎ | ✗ | ✔︎ | ✔︎ | Free/ $80 per month |
| Dotcom-Monitor | ✔︎ | ✔︎ | ✔︎ | ✗ | ✔︎ | ✔︎ | Depends on monitoring type |
| Uptrends | ✔︎ | ✔︎ | ✗ | ✗ | ✔︎ | ✔︎ | Depends on monitoring type |
| Uptime.com | ✔︎ | ✔︎ | ✔︎ | ✗ | ✔︎ | ✔︎ | $9/month |
Top 10 Pingdom Alternatives in 2026
Now that you’ve seen a quick feature comparison, let’s explore each tool in more detail and what they offer.
1. Middleware
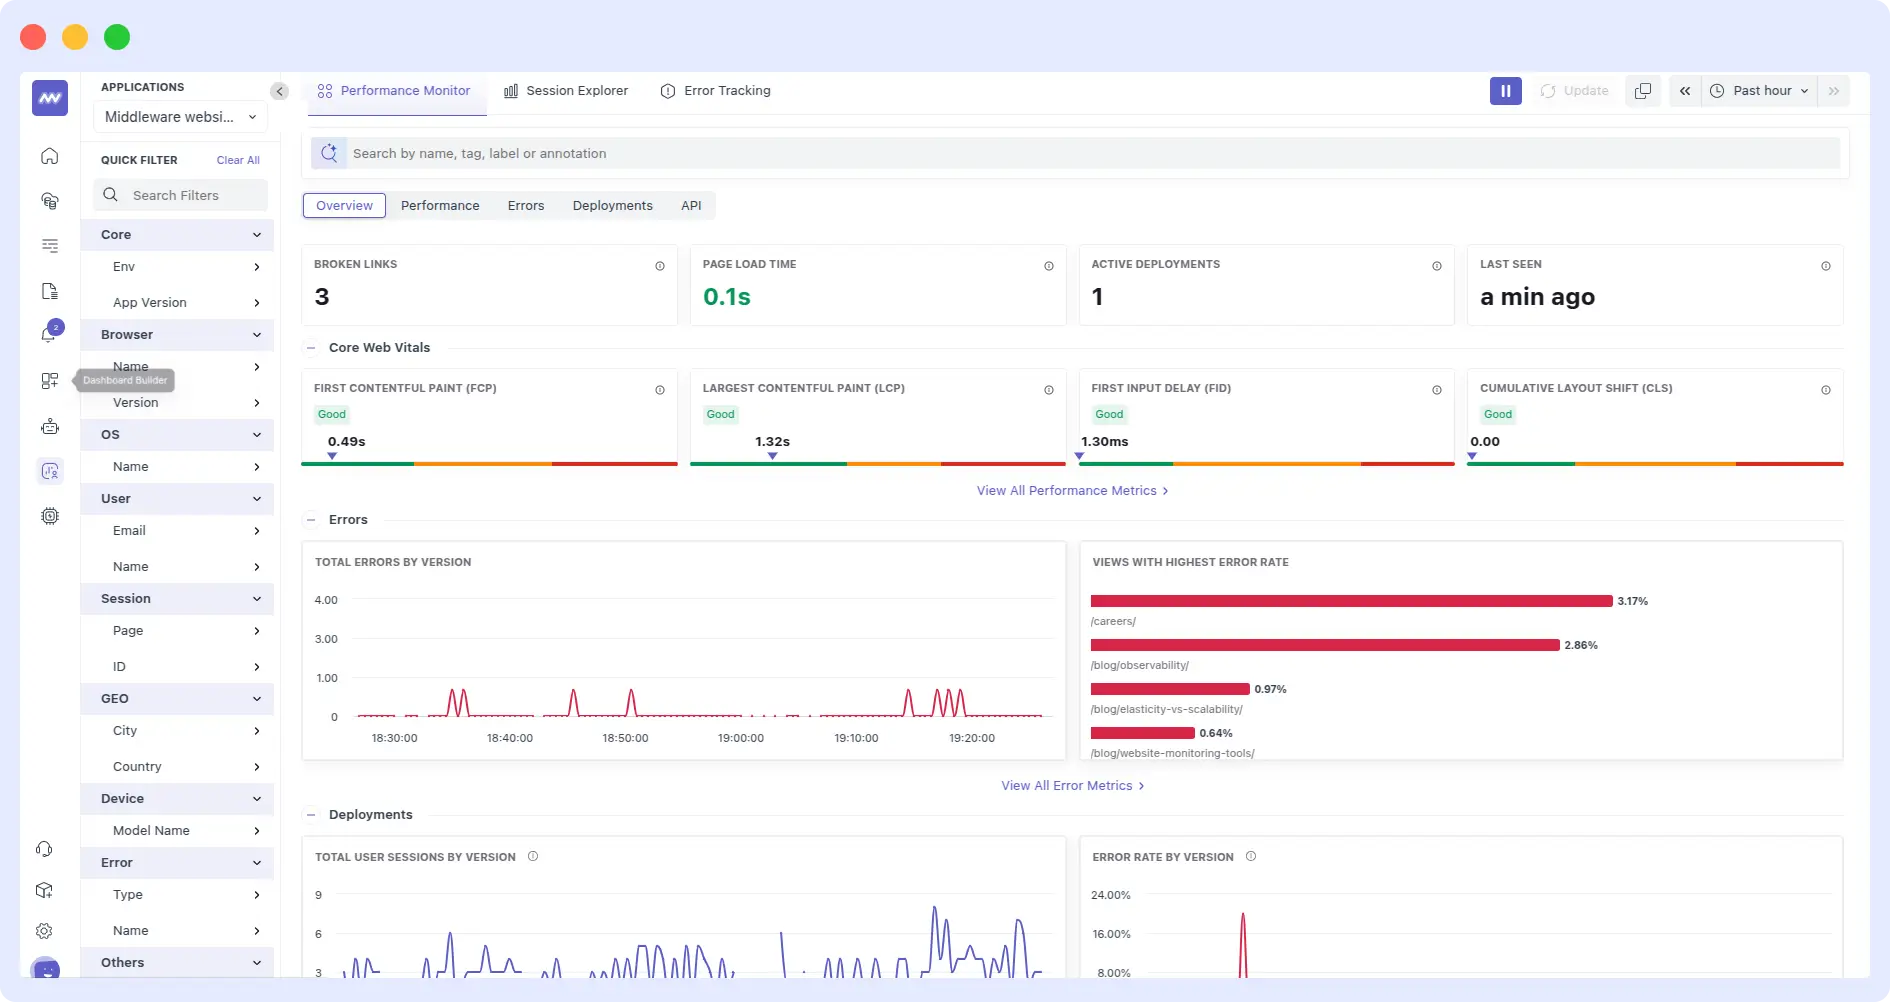
Middleware is a full-stack observability platform and a powerful Pingdom alternative that combines various monitoring tools to help teams track real user experience, simulate user journeys, and quickly resolve performance issues. It offers Real User Monitoring (RUM), synthetic monitoring, session replays, Core Web Vitals tracking, and smart alerts, providing complete visibility across your tech stack.
Features:
Real User Monitoring
Middleware provides you with real-time insight into how real users actually see your website or application. It tracks page loading time, device and browser types, geographic regions, and network conditions. This informs you of slow pages or geographically specific issues.
Middleware tracks Google’s Core Web Vitals of Largest Contentful Paint (LCP), First Input Delay (FID), and Cumulative Layout Shift (CLS), providing actionable recommendations to increase page speed and usability. Using RUM enables you to know if issues are front-end or back-end related.
Synthetic Monitoring
You can also simulate user interactions in Middleware’s synthetic monitoring to anticipate and confirm the accessibility and responsiveness of your APIs or web pages. These simulations are able to run from multiple geographic locations and across different types of devices to enable you to confirm the consistency of response for each user.
Middleware also offers features such as step-by-step workflows, waterfalls of performance, and automatic screenshotting to enable complete context surrounding each simulation being tested.
Session Replays
Middleware introduces session replaying abilities, which store and replay user sessions in real time to illustrate precisely how visitors interact with your website. Mouse movements, clicking, scrolling, and input are included, allowing you to see where users get stuck, hesitate, or abandon work. Session replays are useful to debug UI/UX issues and validate design changes.
You can also hide input fields with personal data to secure the data of the user using privacy tools.
What is Session Replays? How To Use It Effectively
Core Web Vitals Monitoring
In addition to being included in RUM, Middleware offers specific tools to track Core Web Vitals as isolated performance metrics. These include LCP to gauge load speed, FID to gauge responsiveness, and CLS to gauge visual stability. Monitoring these metrics helps improve user experience and SEO.
Get a complete understanding of how to use both real user monitoring and synthetic checks to improve your site’s performance scores.
👉 Read Now
Smart Alerting
Middleware’s alert system reduces noise by allowing configurable alerts based on thresholds, anomalies, or failures. It integrates with Slack, Teams, PagerDuty, and more. Features include alert deduplication, escalation policies, and scheduling to manage notifications effectively.
Learn how Middleware detected anomalies the moment they happened faster than traditional polling-based tools.
👉 Explore our guide on real-time alerting
Pros:
- Combines real user monitoring, synthetic checks, session replays, and Core Web Vitals tracking in one platform
- Provides deep insights into actual user experience and technical performance
- Smart alerting helps teams respond quickly to issues
- Session replays make troubleshooting easier by showing exactly what users experienced
Cons:
- Some advanced features might be more than what small teams or simple projects need
Pricing:
Free Forever Plan
- 100GB of data ingestion per month
- 1,000 Real User Monitoring (RUM) sessions
- 20,000 synthetic checks
Pay-As-You-Go Plan
- $0.30 per GB for metrics, logs, and traces
- $1 per 1,000 RUM sessions
- $1 per 5,000 synthetic checks
- 30-day data retention
2. UptimeRobot
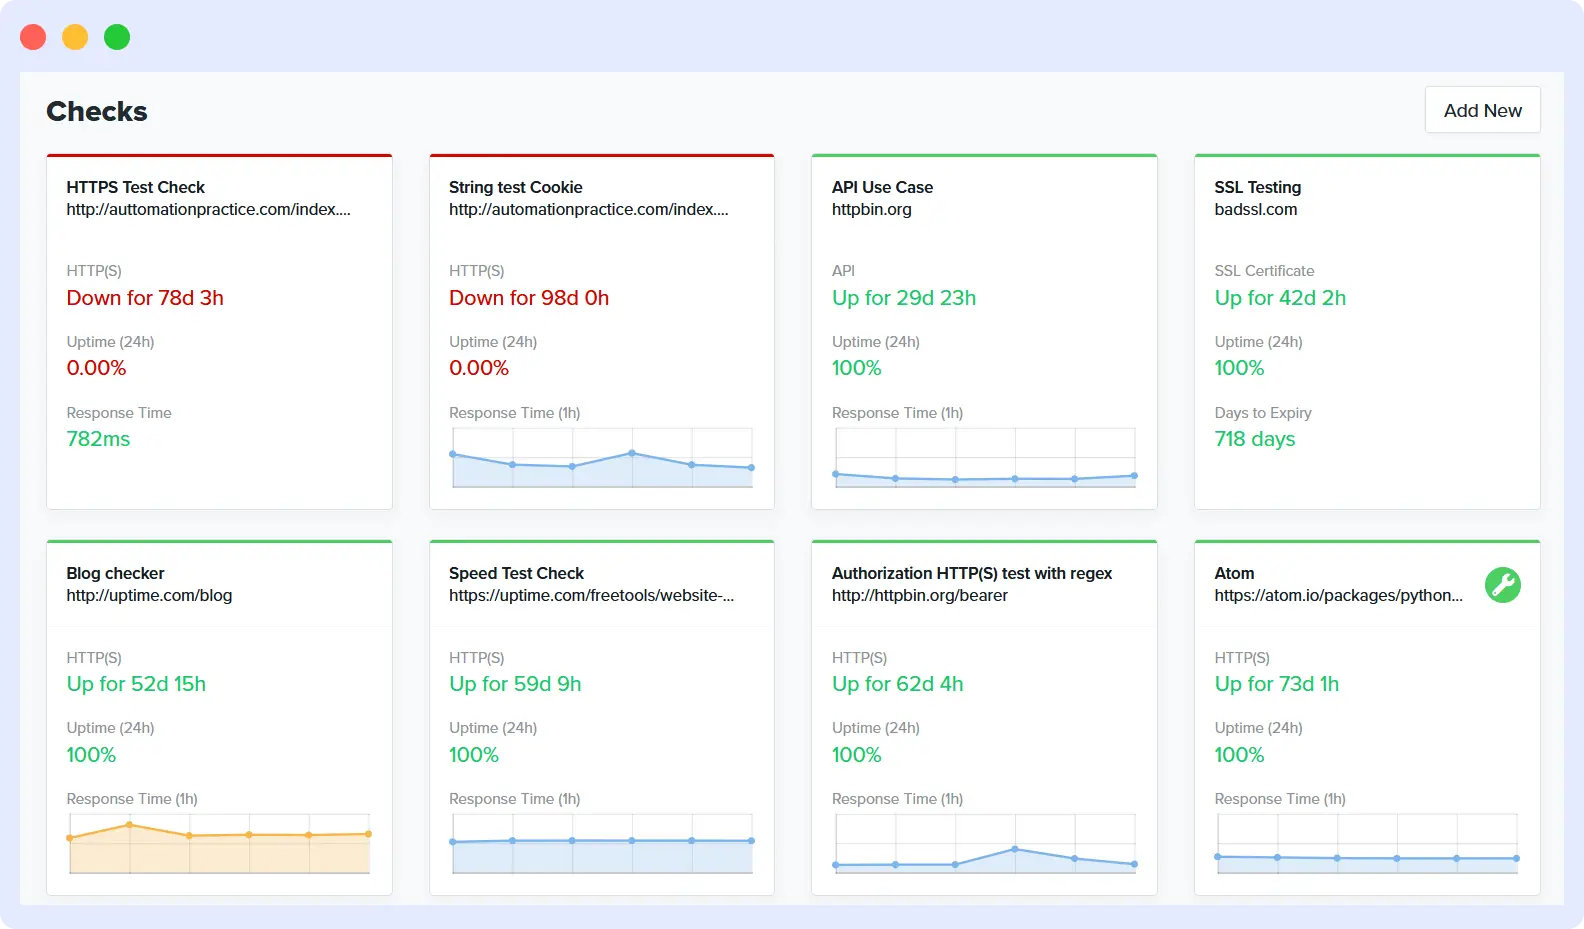
UptimeRobot is a lightweight monitoring tool and a popular alternative to Pingdom, built primarily for uptime checks. It allows users to track the availability and performance of websites, APIs, ports, and keywords using protocols like HTTP(s), Ping, TCP, and UDP.
It supports various monitoring types, including HTTP(s), SSL certificate, domain expiry, and cron job monitoring, helping users quickly detect and respond to downtime or service issues.
Features:
- Tracks uptime using HTTP(s), Ping, TCP/UDP Port, and Keyword checks
- Offers SSL certificate monitoring and Domain expiration checks
- Cron job monitoring for scheduled task tracking
- Visual response time charts for performance tracking
- Maintenance windows to pause checks during scheduled updates
- Multiple alerts and notification channels (email, SMS, webhook, Slack, Telegram, Discord)
Pros:
- Free tier includes up to 50 monitors, ideal for small projects or individual developers
- Covers a wide range of protocols and services for basic uptime needs
- Public status pages with custom branding options to help share incidents and maintenance with your users
Cons:
- Doesn’t support synthetic monitoring with scripted user journeys or multi-step flows.
- No Real User Monitoring (RUM), so you won’t get insights into actual user performance.
- Lacks Application Performance Monitoring (APM) and deep integrations with CI/CD or incident workflows.
Pricing:
- Free plan with 50 monitors (5-min checks).
- Solo: $8/month (10 monitors)
- Team: $34/month (100 monitors)
- Enterprise: $64/month (200 monitors)
3. StatusCake
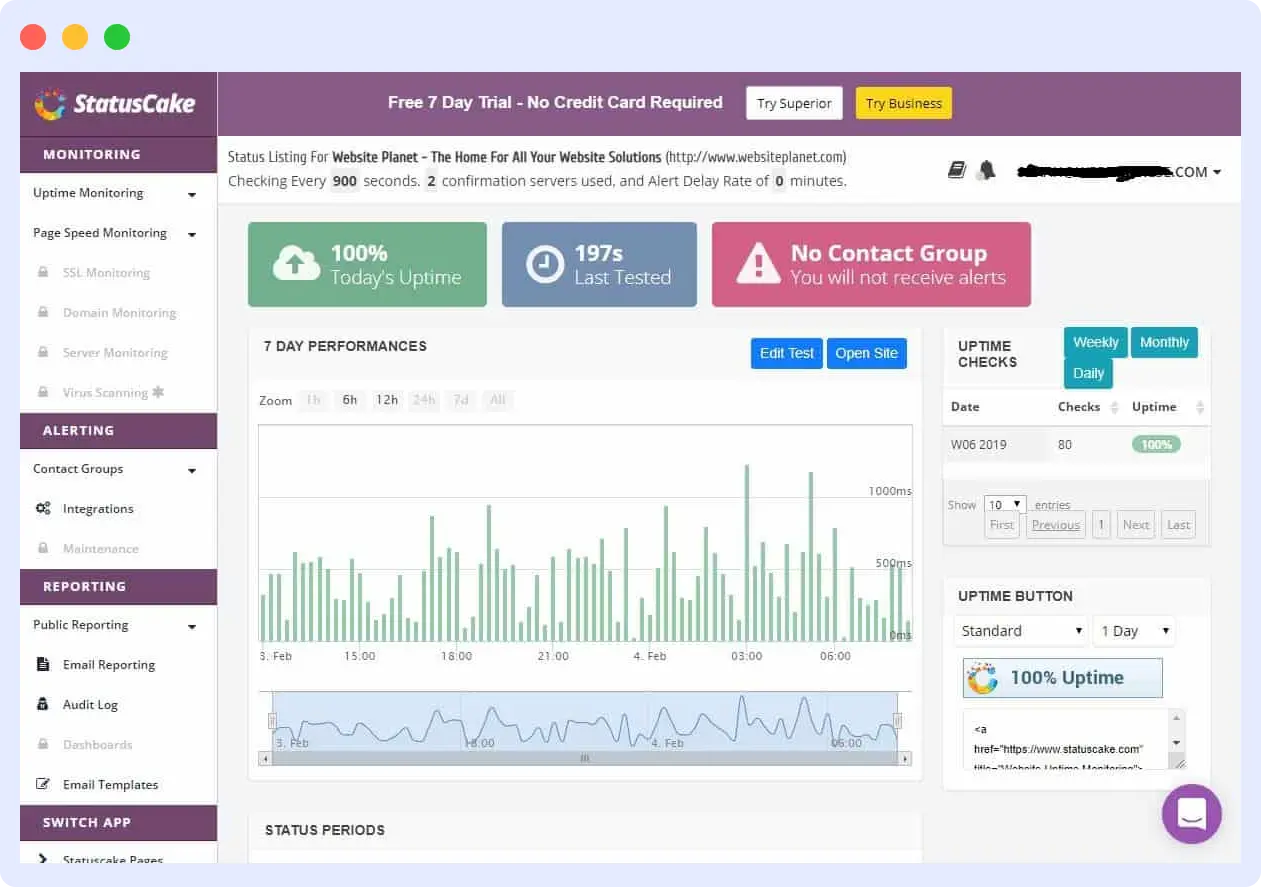
StatusCake is a web monitoring software and a reliable Pingdom alternative that monitors the uptime, performance, and domain health of websites, servers, and APIs. It offers different types of monitoring such as HTTP(s), TCP, SMTP, SSH, and DNS checks. It has more than 30 monitoring locations across the world and offers in-depth insights in terms of performance and availability. It also offers SSL certificate monitoring, page speed analysis, and domain expiry monitoring.
Features:
- Uptime monitoring supporting HTTP(s), TCP, SMTP, SSH, and DNS checks
- Page speed monitoring to track load times and identify bottlenecks
- SSL monitoring with expiry alerts
- Domain monitoring for expiration and blacklist status
- Comprehensive dashboard for easy overview
- Server monitoring, including CPU, memory, disk usage, and load average
Pros:
- Extensive global coverage with over 30 monitoring locations worldwide
- Wide range of monitoring capabilities across different protocols
- Public status pages to communicate incidents and uptime.
Cons:
- No real user monitoring (RUM) or synthetic transaction monitoring
- Limited analytics or performance visualization tools
Pricing:
- Free Plan includes uptime, page speed, and SSL monitoring
- Superior Plan starts at $24.49/month
- Business Plan starts at $79.99/month
- Custom pricing is available for companies with specific needs and unlimited team members
4. HetrixTools
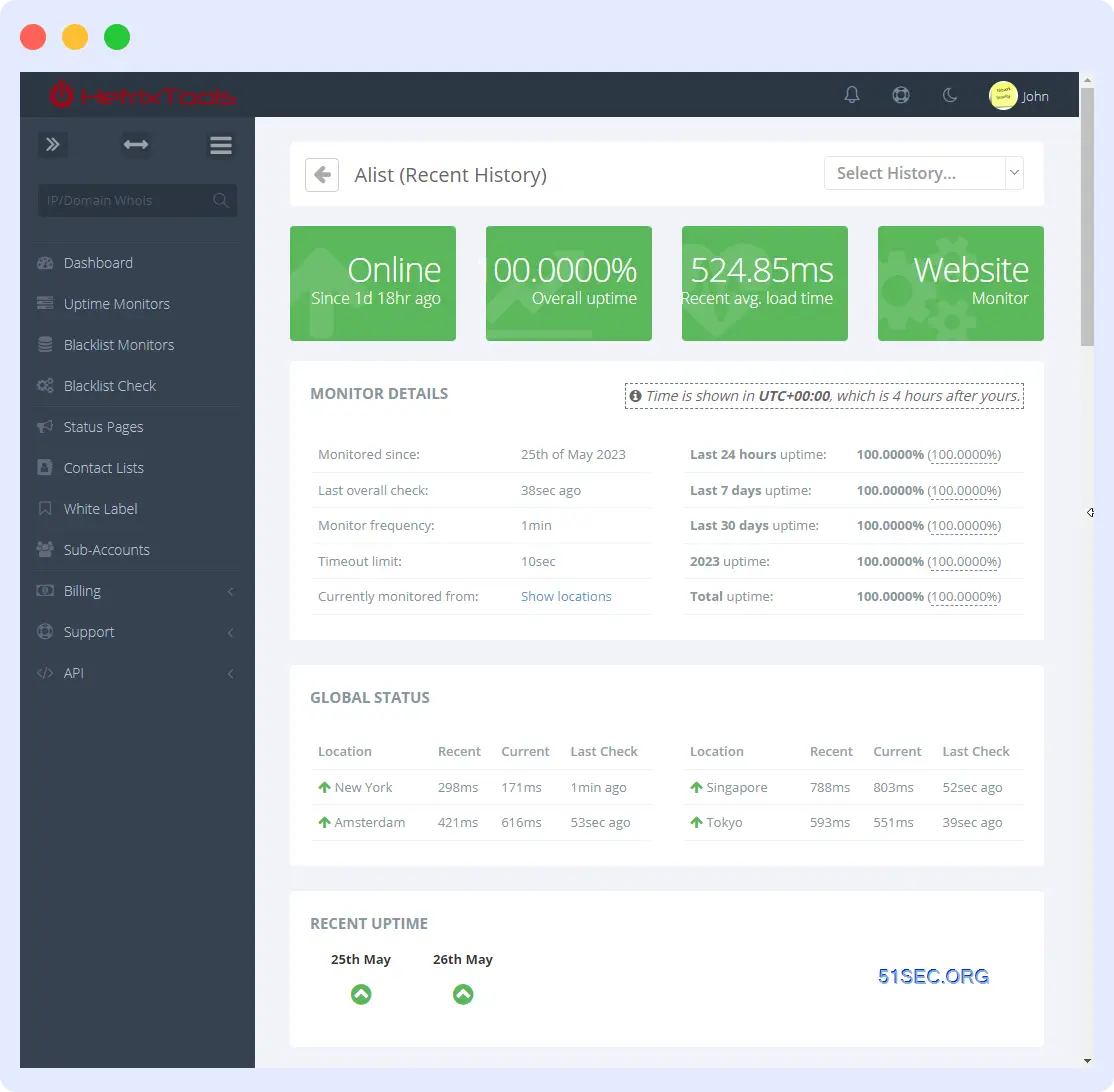
HetrixTools is a lightweight monitoring platform and a great Pingdom alternative that offers uptime checks, blacklist monitoring, and basic server health tracking. It’s designed for users who want fast, reliable alerts without the complexity of a full observability stack. The platform also includes SSL and domain expiration checks, public status pages, and integrations with common alerting tools.
Features:
- Monitor websites and services with 1-minute intervals from multiple global locations
- Track IP addresses and domains against over 100 blacklists to ensure email deliverability
- Use the HetrixTools Server Agent to monitor CPU, RAM, disk usage, and specific services on your servers
- Nameserver Monitoring to detect changes in your domain’s nameservers to safeguard against unauthorized modifications
- Custom maintenance windows and scheduled downtime
- Multiple notification channels including email, SMS, webhooks, Slack, Discord, and Telegram
Pros:
- Clean, straightforward interface that’s easy to navigate
- Includes both domain and IP blacklist monitoring
Cons:
- Limited advanced features like transaction monitoring or real user monitoring
- Fewer third-party integrations compared to larger platforms
Pricing:
- Free plan with up to 15 monitors
- Professional plan starts at $9.95/month
- Business plan starts at $19.95/month
- Enterprise plan starts at $49.95/month
5. Checkly
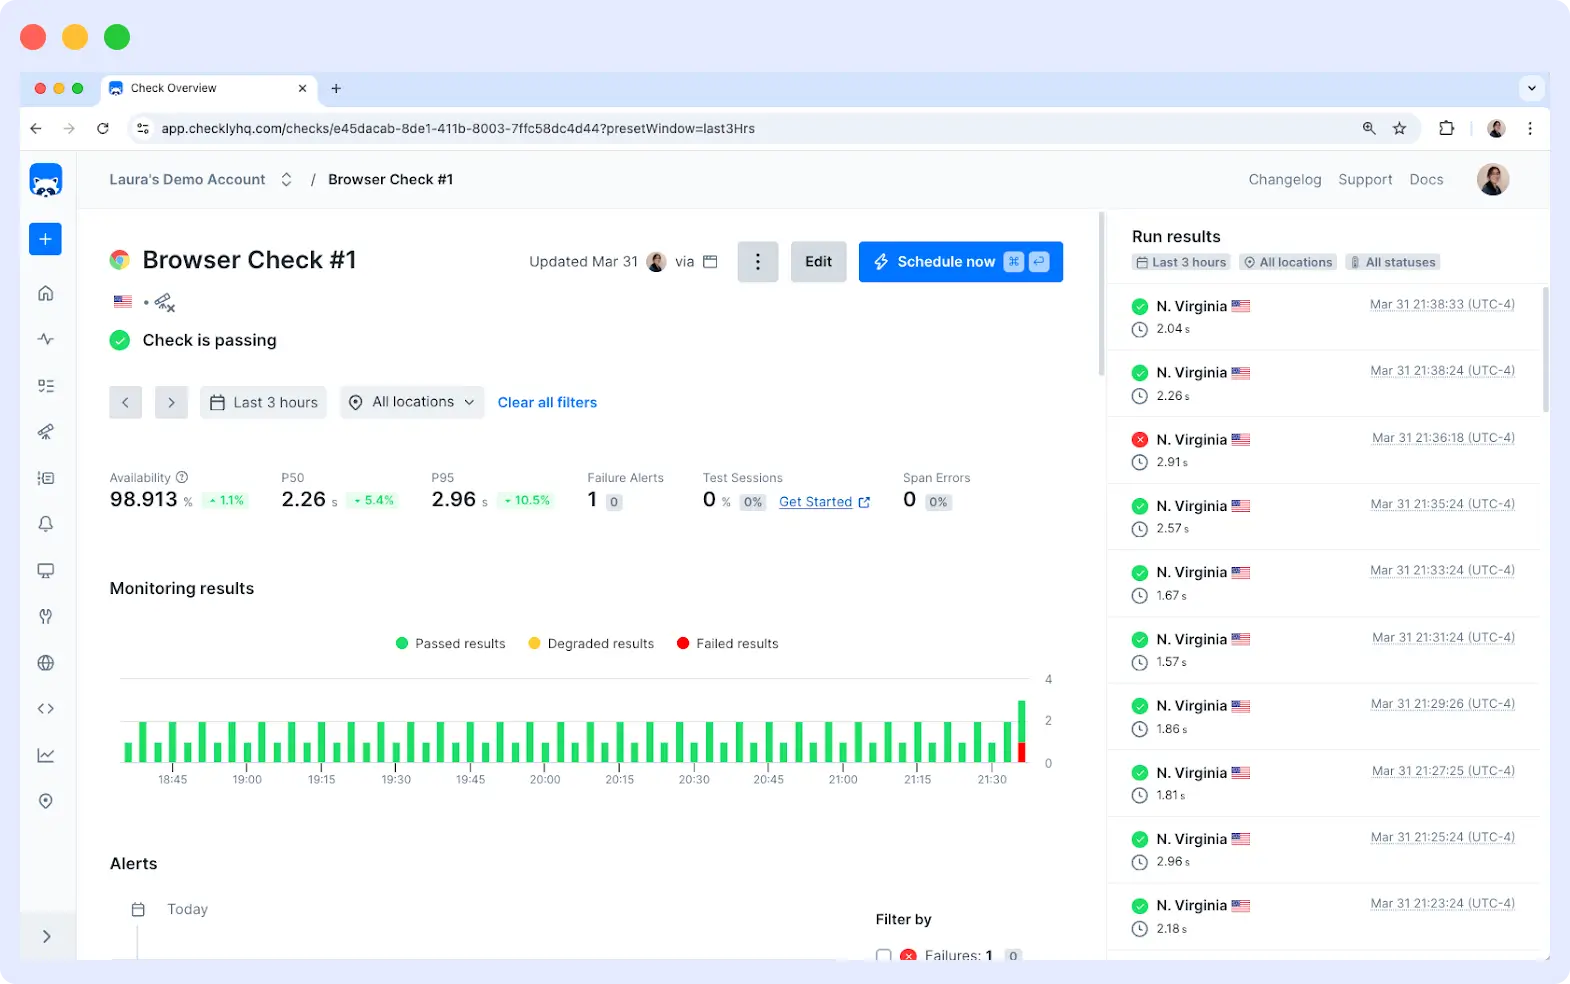
Checkly is an Application Reliability platform and a powerful Pingdom alternative built for engineering teams. Designed with API-first architecture and developer workflows in mind, Checkly focuses on monitoring APIs, websites, and web applications through code-based monitoring checks that integrate seamlessly with CI/CD pipelines and development processes.
Features:
- API monitoring with HTTP request testing and validation
- Browser checks using real Chromium browsers to test user journeys and web applications
- Playwright and Puppeteer-based synthetic monitoring with JavaScript/TypeScript support
- Multi-step transaction monitoring and user flow testing
- Monitoring as Code (MaC) with Git integration and version control
Pros:
- Built with developers in mind, offering seamless integration with development tools and workflows.
- Modern browser-based testing using real Chromium instances
- Strong CI/CD integration for continuous monitoring
Cons:
- Steeper learning curve for non-technical users due to code-based approach
- Primarily focused on API and browser monitoring, with limited uptime monitoring
Pricing:
- Hobby: Free plan suitable for small projects
- Team plan starts at $80/month
- Enterprise plan with custom pricing
6. Dotcom-monitor
Dotcom-Monitor is a monitoring platform that tracks website, application, API, and network performance in real time. It simulates real user interactions using actual browsers and supports uptime checks, API tests, and multi-step transaction monitoring from global locations.
Features:
- Simulate user interactions using real desktop and mobile browsers (Chrome, Firefox, Internet Explorer) to monitor website functionality and performance
- Create scripts to replicate complex user workflows like login, shopping carts, and payment processes
- Run performance checks from multiple global locations to detect region-specific issues
- Use private agents to monitor internal services securely within your network and stay compliant with data regulations
Pros:
- Offers a wide range of monitoring solutions, including web applications, APIs, DNS, and network infrastructure.
- Customizable alerts with multiple notification channels and integration options.
- Uses actual browsers to simulate user interactions, providing accurate performance data.
Cons:
- Pricing depends on monitoring type, check frequency, and task volume
- Advanced features and scripting may require time to learn
Pricing:
- Websites and APIs start at $19.99 per month
- Internet Infrastructure starts at $40.00 per month
- Page Performance starts at $29.96 per month
- Web Applications start at $38.95 per month
7. Uptime.com
Uptime.com is a robust platform built to keep your websites, APIs, servers, and web apps running smoothly and reliably. With a full set of monitoring tools, it helps teams stay ahead of downtime and performance issues by delivering real-time insights and clear status updates.
Features:
- Website and API checks via HTTP(S), Ping, SSH, TCP, UDP, DNS, SMTP, POP3, and IMAP — with tests running every minute from 80+ global locations
- Synthetic monitoring that mimics actual user flows to detect issues before users do
- Real User Monitoring (RUM) to capture real-world performance data
- Customizable public or private status pages to keep teams and users informed during incidents
- Instant alerts via email, SMS, voice, or tools like Slack and Microsoft Teams
- In-depth analytics and reports to track uptime, SLAs, and overall site performance
Pros:
- Secure credential storage with built-in vault functionality
- Code-free synthetic monitoring to simulate and test user workflows
- Clean, user-friendly dashboard for easy navigation and management
Cons:
- Smaller number of global monitoring locations compared to other competitors
- Missing advanced features like full APM, in-depth transaction tracing, and extensive analytics
Pricing:
- Website Monitoring starts at $9/month for 10 basic checks
8. Better Stack
Better Stack is an all-in-one monitoring and incident management platform that helps you track website, API, server, and cron job performance. It offers real-time alerts, detailed status pages, log monitoring, and on-call scheduling, making it easier for teams to detect issues, respond quickly, and keep users informed.
Features:
- Uptime monitoring with 30-second check intervals
- SSL and domain expiration monitoring with timely alerts
- Heartbeat monitoring for cron jobs and scheduled tasks
- Real-time alerting via Slack, MS Teams, email, SMS, phone, and webhooks
- Incident management tools, including on-call schedules and alert escalations
- Centralized log management with structured logging and SQL-like queries
Pros:
- Combines uptime monitoring, incident management, and log monitoring in one platform
- Integrates with 100+ tools, including GitHub, Jira, and Slack.
- Customizable status pages for transparent communication with users.
Cons:
- Focuses on core monitoring but lacks advanced performance features like RUM and APM
- Not a full observability platform for in-depth analysis
Pricing:
- Free plan includes up to 10 monitors
- Pay-as-you-go plans start at $34/month
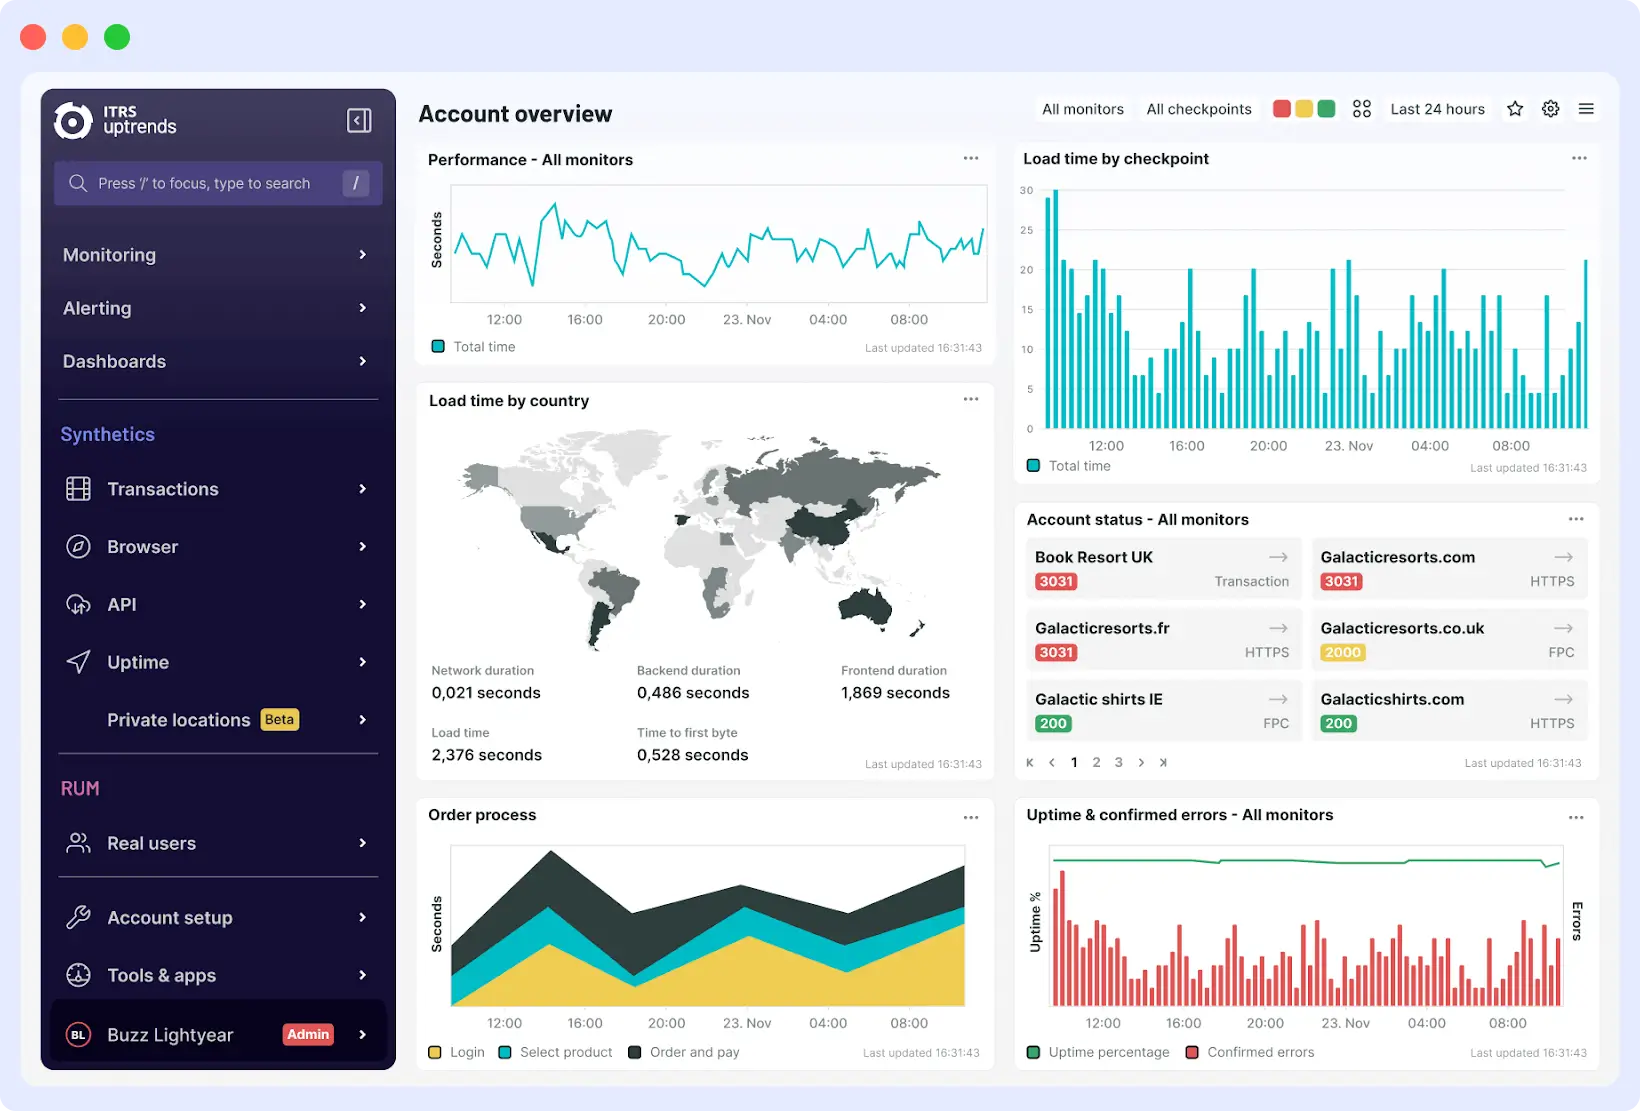
9. Uptrends
Uptrends is a comprehensive monitoring platform offering a range of tools to ensure the uptime and performance of websites, APIs, servers, and web applications. It provides both synthetic and real user monitoring from over 230 global checkpoints, enabling teams to detect issues promptly and maintain optimal user experiences.
Features:
- Website and API uptime monitoring with HTTP, HTTPS, FTP, TCP, UDP, SMTP, POP3, IMAP, and customizable check intervals
- Synthetic transaction monitoring to simulate user interactions
- Real User Monitoring (RUM) for insights into actual user experiences
- Web performance monitoring using real browsers like Chrome and Edge
- Multi-step API monitoring for complex workflows
- Alert management with multiple notification channels and advanced alerting rules and escalation policies
Pros:
- Reliable monitoring with advanced verification systems that minimize false alerts and alert fatigue
- Wide variety of monitoring types including websites, servers, APIs, mobile apps, and infrastructure components.
- Customizable dashboards with a flexible drag-and-drop interface.
Cons:
- Some users report a learning curve when configuring complex monitoring scenarios
- May be unnecessarily complex for organizations that only need basic uptime monitoring.
Pricing:
- Uptime and Availability Monitoring starts at $5.10 per credit/month
- Multi-step API Monitoring starts at $7.96 per credit/month
- Synthetic Transaction Monitoring starts at $8.17 per credit/month
- Real User Monitoring (RUM) starts at $8.91 per month
- Browser Monitoring starts at $13.68 per credit/month
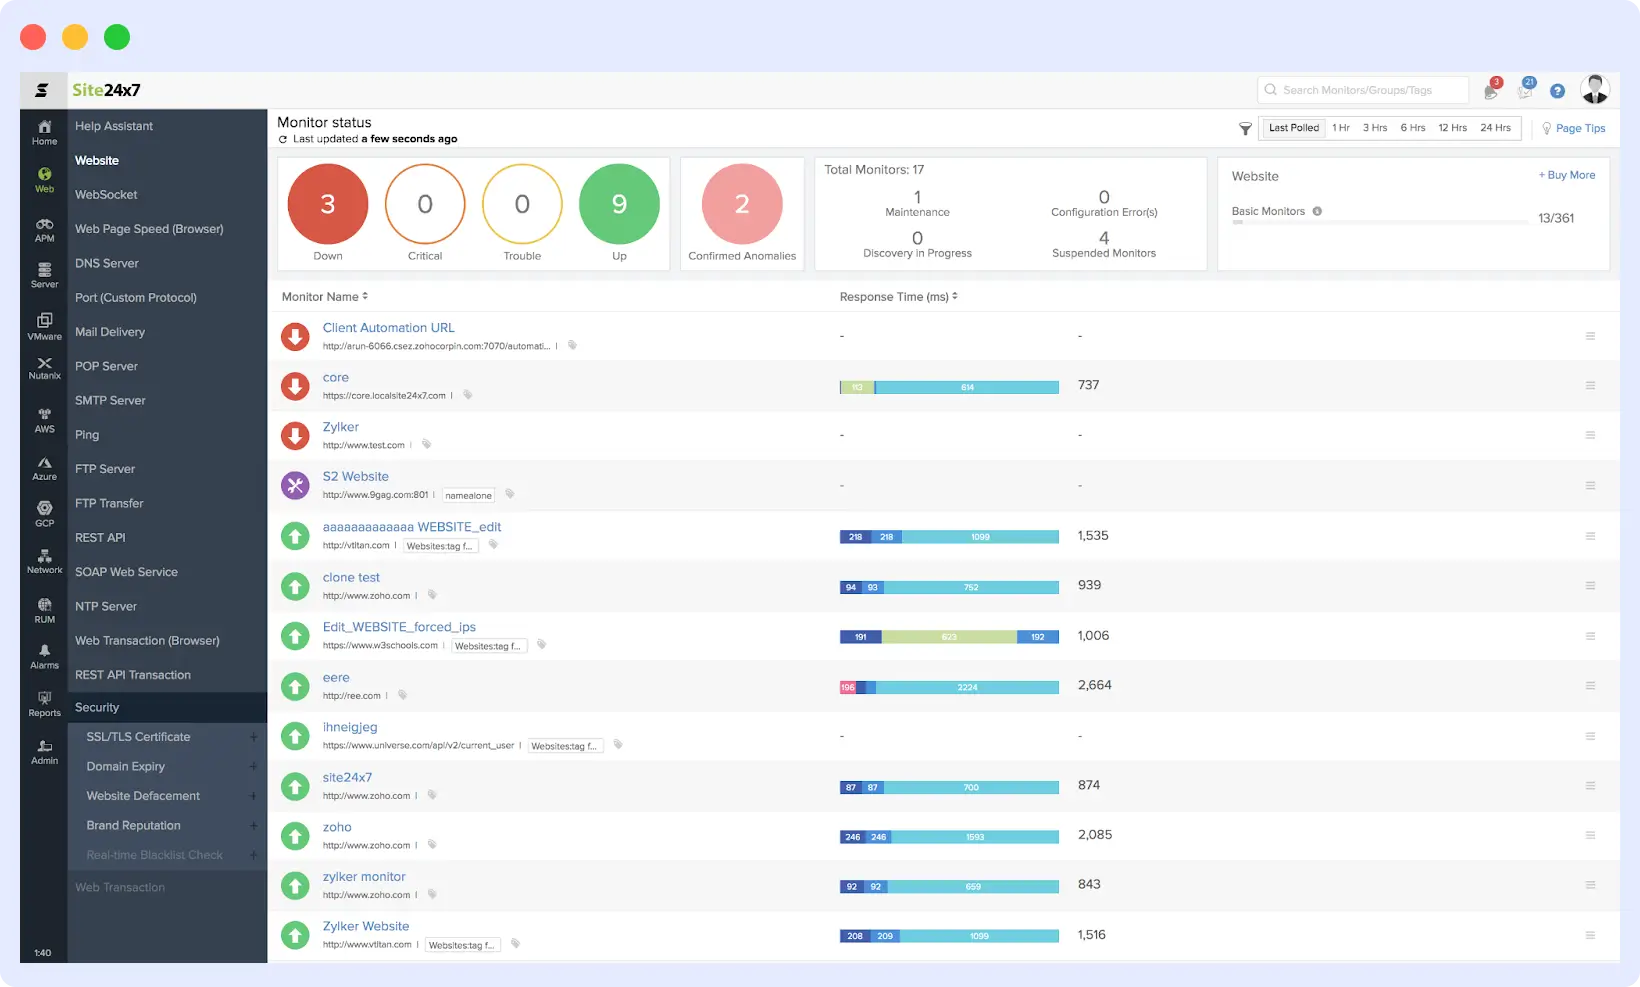
10. Site 24×7
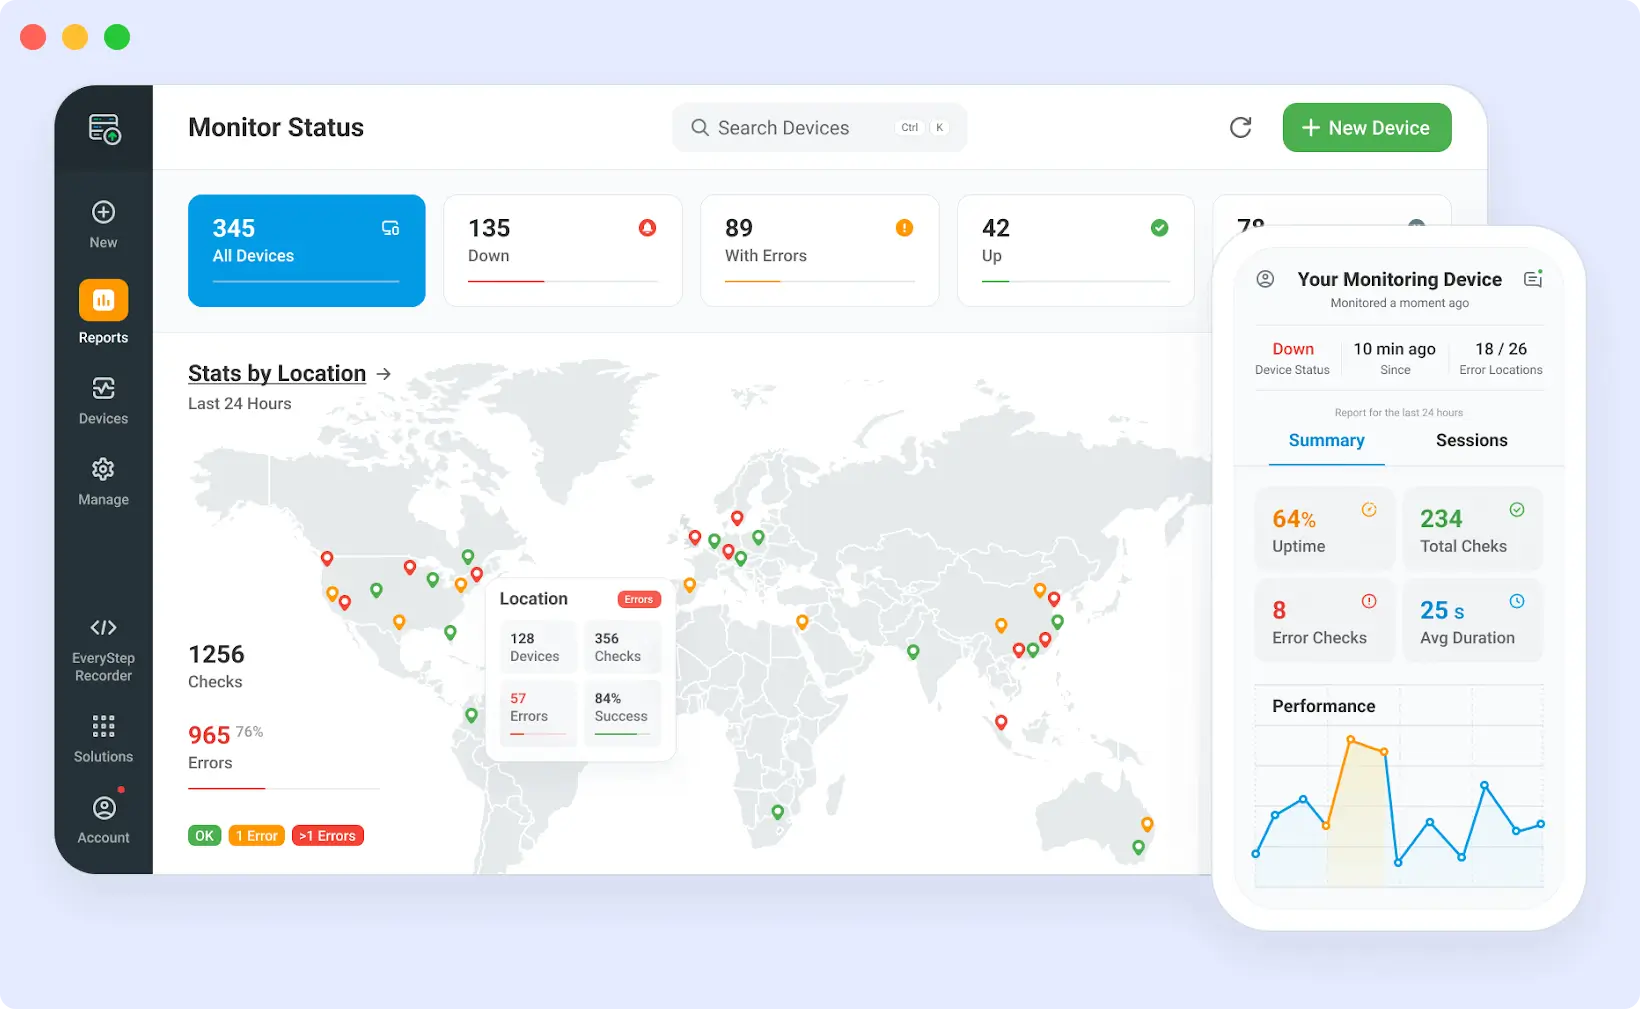
Site24x7 is an all-in-one monitoring platform that tracks website uptime, server performance, application health, and cloud infrastructure. It supports HTTP(s), TCP, ICMP, and DNS monitoring, along with synthetic and real user monitoring. Site24x7 also offers detailed analytics and AI-powered root cause analysis to quickly identify issues.
Features:
- Uptime monitoring with support for HTTP(s), TCP, ICMP, DNS, FTP, SMTP, POP, and IMAP.
- Synthetic monitoring for simulating multi-step user journeys using real browsers
- Real user monitoring (RUM) to track actual user experiences across devices, browsers, and regions
- Application performance monitoring for Java, .NET, PHP, Ruby, and Node.js apps
- Server monitoring for CPU, memory, disk, and network usage across physical and virtual servers
- Network monitoring for routers, switches, and other devices using SNMP and flow protocols
Pros:
- Global reach with 130+ monitoring locations
- AI-powered alerts for anomaly detection and root cause analysis
- Comprehensive monitoring solution that covers websites, servers, applications, networks, and cloud infrastructure in one platform.
Cons:
- May be overkill for organizations that only need basic website uptime monitoring.
- The extensive feature set requires significant time and expertise to configure properly, making it overwhelming for smaller teams.
Pricing:
(Web Monitoring Plans only)
- Web Uptime Plan starts at $8/month (billed annually)
- Pro Plan starts at $35/month(billed annually)
- Classic Plan starts at $89/month (billed annually)
- Enterprise Plan starts at $225/month(billed annually)
What to Look for in a Pingdom Alternative
Not all the monitoring tools are the same. If you are considering a switch from Pingdom, it’s important to compare tools based on your specific requirements and not just by features or pricing. Here are some of the core capabilities to pay attention to as you look for an alternative:
- Uptime Monitoring: Basic checks through HTTP/HTTPS requests, Ping checks, or TCP protocols to detect outages or slow responses.
- Monitoring Locations around the globe: This lets you test from different geographic regions to detect region-specific issues. The broader coverage gives you better views and greater uptime information, especially when your users are scattered across different regions.
- Scripted User Flows: Simulated user steps duplicating significant activities like logins, searches, or checkout. These simulate human-like steps and catch issues that basic uptime checks may possibly miss.
- Real User Monitoring (RUM): It collects information about real users to show the performance of your site in the real world on different devices, browsers, and types of connections. It finds the performance slowdowns and errors impacting the user experience.
- Application Performance Monitoring (APM): Monitor backend metrics like server response time, database queries, API latency, and code performance to detect and fix issues in your app stack.
- Alerts and Notifications: Offers customizable alerting via email, SMS, Slack, or services like PagerDuty. Alert grouping, suppression, escalation policies, and shift schedules for on-call shift workers help to reduce noise and maximize response.
- Integration ecosystem: Look for tools that integrate well with the tools you already have on your stack, including incident management tools, CI/CD tools, chat software, and issue trackers. This lets you work easily and stay productive.
- Scalable Pricing: Choose a service whose pricing fits your near-term needs and increases with you. You shouldn’t be forced into pricey plans until you’re prepared.
Conclusion
This post has highlighted 10 strong Pingdom alternatives, each offering a unique mix of features across uptime monitoring, real user insights, synthetic testing, and performance tracking. While Pingdom is a good monitoring tool, many teams eventually need more flexibility, deeper visibility, or better pricing options.
Middleware provides full-stack observability, deeper insights, and greater flexibility for growing teams. If you’re looking to upgrade your monitoring setup with powerful, easy-to-use features, Middleware is a strong choice worth exploring. Try it out now.