Open-source monitoring tools like Prometheus excel at real-time data collection and querying, making them a top choice for monitoring. However, It’s limitations push organizations to seek Prometheus monitoring alternatives.
This blog examines the top monitoring solutions that offer enhanced scalability, long-term storage, and improved observability.
When do you need Prometheus alternatives?
Prometheus has several challenges that often push organizations to look for better alternatives to Prometheus, let’s look at the parameters one by one:
- Storage limit: The system comes with storage constraints that restrict it from storing data for a period of up to weeks before users need external solutions for long-term storage.
- Scalability issue: Prometheus faces scalability challenges during large-scale data ingestion because the built-in system needs additional storage solutions such as Thanos or Cortex.
- Difficult management: Organizations find it difficult to manage complex configurations that involve multiple instances and federations, as well as HA setups.
- Integration requirement: The technical solution suffers from a lack of integrated log and trace functionality because users must establish connections between Prometheus and other platform tools like Grafana.
- Limited multi-cloud flexibility: Prometheus was primarily designed for single-cluster monitoring, making it less adaptable for organizations running workloads across multiple cloud providers.
- No AI-powered Analytics: The Evaluation Requires More AI Capabilities Because Prometheus cannot offer the Analytics or Anomaly Detection Needed.
One of the leading food aggregator platforms, Zomato, experienced problems with Prometheus and Thanos that led to expensive costs, together with poor query times and repeated memory breaks.
To overcome these limitations, they migrated to alternatives to Prometheus, a more scalable and cost-effective monitoring solution, improving query times, reducing infrastructure overhead, and enhancing system reliability. The system transition brought higher observability measures along with better system reliability to their operations.
Monitoring systems, along with metrics and observability tools, must provide auto-scaling, data visualization, and user interfaces that simplify performance analysis and troubleshooting. These features ensure that teams can monitor infrastructure, detect issues, and optimize system performance.
Best Alternatives to Prometheus
Prometheus has limitations in scalability and long-term storage, prompting users to explore better Prometheus alternatives. Below is a comparison of the top 6 Prometheus alternatives, their benefits, and where they excel.
1. Middleware
Middleware is a modern observability platform that provides real-time insights into metrics, logs, and traces. It simplifies monitoring for cloud-native applications and Kubernetes clusters with automatic service discovery, AI-powered anomaly detection, and integrated dashboards for easy analysis.
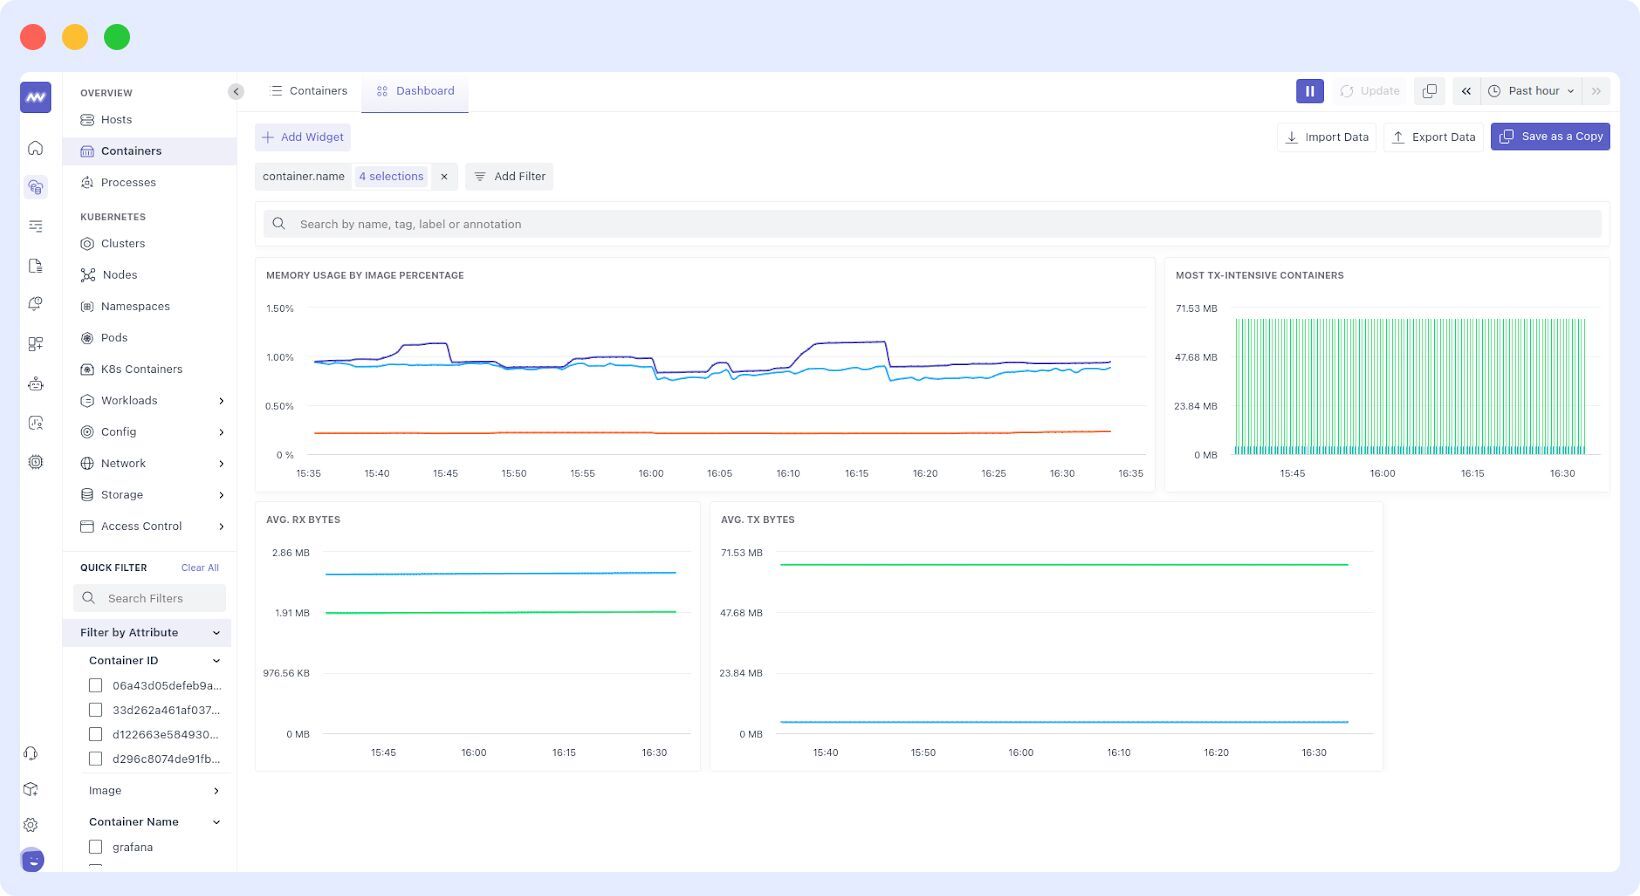
Why it stands out:
- Real-time monitoring: The system provides real-time monitoring with quick metrics collection times that generate real-time performance insights about system behavior.
- Automatic service discovery: The system performs automatic service discovery and follows real-time resource tracking of Kubernetes deployments, which makes observability simpler to understand.
- AI-based anomaly detection: AI-powered Anomaly Detection combines machine learning analysis of trends with irregularity detection abilities that protect system operations from potential failures.
The gaming organization, Generation Esports, moved to Datadog alternative because it generated unreliable alerts while costing too much money. Instead, it chose Middleware for enhanced observability along with real-time insights.
The deployment of Middleware resulted in a 75% reduction in monitoring expenses, a 75% decrease in manual handling operations, and a 50% shorter response time to troubleshoot system issues.
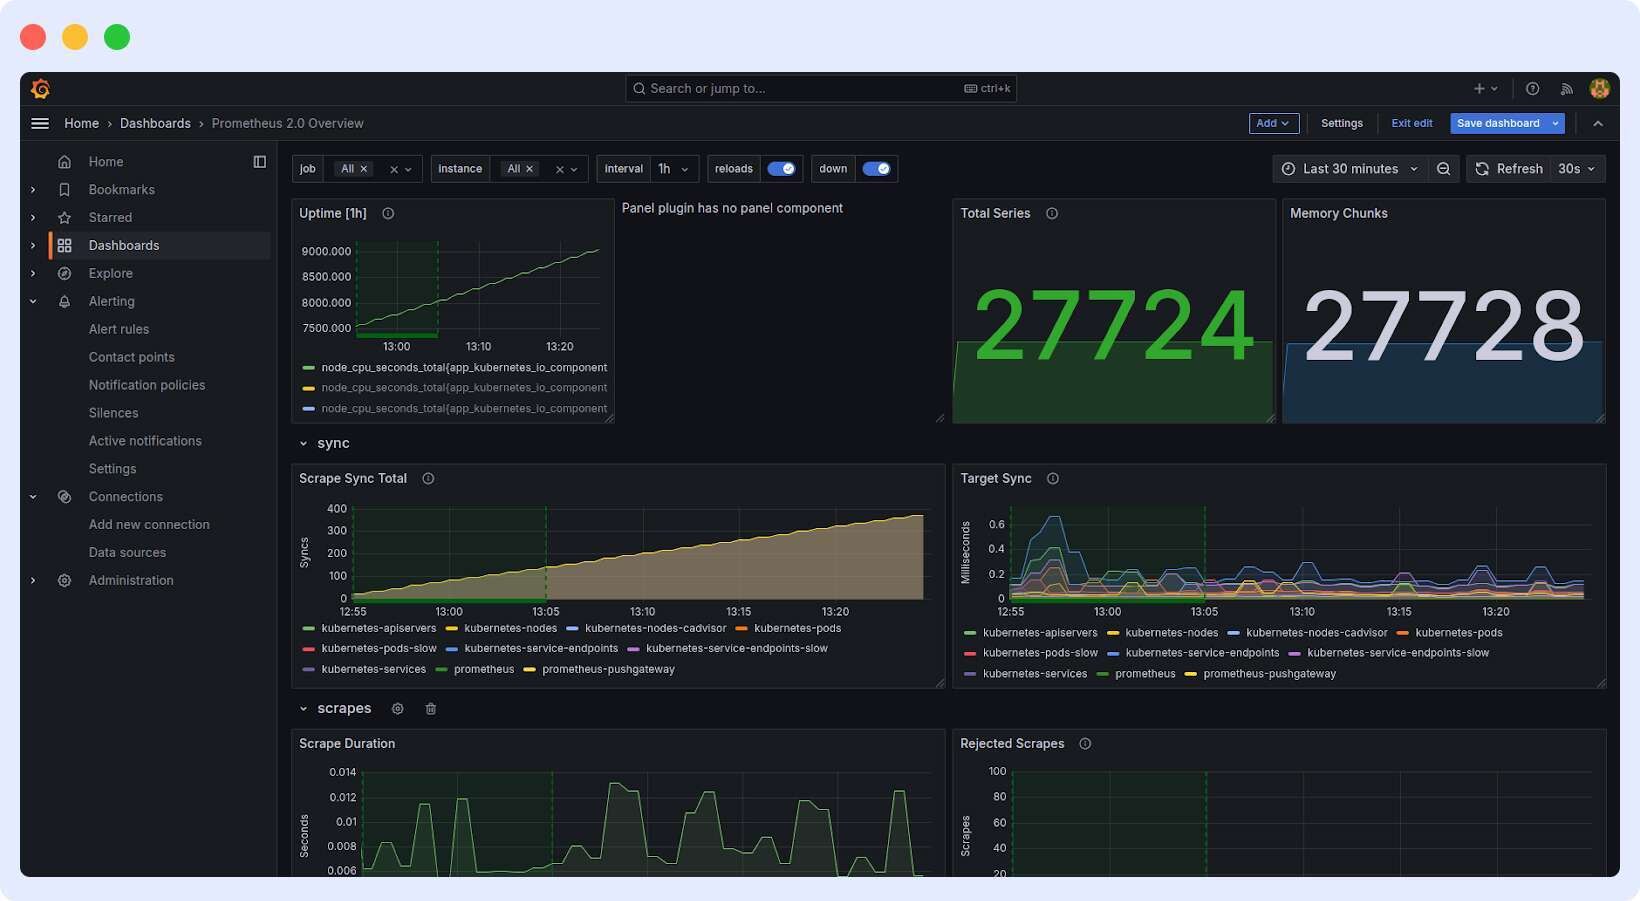
2. Grafana Loki
The log aggregation system Grafana Loki functions to gather and query logs for analysis effectively. Through its association with Grafana, the system facilitates users in monitoring their systems with complete data correlation between logs and metrics.
Loki provides better operational effectiveness through metadata indexing as an alternative to traditional log management systems, which handle entire text content. This methodology delivers enhanced cost-effectiveness and scalability.
Why it stands out:
- Cost efficiency: Loki achieves cost efficiency in log management because it processes metadata instead of entire log files.
- Integrated with Grafana: Loki provides users with a single Grafana platform that lets them combine log visualization with a metric overview for superior monitoring capabilities.
- Highly Scalable: The system maintains superior functionality as it processes extensive quantities of log data while avoiding diminished operational speed.
Large log data volumes do not degrade system performance because of the way the system operates at high-performance levels. The worldwide customer relationship management vendor, Salesforce, operates its systems by processing 70 million metrics each minute.
Salesforce employed Grafana as its solution to monitor and visualize large data volumes. The added integration between systems allowed them to process 120,000 alerts per minute, resulting in a 66% improvement in infrastructure monitoring time.
By customizing dashboard displays and connecting efficiently with current operational systems, Salesforce achieved top performance standards throughout its service delivery.
3. InfluxDB
InfluxDB is one of the time-series database alternatives to Prometheus optimized for storing and querying time-stamped data, such as metrics and events. It’s designed to handle high write and query loads, making it suitable for real-time analytics and monitoring applications.
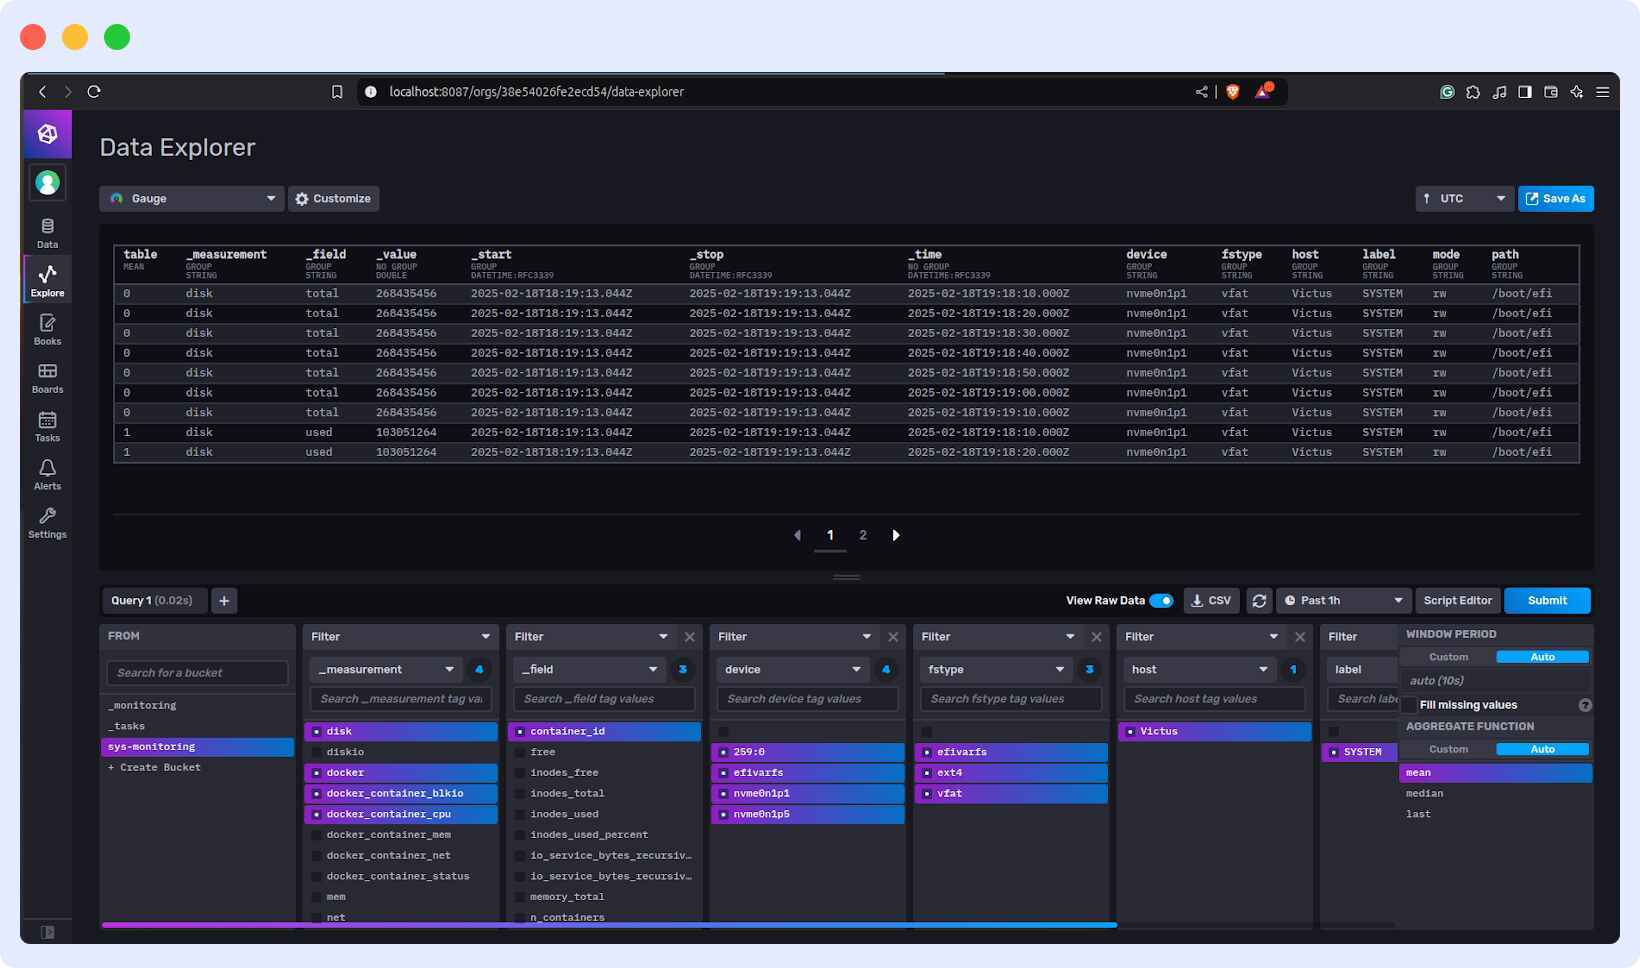
Why it stands out:
- Time-series optimization: Specializes in efficiently handling large volumes of time-stamped data.
- High performance: Offers rapid read and write capabilities, essential for real-time monitoring.
- Scalability: Supports horizontal scaling to accommodate growing data needs.
For example, NGINX, renowned for its high-performance web server and reverse proxy capabilities, generates substantial monitoring data daily. To efficiently store and analyze this monitoring data, some users leverage sharded PostgreSQL setups.
However, for improved performance and scalability, many are considering transitioning to TimescaleDB, a time-series database extension for PostgreSQL. This shift enhances data ingestion and query performance, ensuring more efficient monitoring of large-scale infrastructure.
4. Datadog
A cloud-based monitoring solution such as Datadog delivers complete observability into infrastructure and applications together with logs through its monitoring and analytics platform. The platform delivers a single solution to monitor flexible cloud systems while it helps development teams unite with operations teams and business departments.
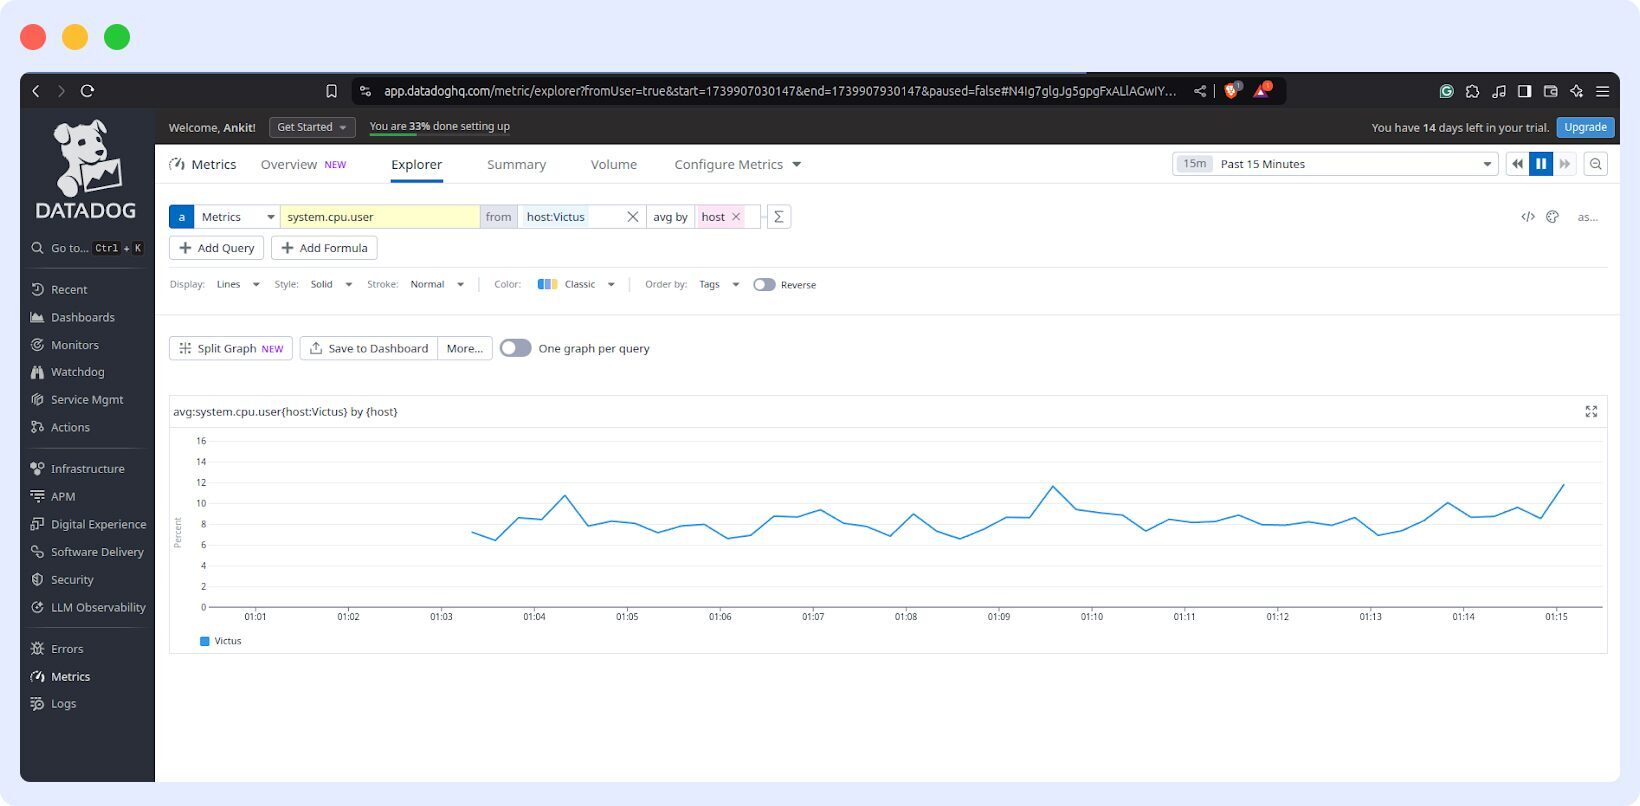
Why it stands out:
- Complete solution: Integrates infrastructure monitoring, application performance monitoring (APM), and log management into a single platform.
- Real-time monitoring: Delivers immediate insights with real-time data processing and visualization.
- Large integration library: The platform integrates with a broad selection of technological components and services to make its adoption possible in numerous environments.
Neto faced monitoring problems with their original setup since it needed hand adjustments yet failed to adapt properly to their dynamic cloud platform. To address these issues, Neto adopted Datadog during their migration to AWS.
This integration provided real-time insights into both their legacy and new cloud infrastructures, ensuring a seamless transition. As a result, Neto improved platform reliability and maintained business continuity throughout the migration process.
5. New Relic
The cloud-hosted observability solution from New Relic allows users to discover data about their log infrastructure along with their applications at every phase. Performance monitoring runs in real-time using distributed tracing together with anomaly detection thanks to AI-powered insights delivered through the platform.
The system provides interactive dashboards combined with automatic instrumented features, allowing developers to gain comprehensive visibility to detect application problems before reaching end users.
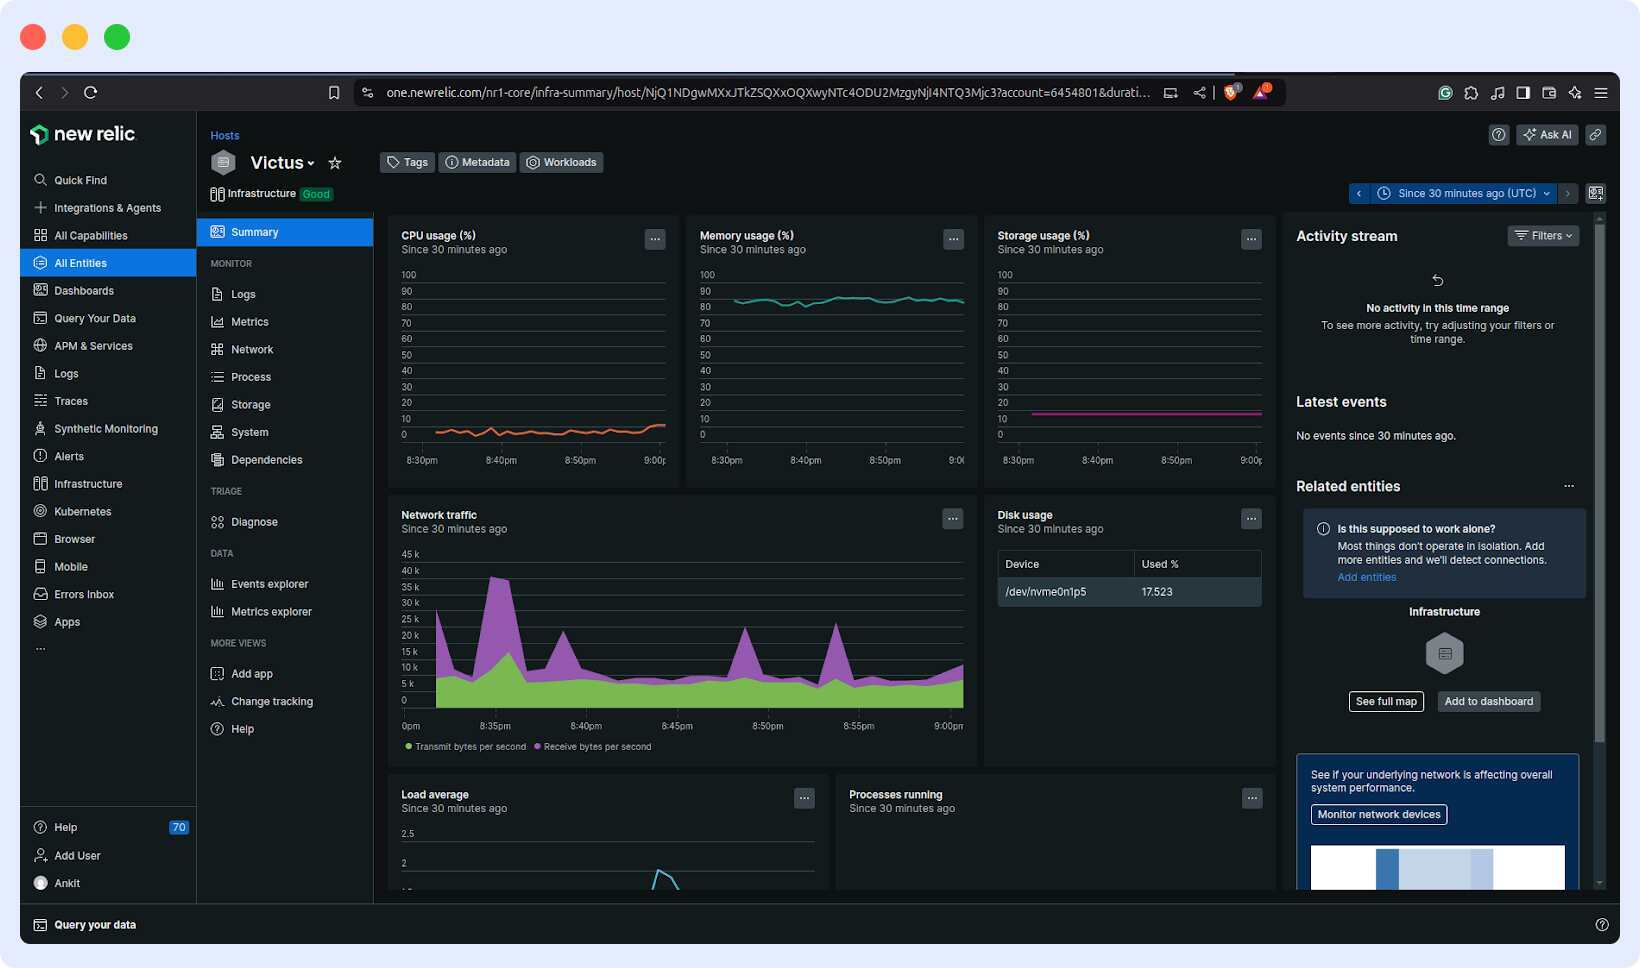
Why it stands out:
- Application Performance Focus: Specializes in detailed APM with real-user and synthetic monitoring.
- User-Friendly Interface: Provides intuitive dashboards and analytics tools for easy navigation and data interpretation.
- Holistic Insights: Combines performance metrics with user experience data for comprehensive analysis.
The global media company Forbes invested in an improvement of their digital performance to boost their brand through New Relic observability platform integration. Through New Relic’s observability platform, Forbes obtained real-time visibility to monitor their applications and infrastructure.
Forbes achieved these three benefits through the deployment of their platform while using New Relic’s observability platform to monitor digital platforms’ performance and improve the user experience.
6. Elastic Stack (ELK Stack)
The Elastic Stack, also known as the ELK Stack, is an open-source log analytics and management system. The Elastic Stack includes Elasticsearch for data search operations, Logstash for processing and transformation functions alongside Kibana for data display features.
The Elastic Stack serves as the main data collection and analysis solution for numerous organizations to process information from distributed systems.
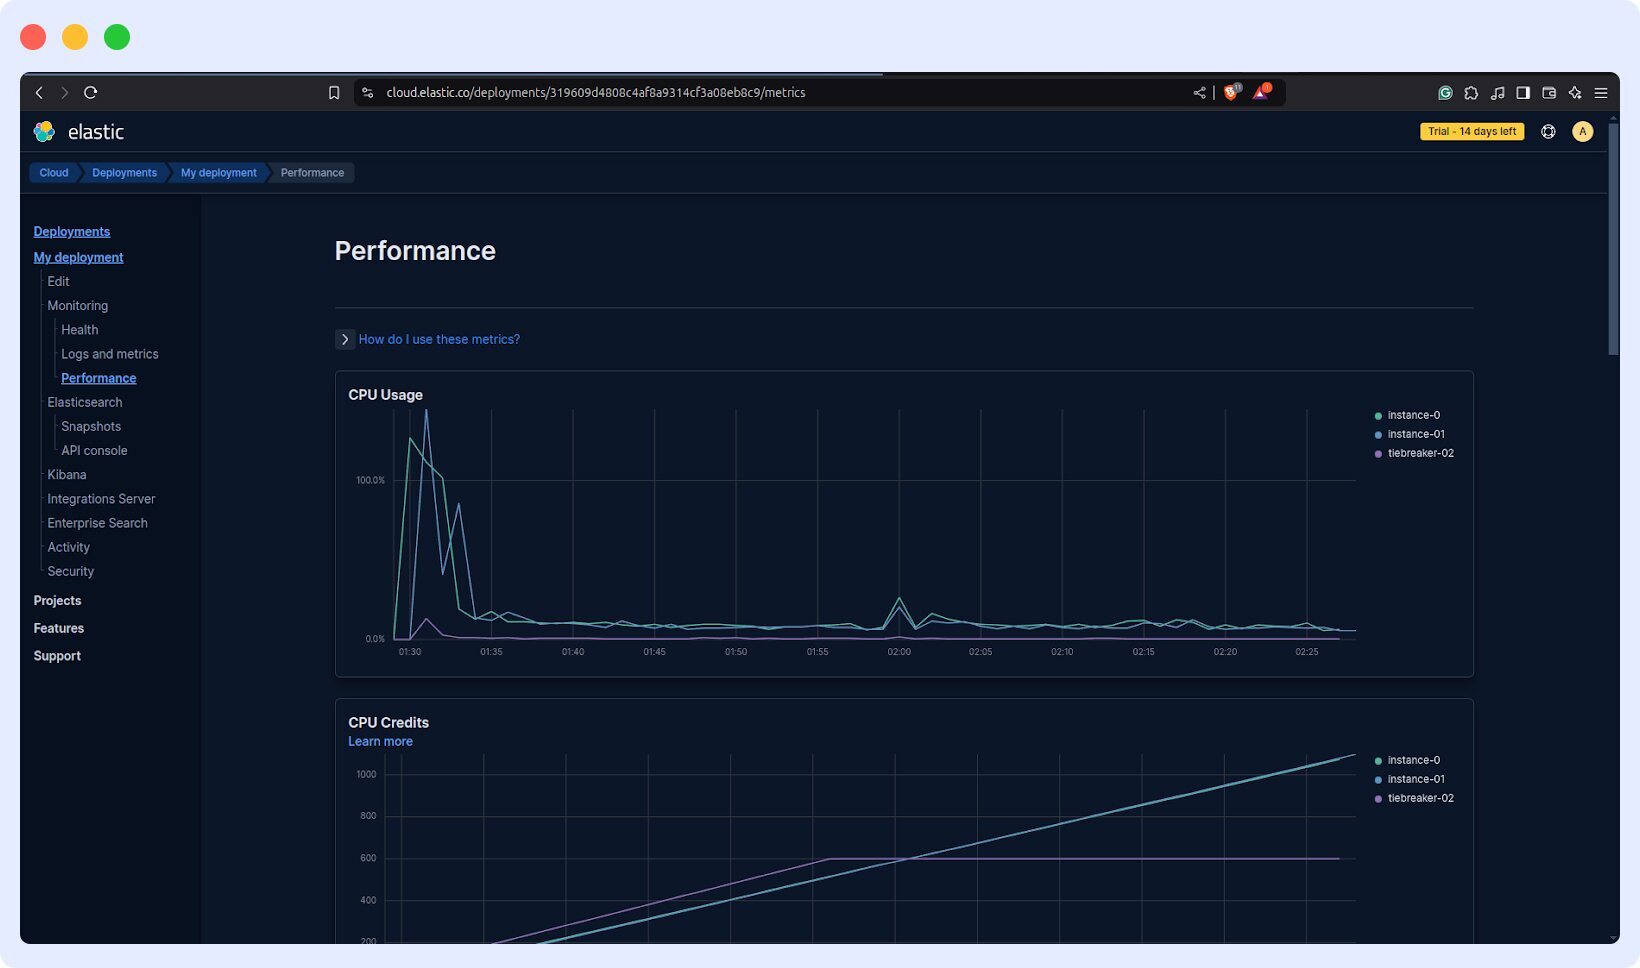
Why it stands out:
- Open-Source and Scalable: Scalable monitoring platforms such as ELK stack operate as an open-source monitoring solution that delivers horizontal scalability for log management of large-scale distributed systems.
- Advanced Search and Real-Time Analytics: The Elasticsearch platform delivers accurate full-text searches and advanced search features together with real-time analytics to help users detect anomalies and perform log correlations using machine learning, which makes monitoring more efficient.
- Comprehensive Data Processing with Logstash: Logstash optimizes ETL operations because it supports complete data processing functions that gather data from various sources to transform and enhance the information before creating indexes.
The implementation of Elastic Stack by KPN protected both its business systems and its customer property. The entity operates as one of the top telecommunications service providers. The implementation of Elastic Stack by KPN resulted in the development of an advanced security information and event management system.
KPN attained expedited incident detection through real-time security monitoring during the deployment, which resulted in better cybersecurity defense capabilities for the company.
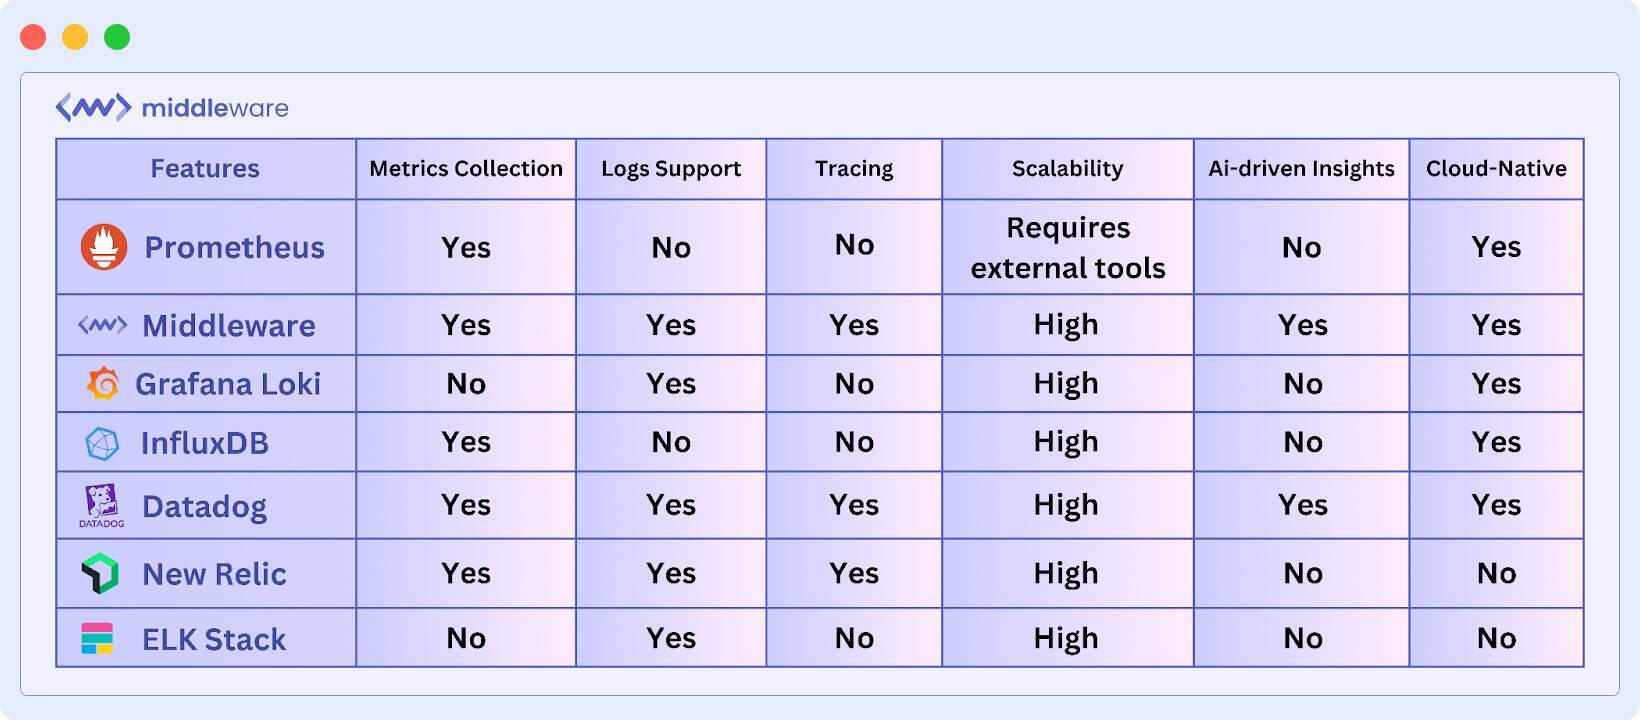
Prometheus vs. other monitoring tools
Choosing the right Prometheus alternatives monitoring tool requires a comparison of its features. While it excels in metrics collection, Prometheus alternatives offer built-in log management, AI-driven insights, and better scalability.
The table below outlines key differences to help organizations select the best fit for their infrastructure and performance needs.
Choosing the Right Monitoring Solution
Now that we have understood the different Prometheus alternatives platforms, let’s look at the key determinants that you need to keep in mind when selecting a monitoring solution.
- Deployment method: System deployment follows two data models, with Middleware, Datadog, and New Relic serving cloud-based deployments but Prometheus and ELK allow self-hosted control of systems.
- Scalability: Scalability is a key factor in monitoring solutions, allowing businesses to handle intensive workloads efficiently. Platforms like Middleware, InfluxDB, and New Relic offer scalable architectures that support medium and large-scale deployments.
- Complete solution: The complete stack provided by Middleware and Datadog enables in-depth monitoring through a combined presence of metrics, logs, and traces.
- Open-source: Due to their open-source nature, Prometheus and ELK give organizations budget-friendly monitoring capabilities that do not require vendor dependency.
- Flexibility: ELK enables users to customize their platforms using scripts, plugins, and integrations to adapt monitoring solutions to specific needs.
The selection of a monitoring tool happens based on how complex an organization’s infrastructure is, alongside its performance requirements and financial situation.
The evaluation process will help organizations select monitoring platforms that provide stability together with secure and efficient operation for contemporary cloud-based and on-premises deployments.
Conclusion
While Prometheus comes with powerful features, it lacks the necessary capabilities for users who require extensive scalability and improved storage abilities combined with analytic functions.
Middleware offers an AI-powered observability platform that matches features similar to those of the integrated Datadog solution in the cloud at a lower cost. The market receives effective monitoring solutions through the self-hosted tools InfluxDB and ELK Stack. A business must find the appropriate monitoring solution based on its operational requirements and system complexity, as well as its scalability needs.
A CEO from MindOrigin highlighted the difference Middleware made:
“We chose Middleware because it provides a robust observability platform that combines advanced monitoring, logging, and tracing features at a significantly lower cost compared to competitors like Datadog. Its cost-effectiveness, coupled with its scalability and ease of integration, made it the ideal choice for our infrastructure monitoring needs.”
Krishna Charan BS, Information Security Head, MindOrigin
Prometheus alternatives evaluation process lets organizations construct superior Kubernetes monitoring systems with efficient observability and proactive system management functionality.
FAQ
When not to use Prometheus?
Avoid using Prometheus in these cases:
- Long-term storage – Requires external tools like Thanos or Cortex for data retention beyond a few weeks.
- High-cardinality metrics – Struggles with large-scale unique labels, leading to high memory usage.
- Multi-region monitoring – Needs extra setup for centralized monitoring across multiple regions.
- Security & multi-tenancy – Lacks built-in authentication, RBAC, and native multi-tenancy.
- AI-powered analytics – Relies on rule-based alerts without predictive monitoring.
For scalable, AI-driven observability, consider Middleware, Datadog, or New Relic.
What is the difference between InfluxDB and Prometheus?
InfluxDB is a time-series database designed for high-volume metric storage, IoT data, and event logging, using a push-based model for data ingestion. It supports long-term storage, high-cardinality data, and advanced queries with InfluxQL and Flux.
Prometheus is a monitoring and alerting system optimized for real-time observability in cloud-native environments like Kubernetes. It follows a pull-based model, is best for short-term metric storage, and uses PromQL for queries.
What is the difference between Prometheus and Grafana?
Prometheus is a monitoring and alerting system designed for collecting, processing, and storing metrics from applications and infrastructure. It follows a pull-based model, scrapes metrics from targets, and uses PromQL for querying data. It is optimized for real-time monitoring and anomaly detection.
Grafana is a visualization and analytics platform that works with Prometheus to display collected metrics in customizable dashboards. It helps interpret data through interactive graphs, alerts, and reports, making monitoring more intuitive. They complement each other rather than compete.
Learn more in this detailed comparison: Prometheus vs. Grafana.
Can Prometheus be used alongside other monitoring tools?
Yes, Prometheus can integrate with other monitoring solutions to enhance observability. Many organizations use Grafana to visualize Prometheus metrics, while Loki or ELK Stack handles logs.
Some also pair Prometheus with cloud-based APM tools like Middleware or Datadog for AI-driven insights, anomaly detection, and multi-cloud monitoring, ensuring a more comprehensive observability stack.
How do Prometheus alternatives improve alerting and incident response?
Prometheus relies on rule-based alerting, which can be challenging to scale and may generate false positives. Prometheus platform alternatives like Middleware and New Relic offer AI-powered anomaly detection to reduce noise and detect real issues.
Additionally, Datadog and ELK Stack integrate with automated incident response tools, enabling teams to prioritize and resolve issues faster.