
A cloud-native system needs constant monitoring to maintain performance and reliability. Prometheus acts as a smart sensor network, collecting real-time metrics such as CPU usage, memory utilization, and network performance across your infrastructure. Grafana, on the other hand, transforms these metrics into interactive, visual dashboards, enabling DevOps teams to quickly understand system health and trends.
In this article, we’ll break down the differences between Prometheus and Grafana, explain their architecture, provide step-by-step integration guidance, highlight scaling strategies, and share best practices for using them in Kubernetes and cloud-native environments. By the end, you’ll know exactly which tool or combination fits your monitoring strategy.
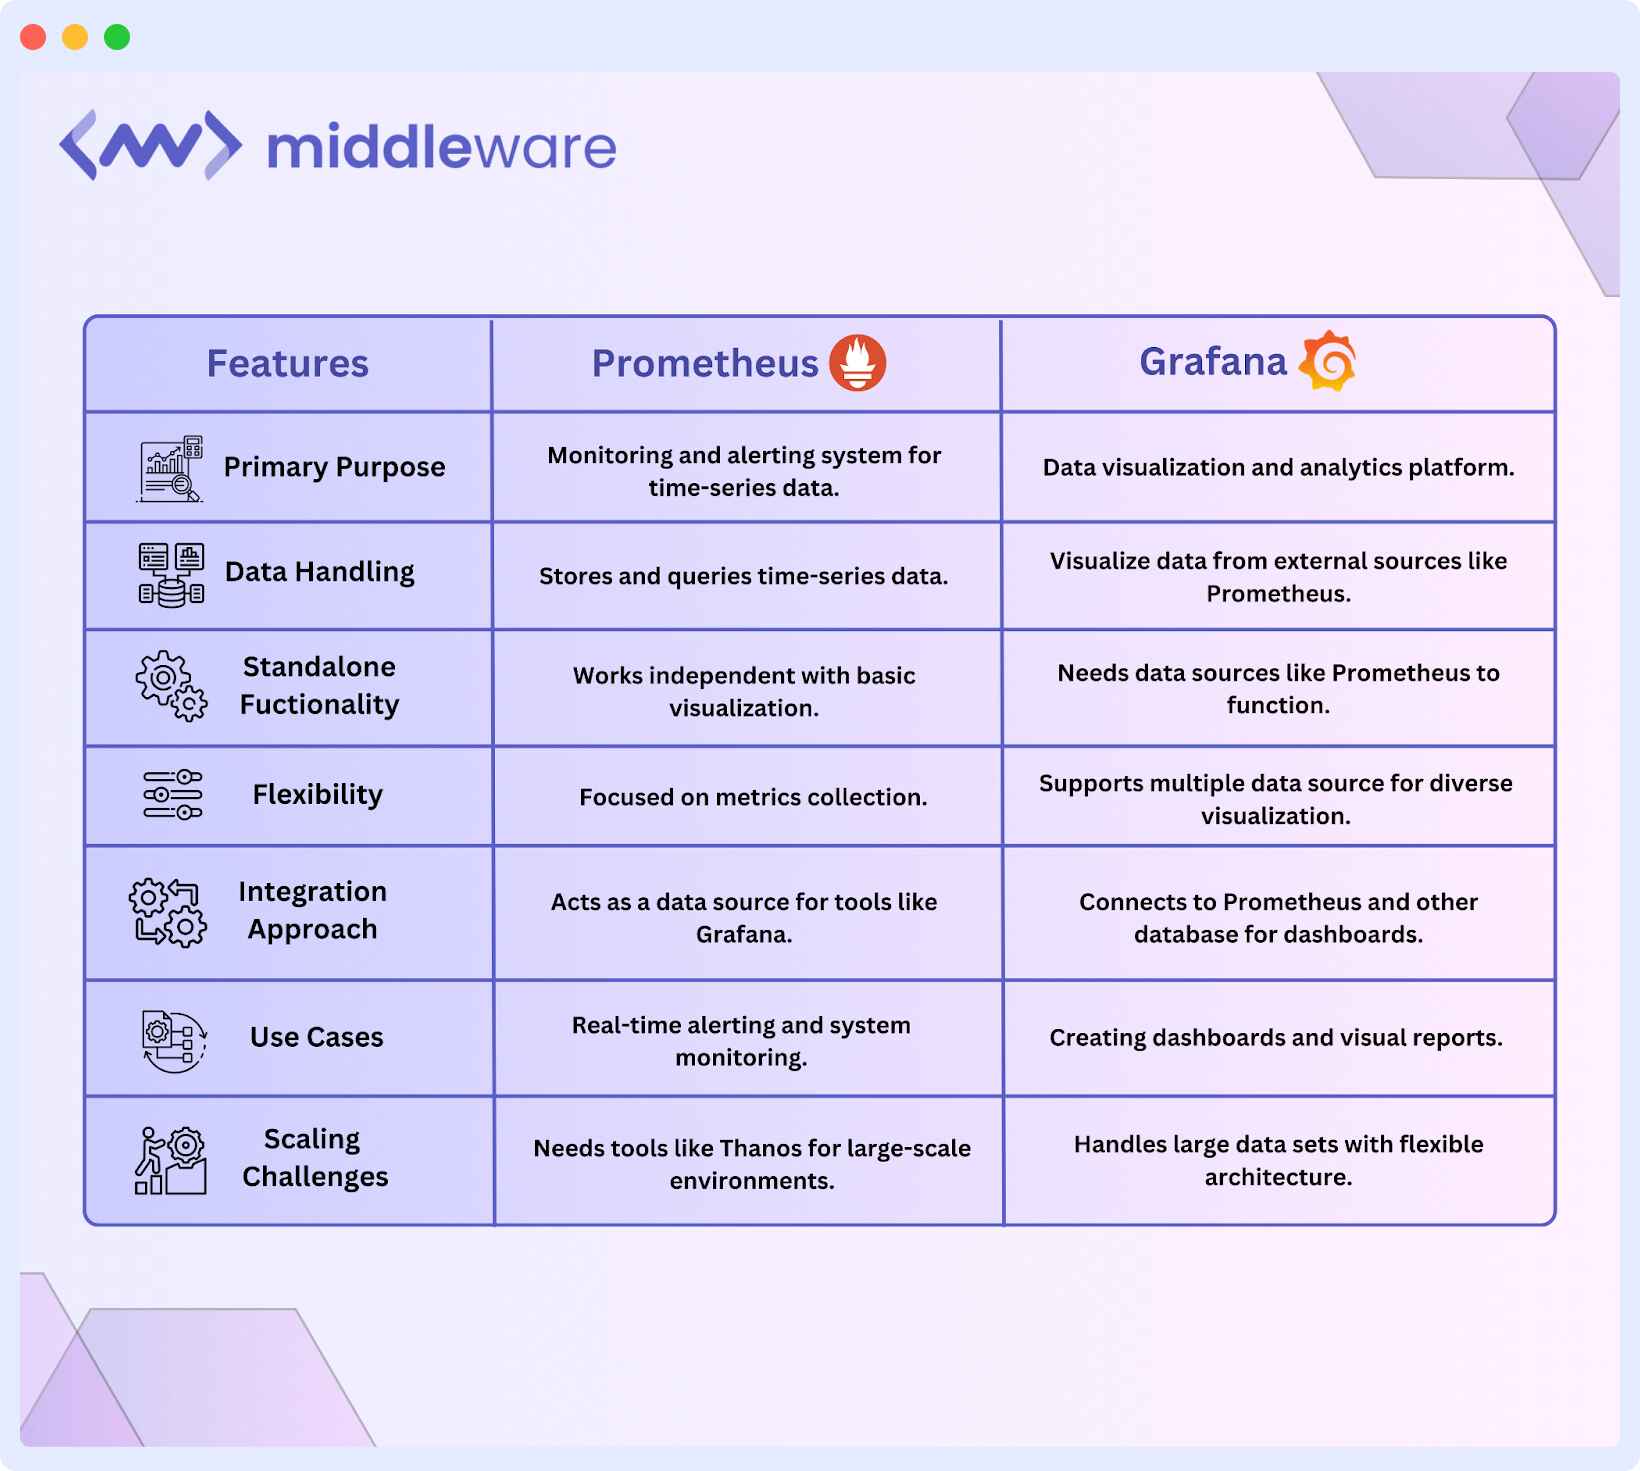
Prometheus vs Grafana: Key Differences
Prometheus monitors your servers like a sensor system, tracking metrics such as CPU, memory, and network activity. For example, a SaaS platform can use it to alert you when response times slow down.
While Prometheus and Grafana are often mentioned together, their architectures differ fundamentally. Prometheus uses a pull-based model to scrape metrics from exporters and stores them in its time-series database (TSDB). Grafana, in contrast, does not store metrics; it queries data sources such as Prometheus, Loki, MySQL, or Elasticsearch and visualizes the results in dashboards.
✅ How to use Middleware with Prometheus. Turn Prometheus data into actionable insights with dashboards, alerts, and full observability in one place.
Grafana, on the other hand, turns this raw data into clear, visual dashboards, much like a weather app that shows temperature trends.
For example, in a Kubernetes environment, Prometheus scrapes metrics from nodes and pods via cAdvisor and kube-state-metrics, storing them for analysis. Grafana then retrieves these metrics to display CPU usage, memory consumption, and request rates in graphs, heatmaps, and alerts, enabling DevOps teams to identify issues before they impact users.
Verdict: Prometheus excels in monitoring, while Grafana is the go-to for visualization.
| Feature | Prometheus | Grafana |
| Stores metrics | ✅ Yes (TSDB) | ❌ No |
| Visualization | Basic | Advanced dashboards |
| Alerting | Alertmanager | Alert rules & visual alerts |
| Kubernetes support | Native | Visual only |
| Query language | PromQL | Uses data source queries |
| Long-term storage | Thanos, Cortex, VictoriaMetrics | Depends on source |
Having understood the core distinctions between Prometheus and Grafana, let’s explore their unique capabilities in more detail.
1. Data Handling: Prometheus vs Grafana
Prometheus stores data in a time-series database (TSDB) optimized for high-cardinality metrics such as pod names, namespaces, and container IDs. Each metric is timestamped, making it ideal for SRE troubleshooting and incident analysis.
Learn how to detect and resolve deployment failures efficiently using Middleware.
Grafana does not store data. It uses the source’s query languages (PromQL for Prometheus, SQL for databases, LogQL for Loki). This means Grafana is limited by the data source’s response time.
Verdict: Prometheus wins in raw data collection; Grafana wins in presenting that data clearly.
Understand Prometheus metrics in depth and get tips on leveraging them effectively with Middleware.
2. Standalone Functionality of Grafana vs Prometheus
Prometheus vs Grafana tools differ in their independent operational characteristics. Prometheus works independently. The system executes collection tasks alongside data storage and notification generation without depending on human supervisors.
Grafana requires a data source, such as Prometheus, to obtain its data. This system works similarly to a digital image display, which requires phone-based analytics to populate its screens.
Verdict: Prometheus stands alone, while Grafana needs a data source to shine.
3. Flexibility and Extensibility in Grafana and Prometheus
Prometheus is designed to collect and query time-series metrics from systems, applications, and cloud infrastructure. It is highly extensible via exporters and integrations, but its scope is limited to metrics; it does not handle logs, traces, or business data.
Middleware supports integrations across metrics, logs, traces, and alerting, so you can connect Prometheus, Grafana, and more in one unified observability platform. Explore Middleware Integrations →
Grafana, on the other hand, is far more flexible because it can connect to a wide range of data sources, including Prometheus, Loki, Elasticsearch, SQL databases, cloud services, and more. This allows teams to combine metrics, logs, and operational data into a single unified view, making Grafana a powerful platform for observability and performance analysis.
Verdict: Grafana wins for flexibility and extensibility, integrating with multiple data sources and supporting a broader range of monitoring and analytics use cases.
Learn how Grafana Loki works and how Middleware simplifies log aggregation alongside metrics and traces.
4. Integration Approach in Prometheus vs Grafana
The integration in Prometheus and Grafana is straightforward: Prometheus collects the metrics. Grafana uses that data to build dashboards. This approach lets you achieve robust monitoring and visualization, such as combining a precise sensor system with an intuitive control panel.
Prometheus integrates directly with applications, servers, and cloud infrastructure through exporters and service discovery mechanisms to collect real-time metrics. It stores this data in its own time-series database and exposes it via a powerful query language (PromQL) for analysis and alerting.
💬 Turn your natural language into powerful queries! Learn how with our step-by-step guide.
Grafana integrates at the visualization layer by connecting to Prometheus and many other data sources, allowing teams to query, compare, and visualize metrics from multiple systems in a single interface. This separation of data collection and visualization makes the stack highly modular and easy to extend as infrastructure grows.
Verdict: Both work best when integrated—Prometheus for data collection and Grafana for displaying that data.
5. Use Cases of Prometheus vs Grafana
Prometheus is best suited for real-time monitoring of infrastructure and applications, especially in cloud-native environments such as Kubernetes and microservices. It is commonly used to track system health and performance metrics, and to trigger automated alerts when services fail or performance drops.
Grafana is widely used for visualizing and analyzing data from multiple sources, making it ideal for operational dashboards, troubleshooting, performance analysis, and long-term trend monitoring. Teams use Grafana to explore metrics, identify anomalies, and share insights across engineering, operations, and business teams.
Verdict: Prometheus is the go-to tool for live system monitoring and alerting, while Grafana excels at turning monitoring data into actionable insights and visualizations.
6. Scaling Challenges in Prometheus and Grafana
Prometheus can encounter scalability limits when handling long-term data retention, large volumes of metrics, and high-cardinality labels. While approaches such as federation, remote storage, and sharding help scale its capacity, they also introduce additional operational complexity.
Grafana scales well as a visualization layer, but performance can degrade when dashboards become too complex or when they query large datasets across multiple data sources. Poorly optimized queries and overloaded dashboards can lead to slower load times and reduced usability.
Verdict: Both tools require careful planning to scale effectively, with Prometheus needing strategies for data management and Grafana managing dashboard performance.
Here’s a quick comparison between Prometheus vs Grafana:
Prometheus vs Grafana: Which one is right for you?
Choosing between Prometheus vs Grafana depends on your monitoring needs, team size, and existing setup. Here’s when to use each tool:
When to use Prometheus
- Live system monitoring and warning functionality is best handled by Prometheus, which provides continuous time-series data acquisition and storage.
- The Prometheus service provides excellent infrastructure monitoring capabilities, including Kubernetes, by extracting data from pods, services, and nodes.
- Works well for automated alerting. The built-in alert manager notifies teams immediately when predefined thresholds are breached, reducing response times.
- Limited visualization features. Prometheus includes basic graphing but lacks advanced dashboards, making it harder to visualize trends.
Looking for other monitoring solutions? Explore the top Prometheus alternatives and see how Middleware stacks up.
When to use Grafana
- Data visualization and dashboard creation work best with Grafana because it transforms metrics into graphical dashboards for analyzing system performance over time.
- Grafana enables connections to many database systems, including Prometheus as its main source, and extends to MySQL, Elasticsearch, Loki, and other data sources.
- The long-term trends become more visible in Grafana because it stores historical data, whereas Prometheus has limited data retention.
- Decision-makers benefit from this platform because teams can build dashboards that present actionable system information to support better decision-making by executives.
Running Kubernetes? Learn how to integrate Prometheus with Middleware for full cluster observability. [Integrate with Kubernetes →]
Best Practices for Prometheus and Grafana
To scale monitoring efficiently, Prometheus must be tuned for efficient metric collection and storage, while Grafana dashboards should be designed for performance and clarity. Together, this ensures fast, accurate insights without overloading your monitoring stack.
Setting Up Prometheus for Optimal Performance
A well-optimized Prometheus setup ensures efficient data collection, minimal resource usage, and effective alerting.
Optimizing Prometheus for Performance
- Scrape Intervals: Use 5s-15s for high-traffic apps and 30s-1m for less dynamic metrics to balance accuracy & performance.
- Limit Metric Cardinality: Avoid high-cardinality labels (e.g., user_id) and use aggregated labels (status_code, endpoint) to reduce memory usage & query load.
- Use Recording Rules: Precompute frequent queries for faster dashboards & efficient alerting.
- Scaling: To handle more data and keep Prometheus running smoothly, the federation collects metrics from multiple servers in one place, making monitoring easier. Sharding spreads the workload across different servers, preventing overload. These methods help Prometheus scale and stay reliable.
Designing Grafana Dashboards
A properly organized dashboard should have infrastructure KPIs separate from both application KPIs and business KPIs. A well-designed Grafana dashboard separates infrastructure KPIs, application metrics, and business metrics to avoid clutter. Use time-series graphs for trends, heatmaps for distributions, and single-stat panels for critical values. Alerts and annotations help teams correlate incidents with system changes and releases.
Users can set alerts in addition to creating event annotations. The redesign will deliver better performance by combining Prometheus recording rules and Grafana time-range features when users write simple query structures.
⚡Fix your application performance and reduce downtime with real-time insights.
Managing Prometheus Data Retention
Prometheus users can manage their data storage retention duration through the `–storage.tsdb.retention.time` command.
For long-term storage, Prometheus is commonly paired with systems like Thanos, Cortex, or VictoriaMetrics, which add scalable object storage, global querying, and data compression.
System stability and data storage block compaction in TSDB occur through the merger process, which is dependent on scheduled monitoring operations.
How Prometheus and Grafana work together
Prometheus is an open-source platform that serves as a monitoring tool and provides time-series database functionality. The pull-based collecting system of Prometheus acquires system metrics such as CPU and memory data, and measurement statistics to enable real-time evaluation.
The open-source software Grafana enables efficient anomaly detection in Prometheus data through its dashboard visualization, supporting DevOps teams in observability. These tools unite to create an advanced system observability solution for DevOps operations.
Step-by-step guide to connecting Prometheus and Grafana
You can establish monitoring and visualization using Docker to integrate Prometheus and Grafana. The setup guide directs readers to deploy Prometheus and Grafana Docker containers to maintain a standard deployment process across all testing scenarios.
Create the` prometheus.yml` configuration file. This file defines which metrics Prometheus will scrape and where they are sourced. Here’s the configuration:
global:

  scrape_interval: 15s

scrape_configs:

  - job_name: 'prometheus'

    static_configs:

      - targets: ['localhost:9090']

  - job_name: 'node-exporter'

    static_configs:

      - targets: ['node-exporter:9100']
Prometheus operates node scraper events with a 15-second preset in the `prometheus.yml` configuration. Prometheus uses port `localhost:9090` to monitor its internal metrics and track system performance through the connection to `node-exporter:9100`.
Starting the Prometheus server with exposure to port `9090` requires executing this command:
docker run -d --name=prometheus \

  -p 9090:9090 \

  -v $(pwd)/prometheus.yml:/etc/prometheus/prometheus.yml \

  prom/Prometheus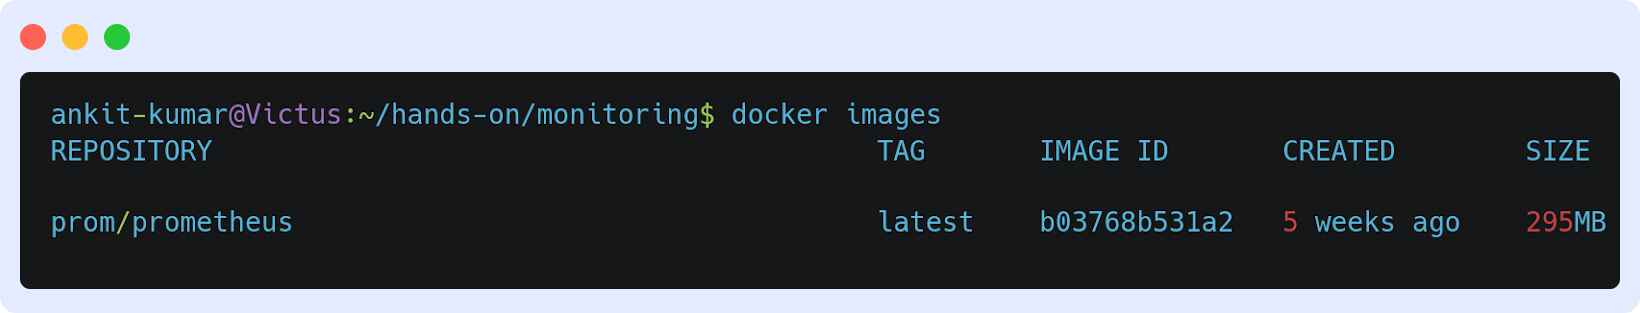
To confirm the installation, navigate to http://localhost:9090, which is dedicated to Prometheus. Then, navigate to status and select the` target health` to check if metrics are being scraped successfully.
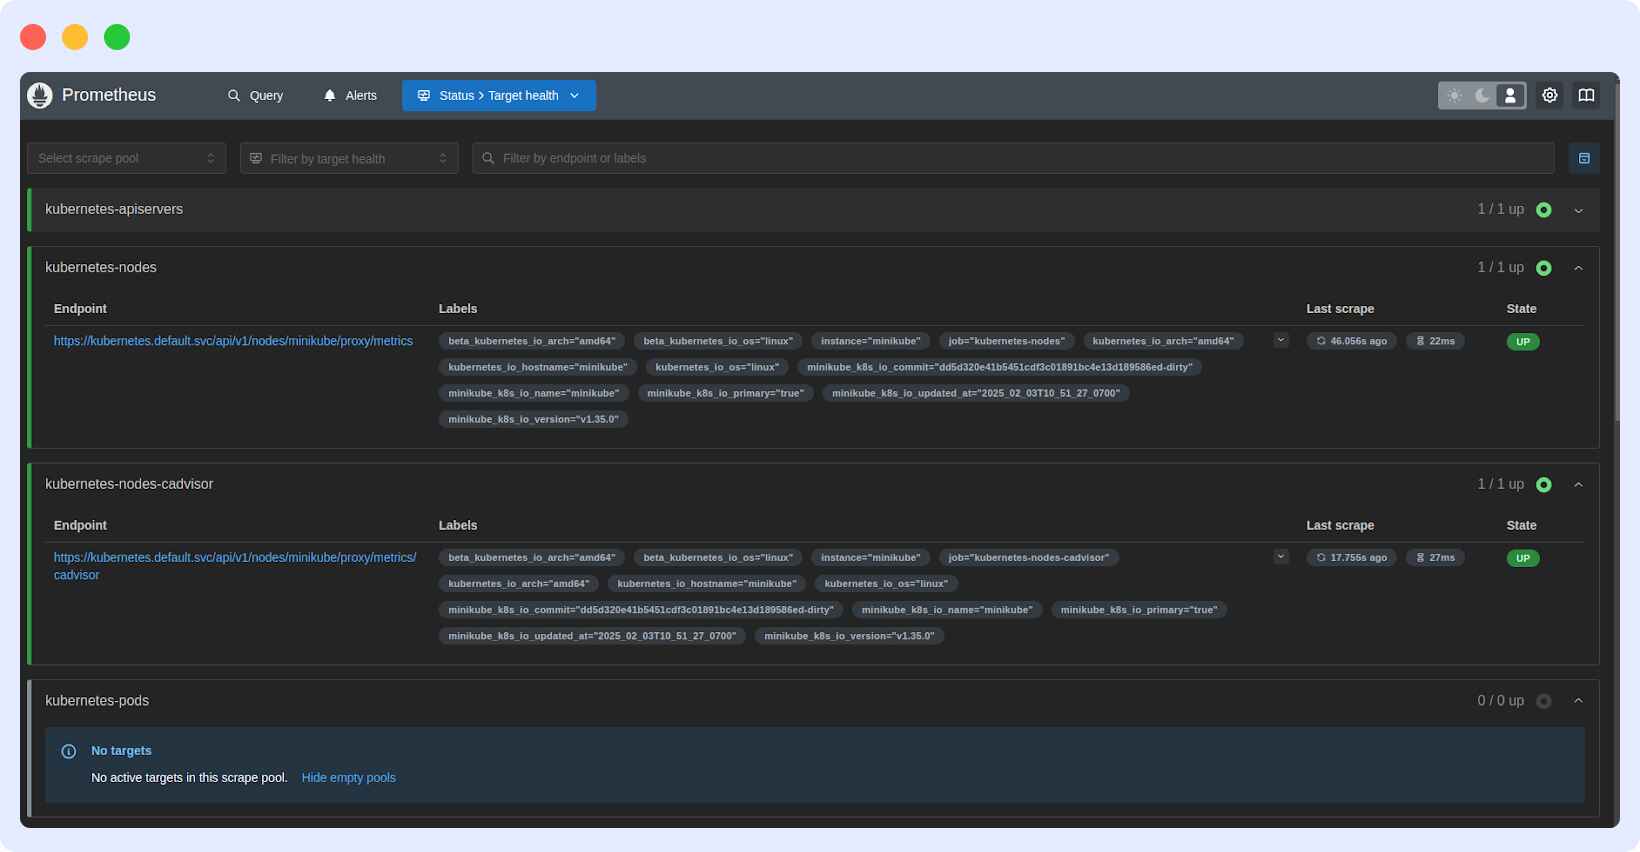
This page shows whether Prometheus is successfully scraping metrics from the configured targets.
The Kubernetes-nodes and kubernetes-node-cadvisor targets are successfully collecting node and container metrics, as shown by the “UP” status.
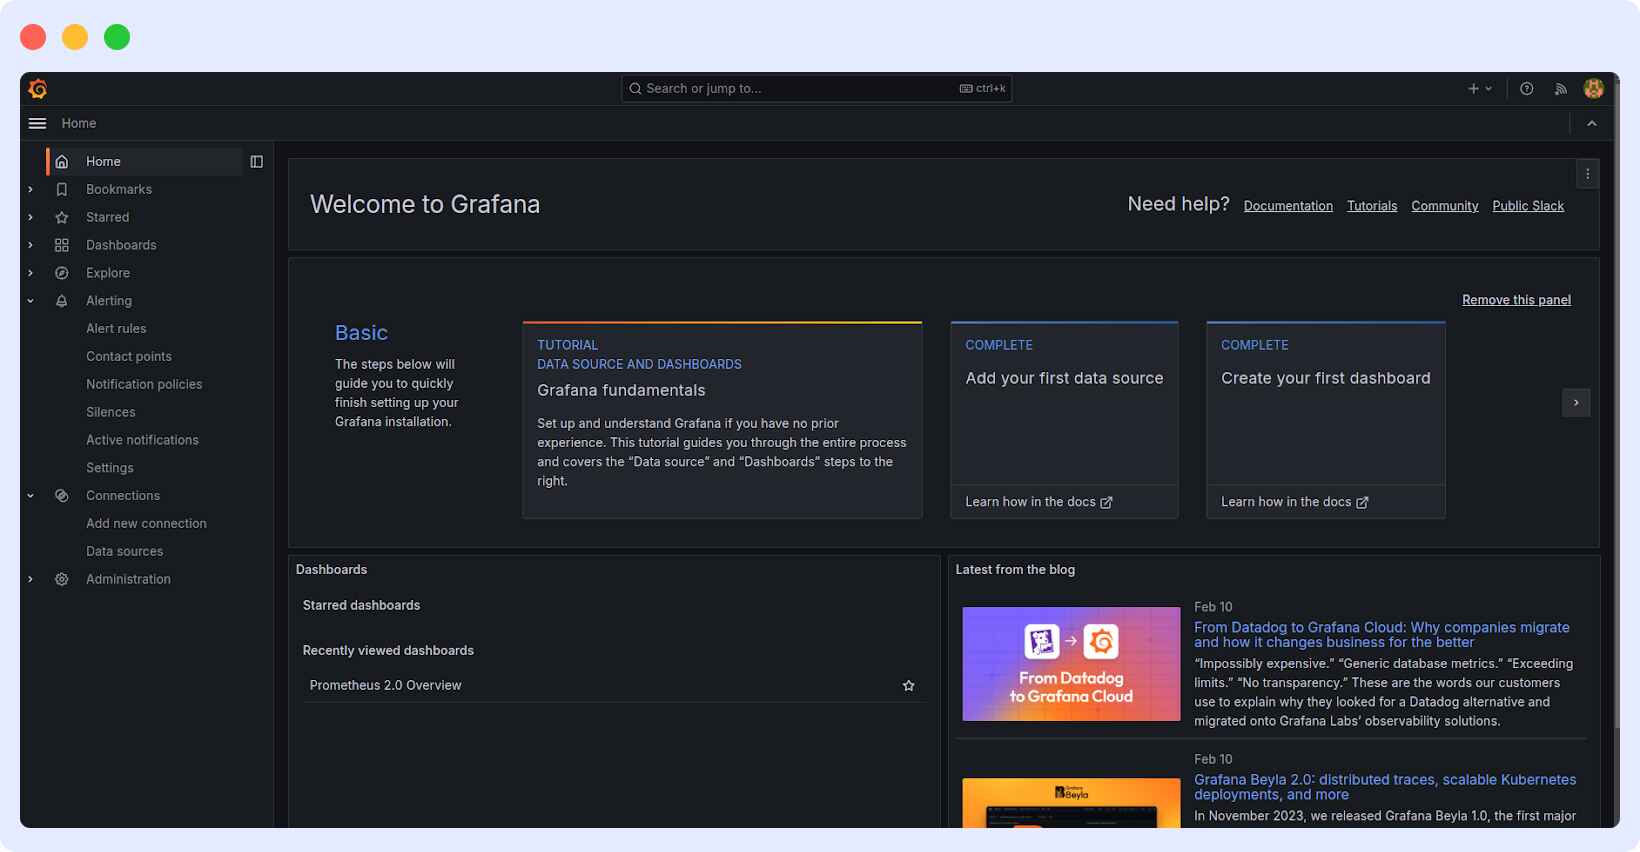
Next, set up Grafana in Docker. A predefined configuration file is not needed when starting the Grafana container. Grafana incorporates a setup interface that lets users modify their data sources, dashboards, and other settings through its interactive interface after the initial launch.
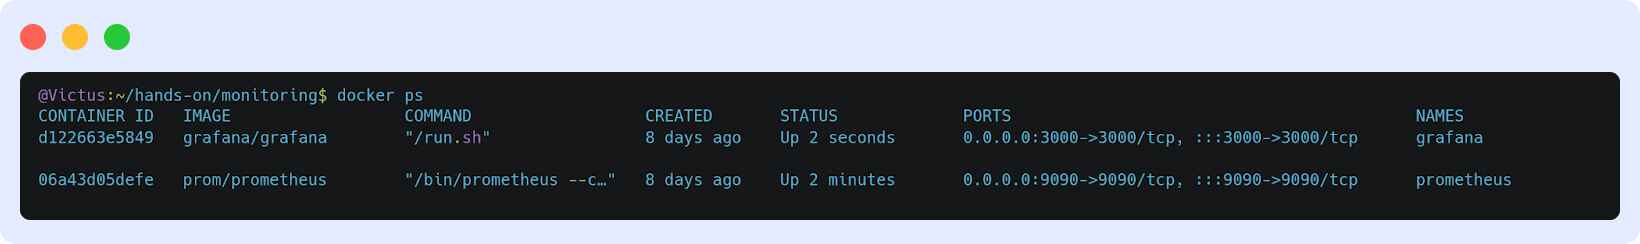
Go to http://localhost:3000, log in with admin, and navigate to Configuration > Data Sources. Click Add Data Source, select Prometheus, and enter the server URL (http://localhost:9090).
Click Save & Test to connect. Once integrated, Grafana can now pull Prometheus metrics using PromQL for server load, CPU, and memory usage. You can create real-time dashboards with graphs, heat maps, and gauges.
Create a Grafana dashboard in Dashboards > New Dashboard > Add New Panel. The combination of Prometheus as a data source with node_cpu_seconds_total PromQL query as input lets you apply and view the visualization to monitor effectively.
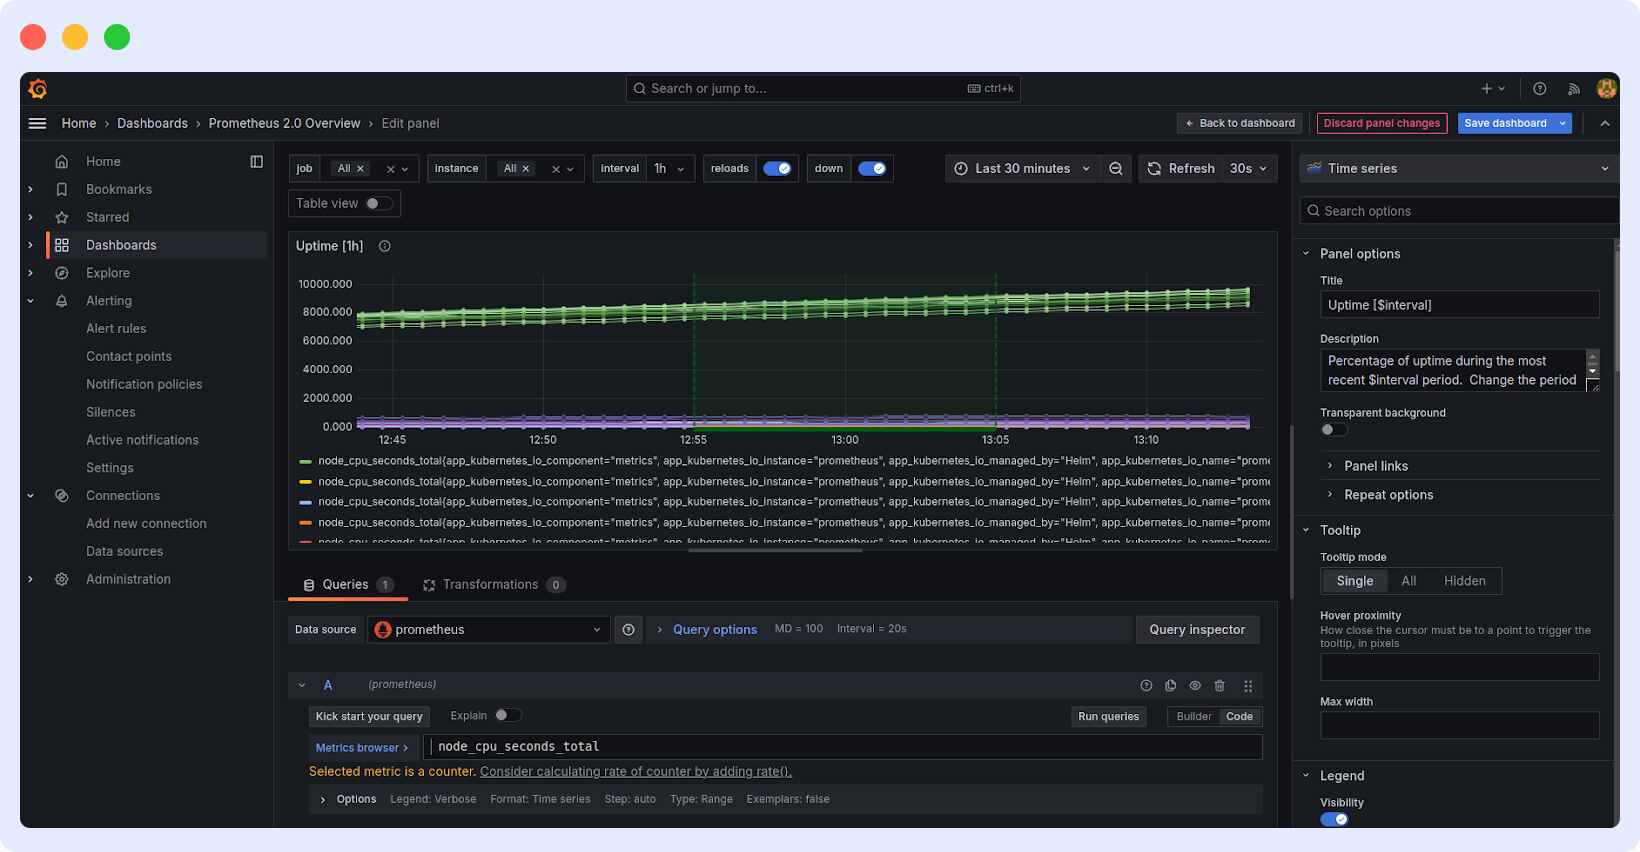
Here, the Grafana dashboard shows CPU usage data from Prometheus using the `node_cpu_seconds_total`query. It tracks uptime over the last 30 minutes, with data refreshed every 30 seconds, helping monitor system performance in real time.
Common Challenges and Solutions
As Prometheus and Grafana scale with growing infrastructure, several challenges arise, including managing performance, avoiding cluttered dashboards, and ensuring real-time accuracy. Addressing these issues effectively ensures a smooth and efficient monitoring experience.
1. Scaling Prometheus for Large Environments
As data grows, a single Prometheus instance may face performance issues. Use federation to aggregate data efficiently and sharding to distribute targets across multiple servers, reducing load and improving query performance.
2. Avoiding Grafana Dashboard Overload
Too many visualizations can slow down dashboards and reduce effectiveness. Keep them clean by focusing on critical metrics, using templating and variables for dynamic views, and organizing data into separate panels. Grouping related metrics improves readability and system efficiency.
3. Ensuring Real-Time Accuracy in Prometheus-Grafana Integration
To avoid data delays, set optimized scrape intervals in Prometheus, use recording rules for frequent queries, and adjust Grafana’s refresh rate to match data updates. This keeps dashboards accurate and responsive.
A Better Prometheus and Grafana Alternative: Middleware
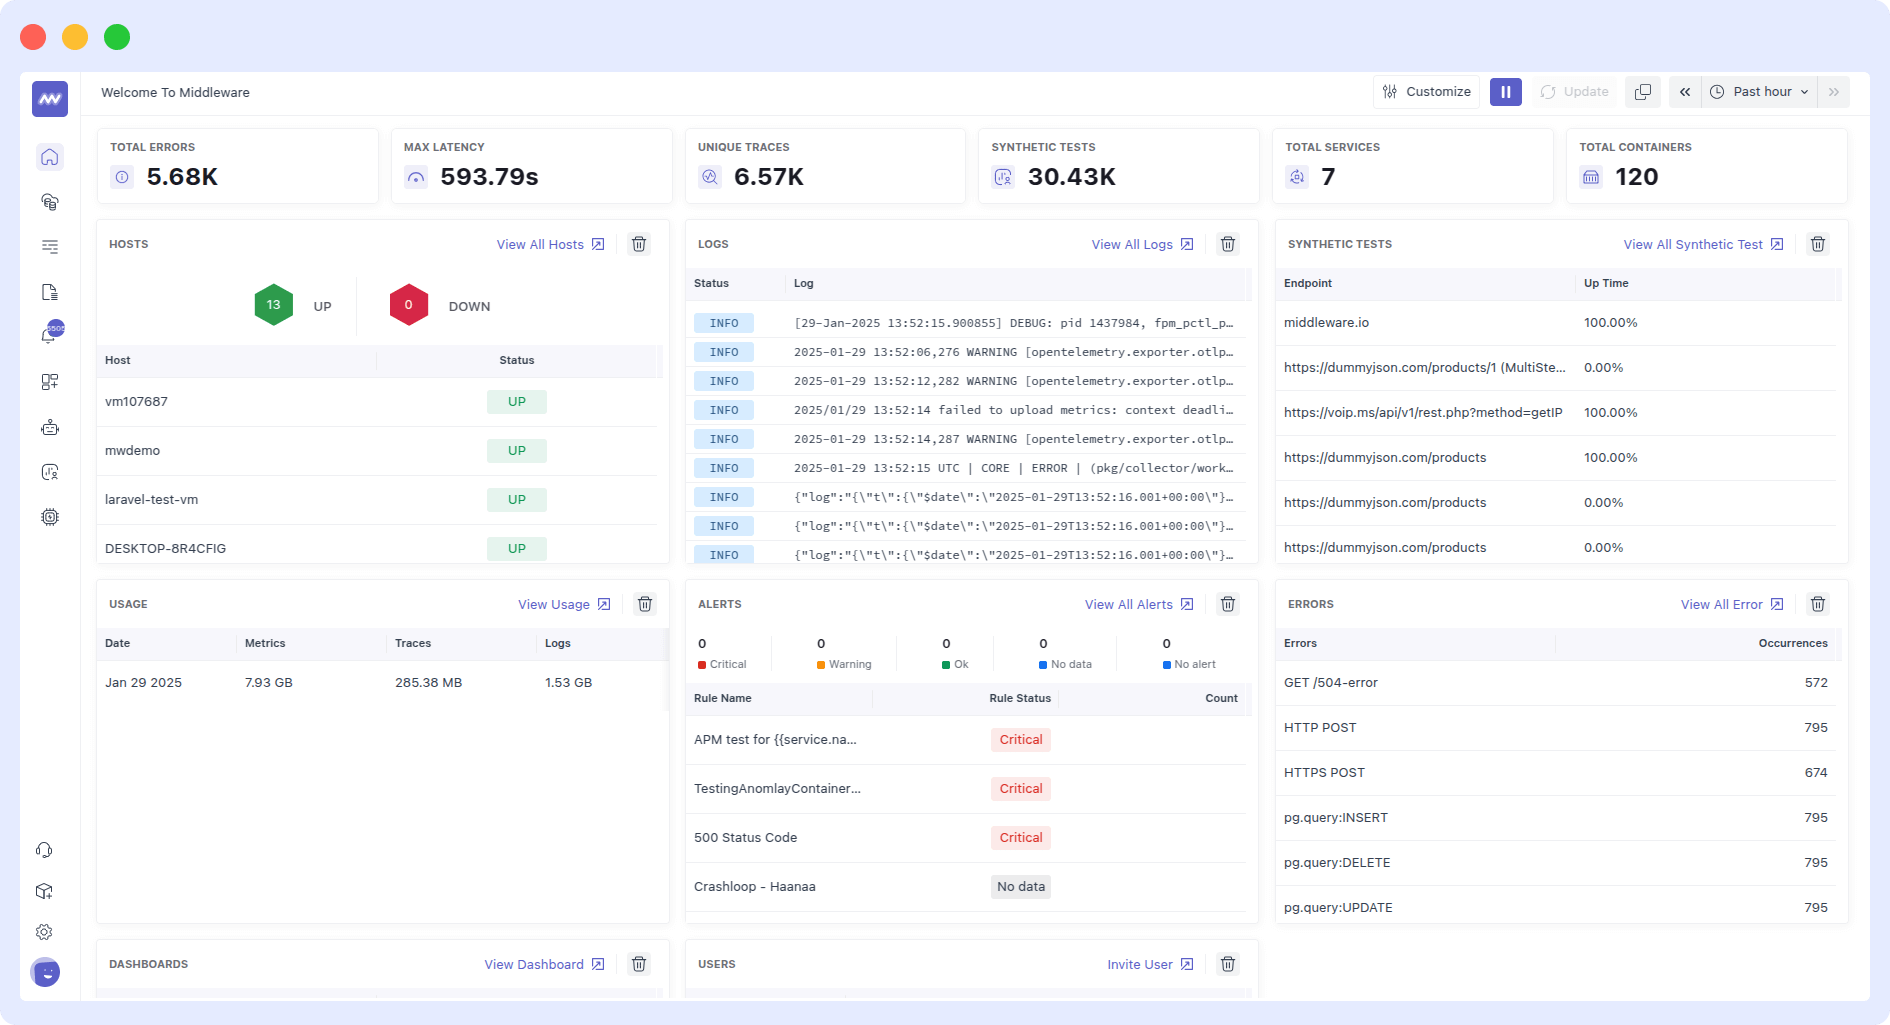
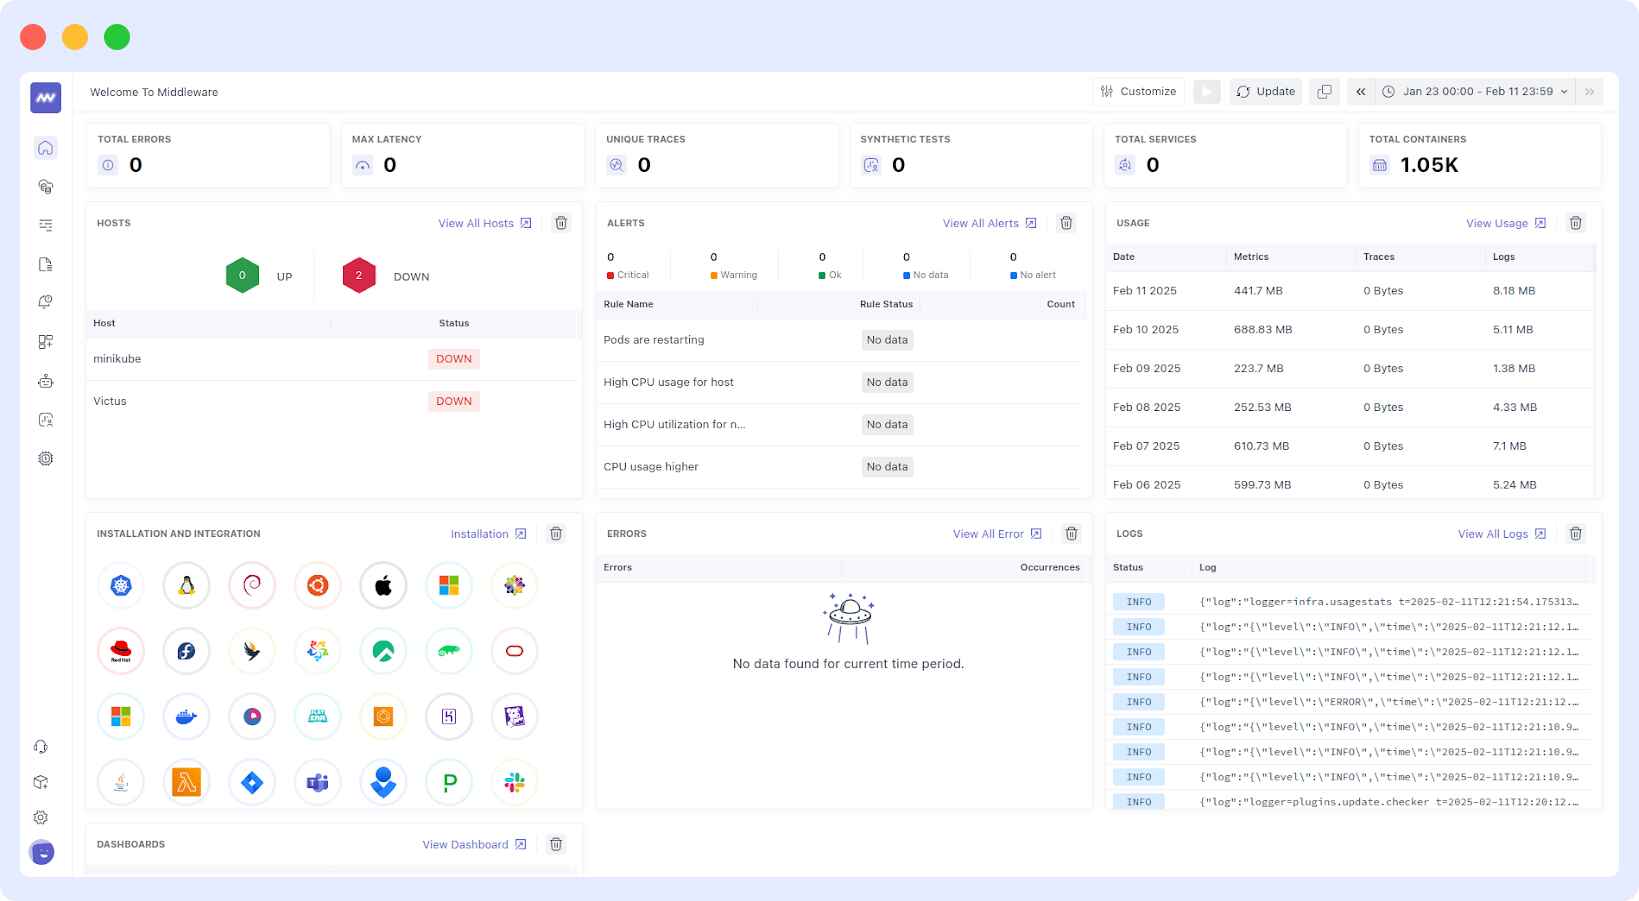
Middleware provides a unified observability platform that combines metrics, logs, traces, and alerts into a single, easy-to-use dashboard. Instead of managing separate tools like Prometheus for metrics, Grafana for visualization, and Loki for logs, teams can monitor their entire infrastructure and applications from one place with minimal setup.
🌟New to Middleware? Get started quickly with our guide and begin monitoring your systems today. [Getting Started →]
Built for modern DevOps and cloud-native teams, Middleware removes the complexity of stitching together multiple open-source tools. It automatically connects Kubernetes, containers, hosts, applications, and cloud services, giving engineers real-time visibility into system health, performance bottlenecks, and failures.
📝Debug Logging → Learn how to leverage logs effectively to pinpoint issues quickly.
What Middleware Replaces
Traditional Prometheus + Grafana setups require:
- Managing metric storage and retention
- Configuring exporters and scraping
- Creating and maintaining dashboards
- Adding extra tools for logs and traces
Middleware delivers all, including:
- Metrics, logs, and traces in one platform
- Prebuilt dashboards for Kubernetes, services, and infrastructure
- Built-in alerting and anomaly detection
- Correlation between logs, metrics, and traces
This means teams spend less time on tooling and more time fixing issues and improving reliability.
🔍Want a deeper comparison of Prometheus, Grafana, and Middleware? Explore use cases, features, and integrations in one place.
Why Teams Choose Middleware
Middleware gives you what Prometheus and Grafana cannot do alone:
- Unified observability instead of siloed tools
- Automatic instrumentation for cloud and Kubernetes
- Real-time service health, latency, and error tracking
- Fast root-cause analysis by linking logs, metrics, and traces
- Simple setup without managing databases, retention, or scaling
Whether you’re running microservices, Kubernetes, or cloud applications, Middleware gives you enterprise-grade monitoring without operational overhead.
Prometheus + Grafana vs Middleware
Prometheus and Grafana are powerful, but they were never designed to be a complete observability platform. They require additional components such as Alertmanager, Loki, Thanos, and Jaeger to achieve what Middleware delivers natively.
Curious how Middleware compares to Grafana? Check our side-by-side feature comparison to see why teams are switching.
Conclusion
If you want full control and enjoy managing monitoring infrastructure, Prometheus and Grafana are great tools. But if you want faster setup, less maintenance, and deeper visibility, Middleware is the smarter choice.
It provides teams with everything Prometheus and Grafana offer, plus much more, in a single, unified observability platform.
Prometheus and Grafana are widely used by DevOps teams in India, the US, Europe, and cloud-native companies running Kubernetes on AWS, GCP, and Azure.
FAQ
Which is better, Grafana or Prometheus?
Prometheus serves as both a time-series database and a monitoring system, while Grafana serves as a visualization dashboard. Users with data-collection requirements, along with those who require alerts, should select Prometheus as their monitoring platform. When performing advanced visualizations and analytics, users should choose Grafana instead. A complete monitoring solution emerges from their joint operation.
Do I need Prometheus for Grafana?
No, Grafana can work with multiple data sources like InfluxDB, Elasticsearch, and MySQL. However, if you need real-time monitoring with time-series data, Prometheus is a common data source for Grafana.
What is the difference between Grafana and Prometheus and Kibana?
Prometheus functions as a monitoring database that processes metrics in real time using its time-series data model. Grafana functions as an interactive dashboard creator for data analysis, connecting to Prometheus and other data sources. Kibana primarily operates to find and analyze log data stored in Elasticsearch for log management and observability.
Is Prometheus a visualization tool?
The Prometheus monitoring and alerting system serves as a data-collection service for time-series data storage. The system operates with a basic web interface that lacks the sophisticated visualization options found in Grafana.
Can Grafana replace Prometheus?
No. Grafana does not collect or store metrics. It requires a data source like Prometheus, Loki, or a database.
Is Prometheus enough for production monitoring?
For small teams, yes. For large environments, you need Thanos, Cortex, or Middleware for scale and long-term storage.
What is better than Prometheus + Grafana?
Unified observability platforms like Middleware, SigNoz, or Datadog replace multiple tools with one system.
Does Grafana store data?
No. Grafana only visualizes data from sources like Prometheus, Loki, Elasticsearch, or databases. It does not store metrics, logs, or traces itself.