
Anomaly detection in AI models is critical because AI systems fail in different ways from traditional software. A model can maintain 99.9% uptime while producing completely wrong predictions. GPU memory can leak silently over days. LLM outputs can drift from coherent to nonsensical without triggering a single infrastructure alert.
This guide explains why real-time anomaly detection is vital in modern AI systems. It outlines key anomaly types, common detection methods, and how to build monitoring systems that identify issues before they cause security or ethical problems.
Observability platforms like Middleware help surface anomalies by correlating metrics, traces, and logs. However, they complement, rather than replace, specialized MLOps, model validation, or security tools, which help engineering teams analyze incidents and pinpoint root causes.
💡A recommendation model may continue serving responses with normal latency and zero error rates, yet its click-through rate drops by 18% due to unseen data drift. Without anomaly detection on prediction distributions, this issue can persist for weeks before business metrics reveal the impact.
What Is Anomaly Detection in AI Models?
Anomalies are unusual behaviors, patterns, or system states that are outside the model’s normal operating range. The deviations may occur at any point in the AI lifecycle, from data ingestion and model inference to system operations.
They typically indicate a problem with data quality, model drift, poor performance, or a possible attack. Their timely detection is one factor in maintaining reliable and safe production models.
Why anomaly detection matters in production AI
Without real-time anomaly detection, organizations risk deploying models that appear operational but deliver incorrect, biased, or unsafe outcomes. This gap is especially dangerous in industries such as finance, healthcare, customer support automation, and generative AI platforms, where decisions directly impact users.
Anomaly Types and Threats to AI Models
Anomalies can emerge at any stage of the AI lifecycle, during data ingestion, model inference, or system execution. Understanding where failures originate helps teams design targeted monitoring strategies rather than relying on generic alerts.
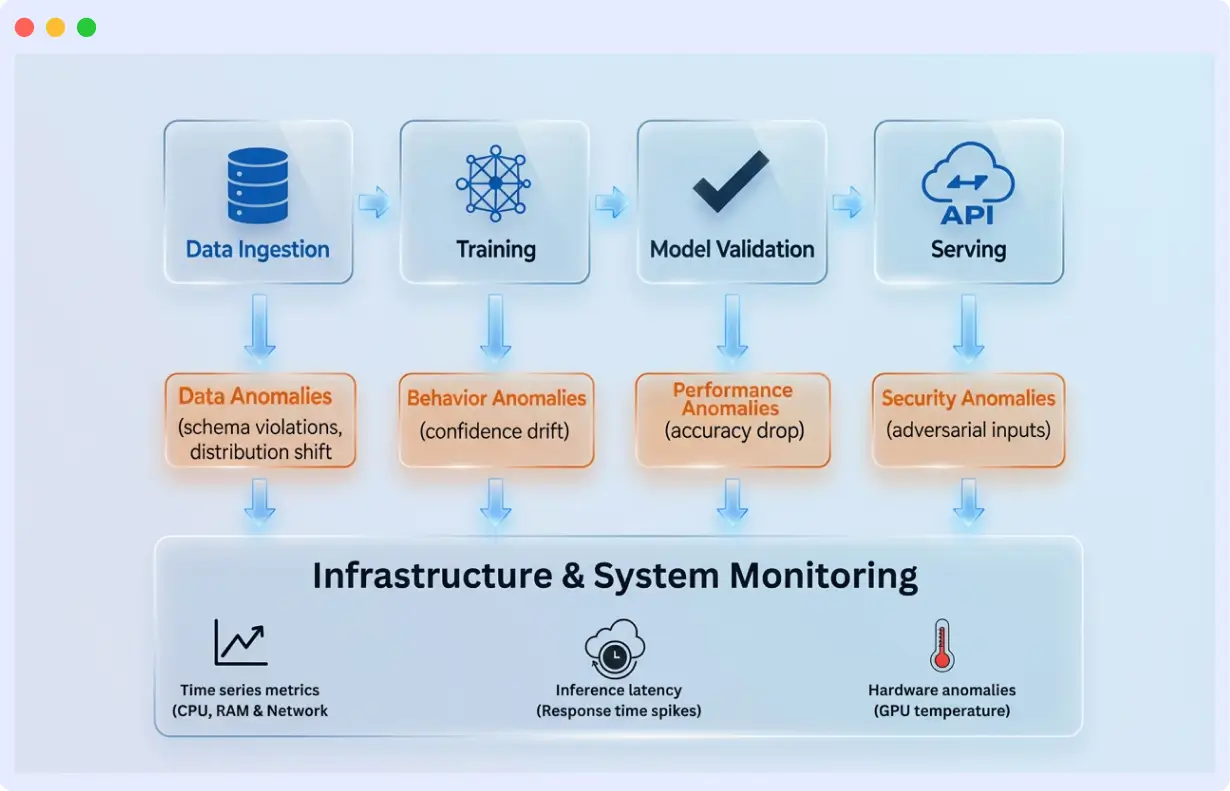
Before diving into implementation, here’s what you’re monitoring for:
- Data Anomalies: Issues in input data, including missing values, corrupted fields, schema violations, or distribution shifts. They may lead to inaccurate model results when not identified in time.
- Model Behavior Anomalies: Aberrant behavior in the way the model responds to inputs or responds to outputs, such as feature importance that is not expected, or atypical attention behavior or high or low prediction confidence scores.
- Model Performance Anomalies: Decreases in accuracy, precision, or recall, which may be due to data drift, concept drift, or label drift, can indicate that predictions are becoming unreliable.
- Operational/System Anomalies: Problems with the infrastructure supporting the model, including CPU/GPU spikes, memory leaks, increased latency, or throughput drops, can indirectly affect model performance.
- Security Anomalies: Intended attacks or unauthorized access, as well as adversarial inputs, data extraction attacks, abnormal access patterns, or probing the model vulnerability systematically.
🔹These anomalies often indicate upstream pipeline issues or changes in real-world user behavior that the model was never trained to handle.
What Are the Most Common Threats to AI Models?
In production AI systems, these threats rarely appear as sudden failures. They typically surface as subtle behavioral changes that only become visible when metrics, traces, and logs are analyzed together.
🛡️In real-world deployments, AI anomalies are often triggered intentionally or unintentionally through environmental changes, malicious behavior, or feedback loops. Below are the most common threats observed in production systems.
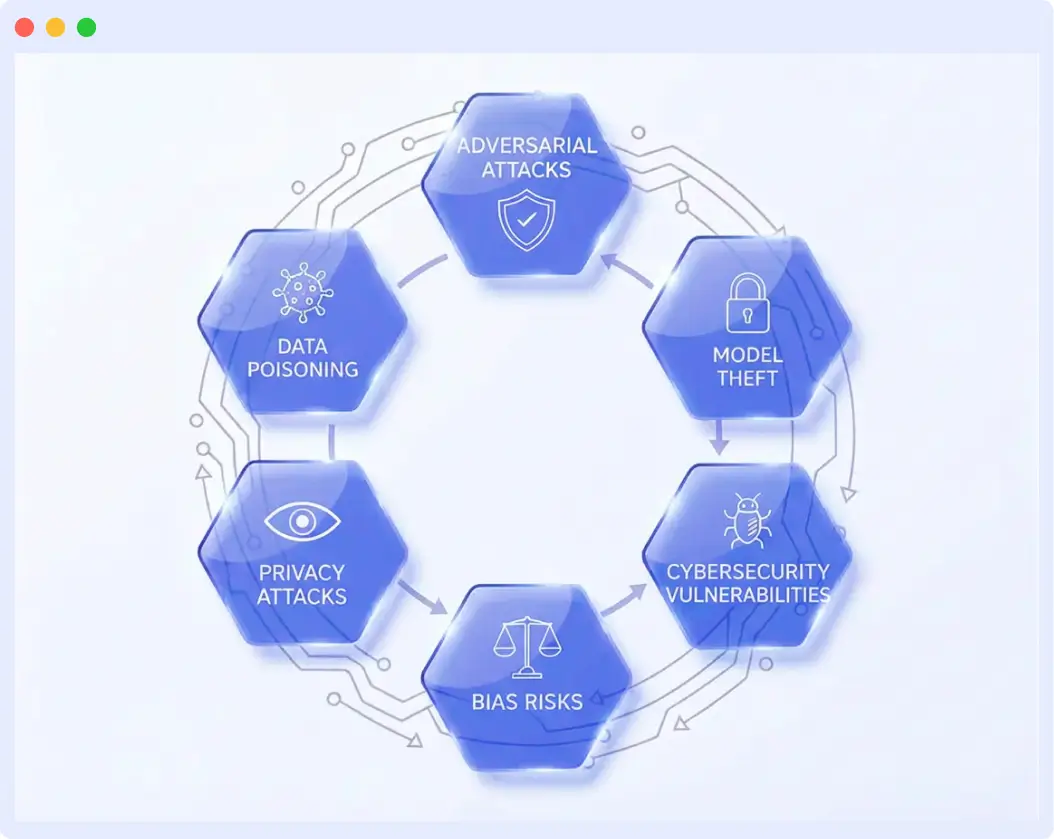
- Adversarial Attacks
Precisely engineered inputs to push the model to give wrong predictions. These attacks exploit the model’s decision boundaries and can cause misclassification with small, often imperceptible, perturbations.
- Data Poisoning
Malicious or corrupted training data was injected during model development or retraining. Small but targeted modifications can alter the model’s behavior, bias its outputs, or embed backdoors that attackers can later trigger.
- Model Theft and Extraction
Attempts to replicate a deployed model by repeatedly querying it and rebuilding an approximation. This compromises intellectual property and exposes the model to further attacks, including inversion and adversarial replays.
- Model Inversion and Privacy Attacks
Techniques that reconstruct sensitive training data from model outputs or gradients. Attackers can extract personal information, business logic, or private attributes that the model indirectly encodes.
- Bias and Ethical Risks
Systemic drift or skew that causes the model to favor or disadvantage particular groups over time. These risks are amplified when production data differs significantly from the training environment, or when feedback loops reinforce uneven behavior.
Over time, feedback loops, such as the reinforcement of past predictions, can amplify bias, making ethical drift one of the hardest anomalies to detect without longitudinal monitoring.
🔹Turn data into foresight, explore what’s next in observability and AI monitoring. Read Observability Predictions.
- Cybersecurity Vulnerabilities
Cybersecurity risks are vulnerabilities that attackers may exploit in an AI system. Unsecured APIs, insufficient encryption, outdated software, and improperly configured cloud setups are all factors that enable manipulation of training data or disrupt how the system performs its work.
Anomaly Detection Techniques for AI Models
Anomaly detection techniques help identify abnormal patterns across data, model behavior, and system performance in production AI systems. These methods enable early detection of drift, degradation, and unexpected behavior before user impact occurs.
Population Stability Index (PSI)
Compares how input data distributions change over time by binning data and measuring divergence. Widely used in credit scoring and financial models where data stability is critical.
Best for: Monitor feature distributions continuously. PSI scores below 0.1 indicate minimal change, 0.1-0.25 signals moderate drift requiring investigation, and above 0.25 means a significant shift warranting model retraining.
import numpy as np

def calculate_psi(expected, actual, buckets=10):
    # PSI is used to track distribution shift between reference and live data.
    # Values above ~0.25 usually mean the model is seeing something new.

    if expected.size == 0 or actual.size == 0:
        raise ValueError("Expected and actual arrays must not be empty")

    min_val = expected.min()
    max_val = expected.max()

    if max_val == min_val:
        # No variance in reference data, PSI is meaningless here
        return 0.0

    def normalize(values):
        return (values - min_val) / (max_val - min_val)

    expected_norm = normalize(expected)
    actual_norm = normalize(actual)

    expected_hist, _ = np.histogram(expected_norm, bins=buckets, range=(0, 1))
    actual_hist, _ = np.histogram(actual_norm, bins=buckets, range=(0, 1))

    expected_ratio = expected_hist / expected.size
    actual_ratio = actual_hist / actual.size

    # Small constant to avoid log(0)
    eps = 1e-4
    expected_ratio = np.where(expected_ratio == 0, eps, expected_ratio)
    actual_ratio = np.where(actual_ratio == 0, eps, actual_ratio)

    psi = np.sum((actual_ratio - expected_ratio) *
                 np.log(actual_ratio / expected_ratio))

    return float(psi)
Model Performance Monitoring in AI Models
Model performance monitoring tracks how well AI predictions align with expected outcomes over time. It helps detect early signs of drift, accuracy loss, or reliability issues before they affect users or business metrics.
Prediction Drift Detection
It is a method that monitors a model’s prediction dynamics, particularly when the true labels are not known immediately. Uses KL divergence or Wasserstein distance to compare current predictions against baseline patterns.
Best for: Production practices in the real world where output is received weeks or months later, i.e., loan defaults, medical outcomes or customer churn. It provides early warnings of shifts in teams before the accuracy problem can be measured directly.
from scipy.stats import entropy
import numpy as np

def check_prediction_drift(baseline_predictions, current_predictions, bins=20):
    """
    Compare prediction distributions using KL divergence
    Returns drift score and alert flag
    """
    # Compute distributions
    baseline_hist, bin_edges = np.histogram(baseline_predictions, bins=bins, density=True)
    current_hist, _ = np.histogram(current_predictions, bins=bin_edges, density=True)

    # Normalize
    baseline_hist = baseline_hist / baseline_hist.sum()
    current_hist = current_hist / current_hist.sum()

    # Avoid zeros for KL divergence
    baseline_hist = np.where(baseline_hist == 0, 1e-10, baseline_hist)
    current_hist = np.where(current_hist == 0, 1e-10, current_hist)

    # Calculate KL divergence
    kl_divergence = entropy(current_hist, baseline_hist)

    return {
        'kl_divergence': kl_divergence,
        'drift_detected': kl_divergence > 0.1  # Threshold
    }
LLM-Specific Monitoring
LLM-specific monitoring tracks token usage, latency, and output quality to prevent context overflow and hallucinations. It ensures large language models perform reliably while controlling costs and maintaining user trust.
Token Usage Tracking
Monitors prompt and response token consumption to prevent context window issues and control costs. Critical for LLM applications where hitting token limits causes truncation or failures. In LLM applications, token usage is one of the strongest early indicators of downstream latency, cost overruns, and truncation failures, especially in RAG-based systems where prompt size grows dynamically.
Best for: All LLM deployments, especially RAG systems, chatbots, or any application with variable prompt lengths. Track utilization percentage, not just absolute counts.
When instrumented using OpenTelemetry based tools such as OpenLIT or Traceloop, Middleware can capture token usage through LLM request traces. This removes the need for custom, one-off instrumentation logic in application code.
Token counts, utilization percentages, and downstream latency are then tracked together in Middleware, making it easier to identify context overflows, prompt bloat, and cost regressions as they emerge in production.
import tiktoken

def monitor_token_usage(prompt, response, model_name="gpt-4", context_limit=8192):
    """
    Track token usage and detect approaching context limits
    """
    encoder = tiktoken.encoding_for_model(model_name)

    prompt_tokens = len(encoder.encode(prompt))
    response_tokens = len(encoder.encode(response))
    total_tokens = prompt_tokens + response_tokens
    utilization = total_tokens / context_limit

    alert = None
    if utilization > 0.9:
        alert = {
            'type': 'context_limit_warning',
            'utilization': utilization,
            'total_tokens': total_tokens
        }

elif prompt_tokens > context_limit * 0.8:
        alert = {
            'type': 'prompt_truncation_risk',
            'prompt_tokens': prompt_tokens
        }

    return {
        'prompt_tokens': prompt_tokens,
        'response_tokens': response_tokens,
        'total_tokens': total_tokens,
        'utilization': utilization,
        'alert': alert
    }
Infrastructure-Level Anomalies in AI Systems
Infrastructure-level anomaly monitoring detects unusual CPU/GPU usage, memory leaks, or latency spikes that can impact AI performance. Early detection helps maintain stable, efficient, and reliable production AI systems.
GPU Memory Fragmentation Detection
Identifies when GPU memory remains allocated despite low utilization, indicating leaks or inefficient cleanup. Different from CPU monitoring due to GPU-specific allocation patterns.
Best for: Deep learning inference setups operating continuously over durations. Memory fragmentation can gradually degrade performance without triggering out-of-memory alerts.
GPU memory pressure alone is often noisy, but when Middleware correlates rising memory usage with inference latency and trace-level slowdown, it narrows the investigation to likely causes such as GPU memory fragmentation rather than treating memory pressure as an isolated metric anomaly.
Middleware provides the correlated metrics and traces needed for this analysis, while the exact detection logic and thresholds may vary across platforms and organizations.
import pynvml

def detect_gpu_anomalies(gpu_id=0):
    alerts = []

    pynvml.nvmlInit()

    try:
        handle = pynvml.nvmlDeviceGetHandleByIndex(gpu_id)

        mem = pynvml.nvmlDeviceGetMemoryInfo(handle)
        util = pynvml.nvmlDeviceGetUtilizationRates(handle)
        temp = pynvml.nvmlDeviceGetTemperature(
            handle, pynvml.NVML_TEMPERATURE_GPU
        )

        mem_used_pct = (mem.used / mem.total) * 100
        mem_free_mb = mem.free / (1024 ** 2)

        # High allocation with very little contiguous free space
        if mem_used_pct > 82 and mem_free_mb < 900:
            alerts.append({
                "issue": "memory_fragmentation",
                "used_pct": round(mem_used_pct, 2),
                "free_mb": round(mem_free_mb, 1),
            })

        # GPUs usually start throttling around this range
        if temp >= 82:
            alerts.append({
                "issue": "thermal_pressure",
                "temperature": temp,
            })

        # Memory stays high but kernels are barely running
        if mem_used_pct > 70 and util.gpu < 15:
            alerts.append({
                "issue": "suspected_memory_leak",
                "used_pct": round(mem_used_pct, 2),
                "gpu_util": util.gpu,
            })

    finally:
        pynvml.nvmlShutdown()

    return alerts
Key Challenges in Real-Time AI Anomaly Detection
Real-time anomaly detection is important, but putting a solid monitoring system in place isn’t always straightforward due to some of these reasons:
- Many AI models operate like black boxes, making it difficult to understand why they fail or produce unexpected results.
“In production AI systems, the most dangerous failures are silent ones, models that technically work but no longer behave as expected. Observability closes that gap by revealing what traditional monitoring cannot.”
Bajrang Suthar, Senior AI Engineer at Middleware
- Dynamic data environments cause drift, which means the definition of “normal” changes over time and becomes harder to track.
- Real-time systems also handle large volumes of data that must be processed rapidly, placing excessive demands on the monitoring pipeline.
- The various tools, structures, and measures are not standardized, making it difficult to create a single monitoring system across teams.
- When detection systems are too strict or overly cautious, they trigger unnecessary alerts that create confusion and undermine confidence in the monitoring system.
Real-Time Anomaly Detection with Middleware
Middleware supports anomaly detection in AI models by correlating metrics, traces, logs, and LLM signals in real time. This provides real-time visibility into anomalies across your AI systems.
a. Dynamic Baselines for Early Detection
In production, Middleware continuously observes system behavior and establishes dynamic baselines based on normal patterns. These baselines adapt to metric volatility and seasonal changes, helping teams detect meaningful deviations early.
b. Correlating Signals for Root Cause Analysis
When anomalies occur, Middleware looks at how signals relate to one another rather than evaluating metrics in isolation. For example, if LLM inference latency increases while GPU utilization remains within expected ranges, this deviation is flagged because these signals typically correlate.
By combining metrics with trace-level data, Middleware narrows the investigation to likely causes instead of surfacing disconnected alerts.
c. Incident Grouping and Context
Related signals are then grouped into a single incident, providing engineers with context around impact and priority. Latency shifts, memory pressure, and trace slowdowns are viewed together, making it easier to understand what changed and where to start investigating.
d. LLM Observability and Request Tracing
For LLM-powered applications, this workflow extends to end-to-end request tracing. Engineers can follow requests across LLM pipelines, see where time is spent, and understand how downstream dependencies affect performance. Dashboards answer the question of what is happening, while traces explain why it is happening.
LLM issues rarely fail loudly, they fail silently. Learn how to trace, monitor, and optimize LLM pipelines.
👉 Explore LLM Observability →
Instrumentation is supported through OpenTelemetry- compatible tools such as Traceloop and OpenLIT, covering providers including OpenAI, Anthropic, Bedrock, and Cohere.
e. Log-Based Anomaly Detection
Logs are incorporated into the same investigation flow. Middleware highlights unusual changes in log volume, structure, or error frequency. These signals may prompt deeper operational or security review, but they are presented as observability data rather than attack detections.
Want to sharpen your log filtering skills? Read How to Search Logs Effectively With Log Management.
f. Automated Remediation with OpsAI
When correlated signals meet predefined conditions, OpsAI can trigger automated remediation workflows. For example, sustained GPU memory pressure, combined with trace-level slowdowns, can trigger a rolling restart of model-serving pods or scale inference capacity.
OpsAI copilots summarize incidents, explain likely causes based on observed signals, and guide response actions, reducing manual troubleshooting time.
Learn how OpsAI transforms observability workflows.
How this Works in an End-to-End Production System
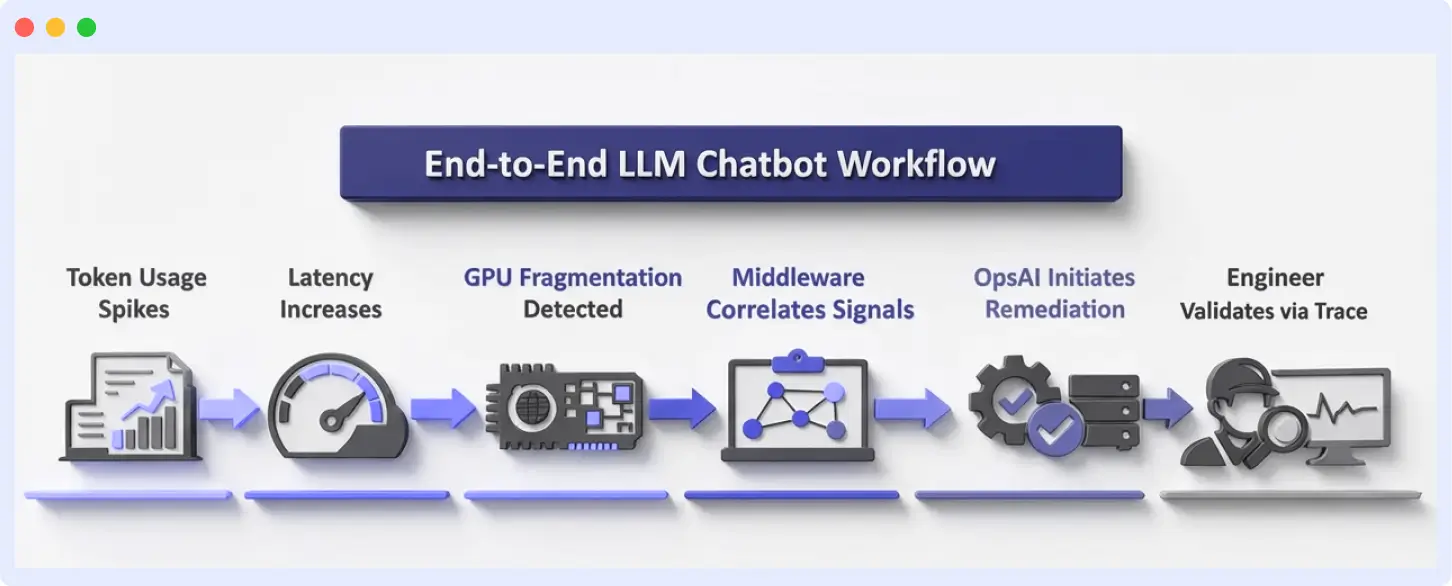
Consider a customer support chatbot running in production, backed by a RAG (Retrieval-Augmented Generation) pipeline and GPU-based inference. This example shows how Middleware moves from detection to automated resolution in a real production environment.
- Token usage spikes
A new prompt template increases context size by retrieving additional documents. Middleware traces show a steady rise in token utilization per request.
2. Latency increases
As token counts grow, inference latency begins to rise. Middleware detects deviations from the established baseline response times.
3. GPU memory fragmentation detected
GPU memory usage remains high even when utilization drops between requests. Instead of treating this as a standalone infrastructure signal, Middleware correlates memory pressure with trace-level latency slowdowns.
4. Signal correlation narrows the investigation to the likely root cause
Rather than triggering separate alerts for latency, memory, and token usage, Middleware correlates all three signals into a single incident. The combined view points to prompt expansion and inefficient GPU memory cleanup as the underlying cause.
5. Automated remediation with OpsAI
Based on correlated signals, OpsAI initiates a predefined remediation workflow, scaling inference replicas and rolling restarting affected pods to clear fragmented GPU memory.
6. The engineer validates via traces
An engineer reviews the full request trace, confirms token usage has normalized, and verifies that latency has returned to baseline without user impact.
Getting Started
Effective anomaly detection in AI models helps teams detect silent failures early and maintain reliability in production environments.
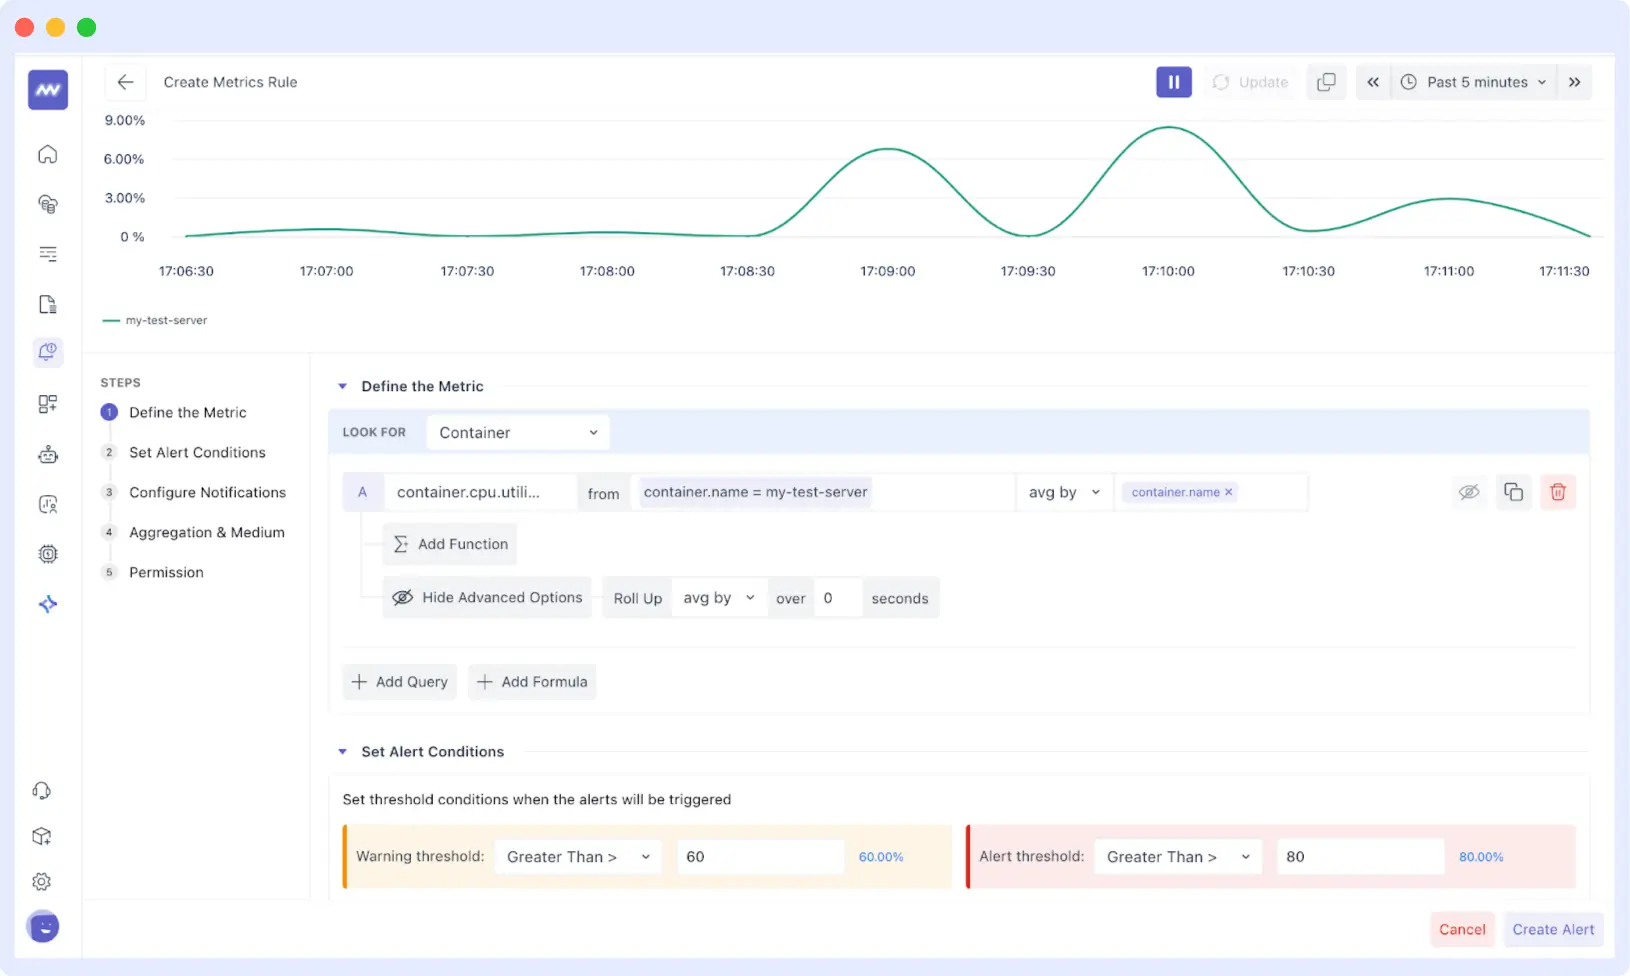
Connect your data sources, configure dashboards and alerts for AI-specific metrics, and define alert policies. Middleware provides intelligent defaults that work for most use cases.
Start monitoring with Middleware:
- Install the Middleware agent – Takes under 10 minutes for containerized environments
- Configure your first anomaly alert – Start with prediction drift monitoring
- Enable LLM Observability – Automatic token tracking and cost monitoring
- Set up OpsAI automation – Automated incident response for common failure patterns
What is the difference between anomaly detection and model monitoring?
Model monitoring focuses on performance metrics such as accuracy or latency, while anomaly detection identifies unusual behavior patterns that may indicate drift, attacks, or system instability even before performance drops are measurable.
How often should anomaly detection run in production AI systems?
In production environments, anomaly detection should run continuously in near-real-time. Delayed or batch-based detection increases the risk of prolonged incorrect predictions and user impact.
Can observability tools replace MLOps platforms?
No. Observability platforms complement MLOps tools. While MLOps focuses on training, validation, and deployment, observability provides real-time visibility into how models behave in production.


