Nothing frustrates users more than running into a problem while using your app. It’s even worse when your team has no idea of this problem until users start complaining. That’s a clear sign of gaps in your monitoring.
You should conduct synthetic monitoring to simulate user journeys and distributed tracing to gain deep visibility into what’s happening within your services. Both are powerful, but when used alone, they might miss some vital things. Synthetic monitoring can tell you that something is broken, but not why. Tracing shows where the problem is, but only after an actual request is made.
This is where you need Middleware. Middleware provides a simplified way of using both synthetic monitoring and distributed tracing together. You will be able to spot issues before they affect users and understand their root causes. You can solve problems faster and give your clients a great experience by doing this.
How Synthetic Monitoring and Distributed Tracing Work Together
Siloed monitoring can make teamwork harder. One tool will be used to show that something is broken, another to point to a possible cause, and another to hold the logs you need to confirm the issue. Jumping between these tools can be time-consuming and even lead to errors.
Now you can see why unified monitoring is so important. When synthetic tests, traces, logs, and metrics are brought together in one place, teams can instantly see both the problem and the root cause.
Distributed tracing will track every request in the system to identify where and why problems occurred, while synthetic monitoring will monitor user paths to detect issues. The end product is great when these two operate together. Things get fixed faster, people miss fewer events, and users have a better time.
Implementing Unified Monitoring from Setup to Detection with Middleware
Implementing unified monitoring with Middleware is simple and fits smoothly into your current workflow. It helps you gain clear insights and resolve issues more quickly through practical features designed to work together on a single platform.
👉 Learn how to fix performance issues and optimize your application performance.
Here’s a step-by-step guide that shows how Middleware supports the entire process from setup to incident detection.
1. Set Up Synthetic Monitoring
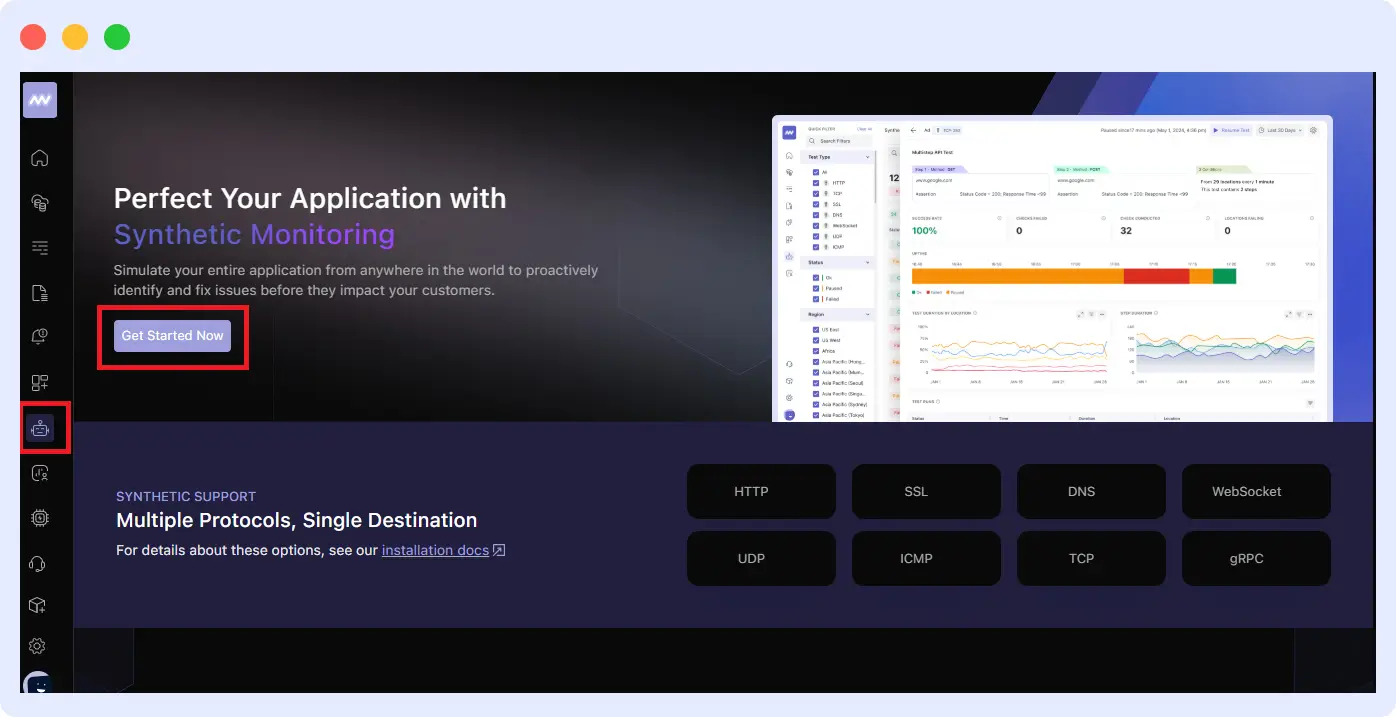
Go to your Middleware dashboard and navigate to the Synthetic Monitoring section. Click Get Started Now to create your first synthetic monitor. Middleware supports multiple protocols, including HTTP, SSL, DNS, TCP, WebSocket, and gRPC, letting you test a wide variety of critical endpoints.
When creating a monitor, fill in details such as:
- Name and Environment: Choose a descriptive name and assign it to your environment (Production, Stage, Dev). Organizing monitors by environment cleanly separates test scopes.
- Tagging: Apply tags to group related monitors for easier filtering and reporting.
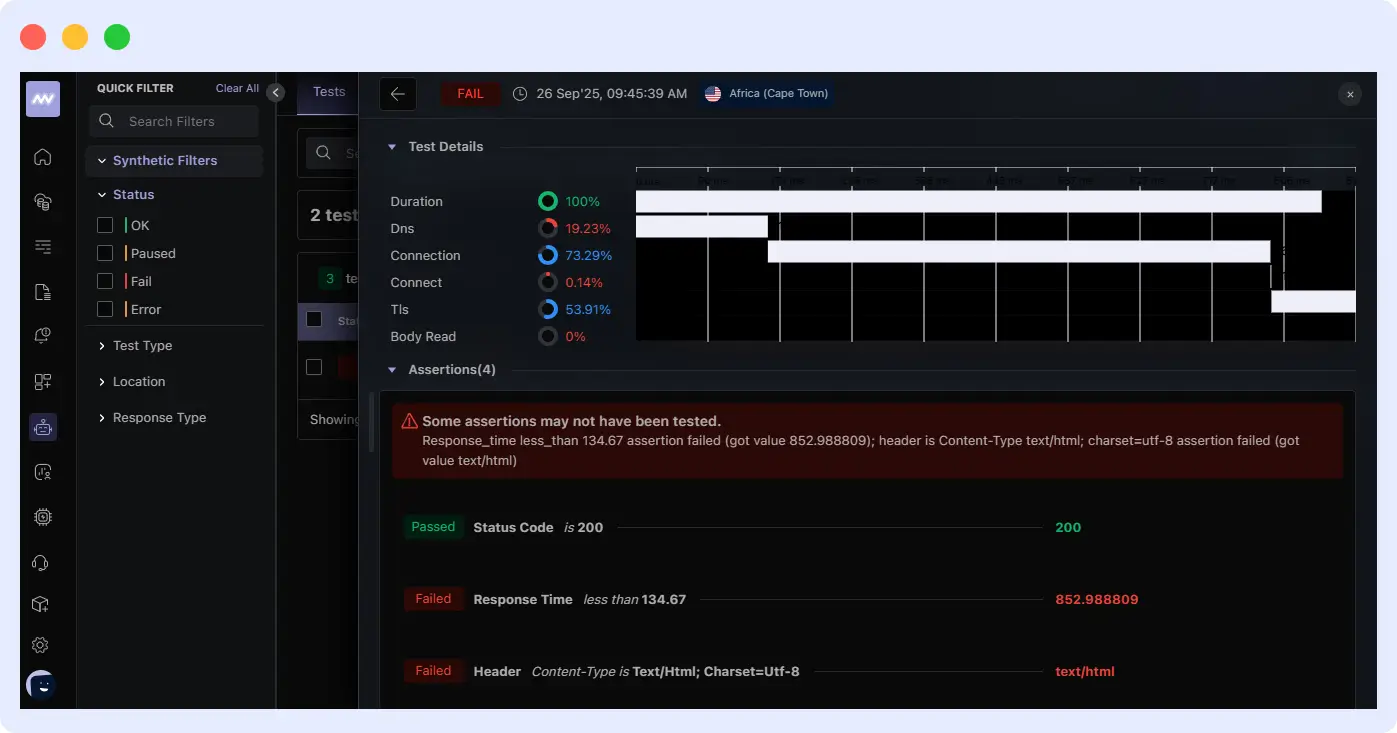
- Test Configuration: Select the request type and method (GET, POST, etc.), and, if needed, authentication headers, then configure assertions to validate responses.
- Test Locations: Middleware allows you to test from several locations to see geographic performance differences.
- Alert Settings: Set response-time, status-code, or error-rate criteria to trigger email, Slack messages, or other alerts.
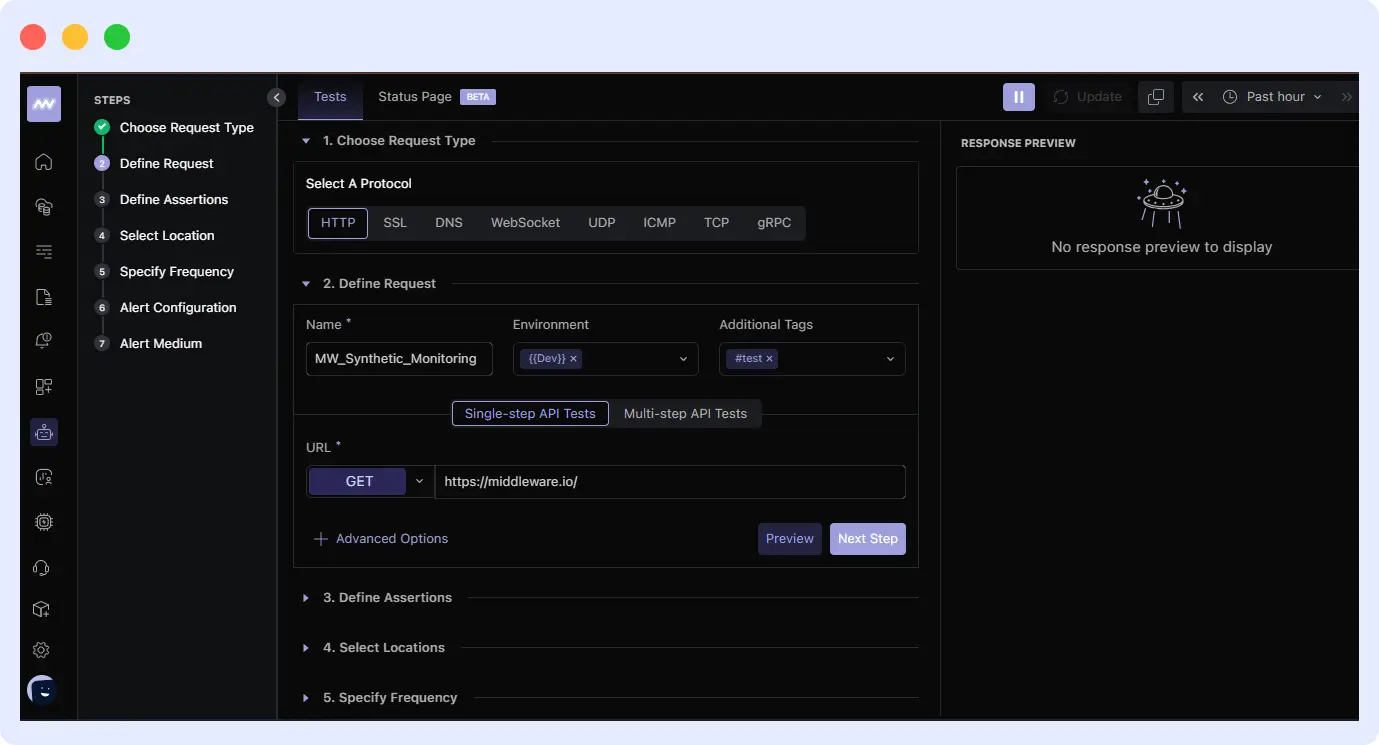
You can also create multi-step synthetic tests, chaining API calls and using earlier responses as inputs for subsequent steps. This is essential for monitoring complex workflows, such as login sequences or checkout processes.
2. Combining Synthetic Monitoring with Distributed Tracing
Middleware automatically links synthetic test failures to relevant distributed traces without extra effort. When a synthetic test alerts you about a poor performance or failure, Middleware points directly to the trace data showing the root cause, whether it’s a slow database query, a misconfigured service, or network latency.
This integration offers:
- Contextual Insights: Instead of separate logs or dashboards, you see a connected view of external tests and internal request flows.
- Faster Root Cause Identification: With traces linked to synthetic failures, engineers can drill down immediately into problematic services, eliminating the need for lengthy manual processes.
- Reduced Alert Fatigue: Middleware filters and correlates alerts to reduce alert fatigue, ensuring teams focus on actionable issues that impact the actual user experience.
Let’s assume you’re monitoring a login flow. One day, a synthetic test in Europe fails due to a timeout. Usually, you’ll have no clue how to explain that there are multiple complaints from users in that region. However, Middleware can immediately link the failure to a trace, showing that the authentication service caused the delay, or perhaps indicating that it’s something else.
With Middleware, your team doesn’t waste hours guessing. Problems will be solved in minutes before they affect other parts of the app.
Why Use Middleware to Unify Synthetic Monitoring and Distributed Tracing?
Synthetic monitoring and distributed tracing with distinct tools might lead to errors, higher costs, and delayed incident response times. Middleware removes this burden by bringing these two approaches together into a single platform, enabling teams to detect and resolve issues faster with less complexity.
Here are some key features Middleware offers:
- Unified Dashboard: There’s no need to jump between tools. Middleware centralizes user journeys, backend services, and performance analytics.
- Scalable for Modern Architecture: Whether you’re running microservices, Kubernetes, or serverless apps, Middleware’s platform is built to handle complex, distributed systems without added overhead.
- Cost Efficiency: With Middleware, you’ll deliver a more reliable experience at lower cost. It reduces both tool sprawl and observability costs while still providing deep visibility.
- Real-Time Alerts: Your team will receive alerts in advance with synthetic test results and trace details to identify problems and their causes.
- AI-Powered Insights: Middleware filters noise and prioritizes issues to discover anomalies, predict incidents, and lower observability costs using AI and machine learning. Your team can focus on what matters with faster root cause analysis and better alerts.
Middleware integrates synthetic testing, tracing, and logs into one platform, unlike regular monitoring stacks. That means fewer licenses, lower expenses, and less time spent switching dashboards, while increasing visibility.
Unified Monitoring Use Cases with Middleware
Combining synthetic monitoring and distributed tracing with Middleware offers clear, practical benefits. Middleware’s integration not only helps detect issues but also provides fast, precise insights, allowing teams to act quickly without switching between tools.
Here’s how Middleware uniquely supports important real-world workflows:
1. Proactive Root Cause Analysis
In complex enterprise systems, performance issues rarely come from a single page or endpoint; they mostly involve multi-service dependencies.
Imagine a financial services platform where synthetic tests flag that checkout transactions are timing out during peak usage. That alone tells you something is broken, but it doesn’t explain where the problem is coming from.
With Middleware:
- The failed synthetic test highlights the affected transaction or user flow in the dashboard.
- Distributed traces help engineers analyze backend dependencies to see if the issue lies in the payment gateway API, a database query under heavy load, or network latency in a specific region.
- Middleware’s alerting system prioritizes only actionable incidents, reducing noise, false positives, and alert fatigue.
- Engineers skip the guesswork and can directly investigate the affected service or transaction instead of digging through logs or switching between tools.
Outcome: Middleware speeds up root cause discovery, reducing MTTR by 70%. It also helps you avoid SLA violations and revenue loss from unsuccessful transactions, improving user experience, avoiding downtime penalties, and customer trust.
Try setting up a multi-step synthetic test in Middleware to simulate end-to-end workflows, such as checkout or payments. ⚡ You’ll see how quickly Middleware links failures to traces and helps you identify the root cause. 🔍
2. Validating New Deployment in CI/CD
App releases often involve risks in the CI/CD pipeline. Even if all automated tests pass, code changes can disrupt checkout, payment processing, and user registration, incurring costly downtime and SLA violations. Poor visibility hides these issues until users report challenges.
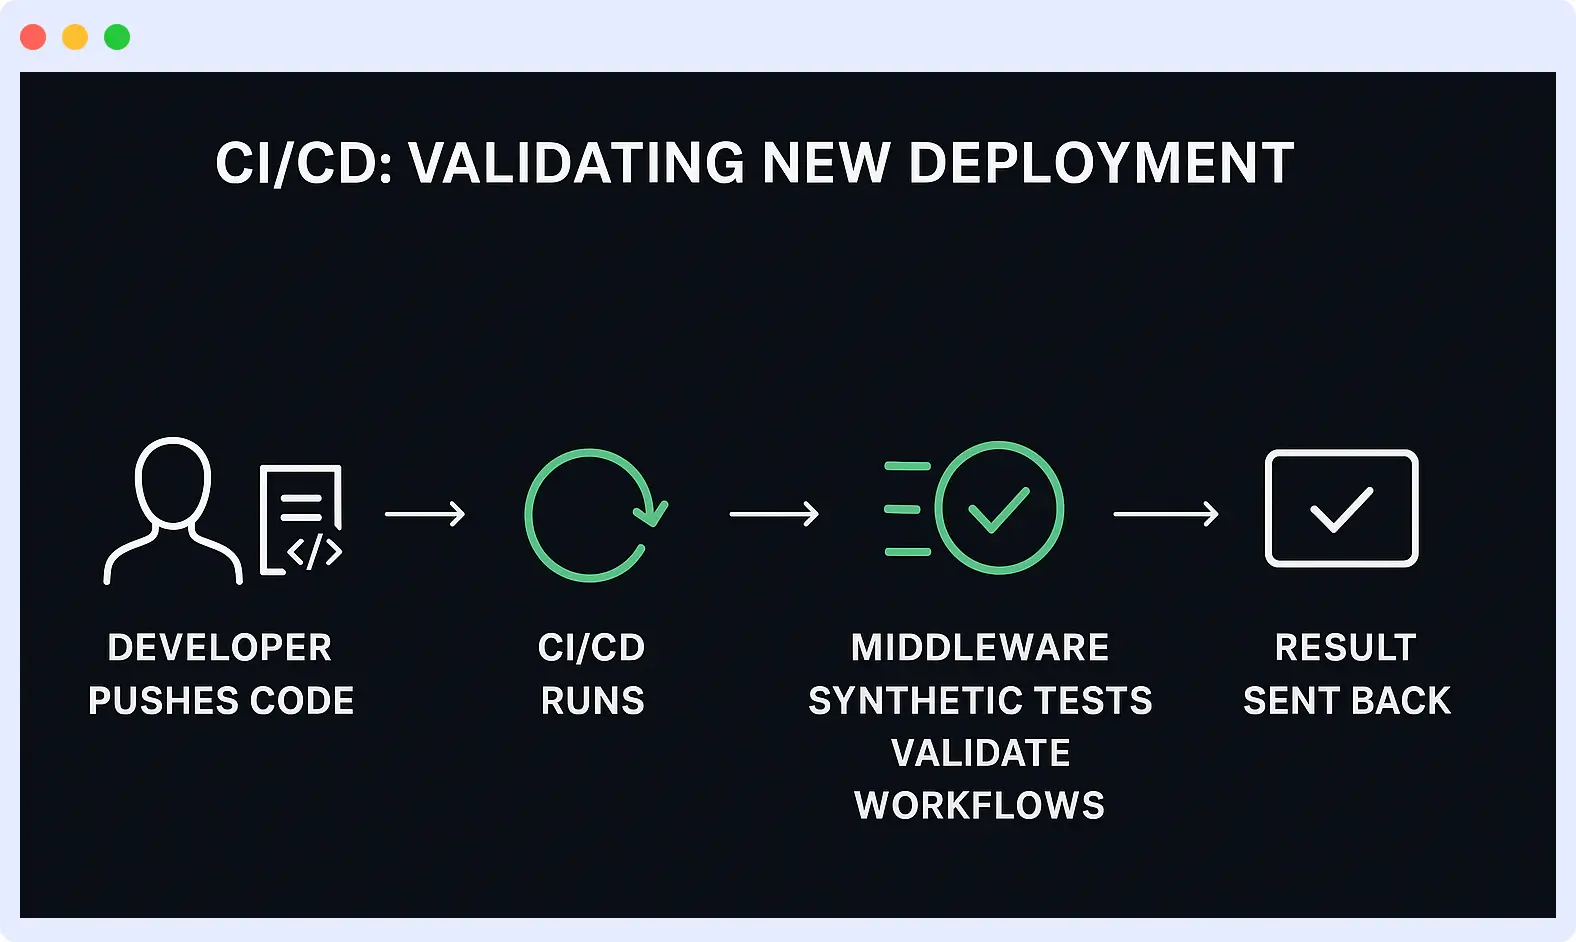
However, Middleware ensures every deployment is automatically validated before reaching users:
- Automated synthetic tests run immediately after deployment to validate key flows
- If a test fails, Middleware provides detailed visibility into which service, API, or recent code change caused the issue.
- Developers can roll back or patch immediately, preventing the bug from ever reaching all users.
Outcome: Middleware ensures broken features don’t reach production by catching issues during deployment. This reduces downtime and builds confidence in faster release cycles, keeping both your customers and developers happy.
⚙️Set up Middleware to automatically run synthetic tests after each CI/CD deployment. See how quickly it connects failed tests to the exact service or commit that caused the issue.
3. Optimizing Global User Experience
When your app serves a worldwide customer base, you shouldn’t always expect the same performance. Users in a particular region might be complaining about slow response time, while others are having no issues.
Without proper monitoring, you can’t tell if the problem is from your app, the regional service dependency, or the local network infrastructure.
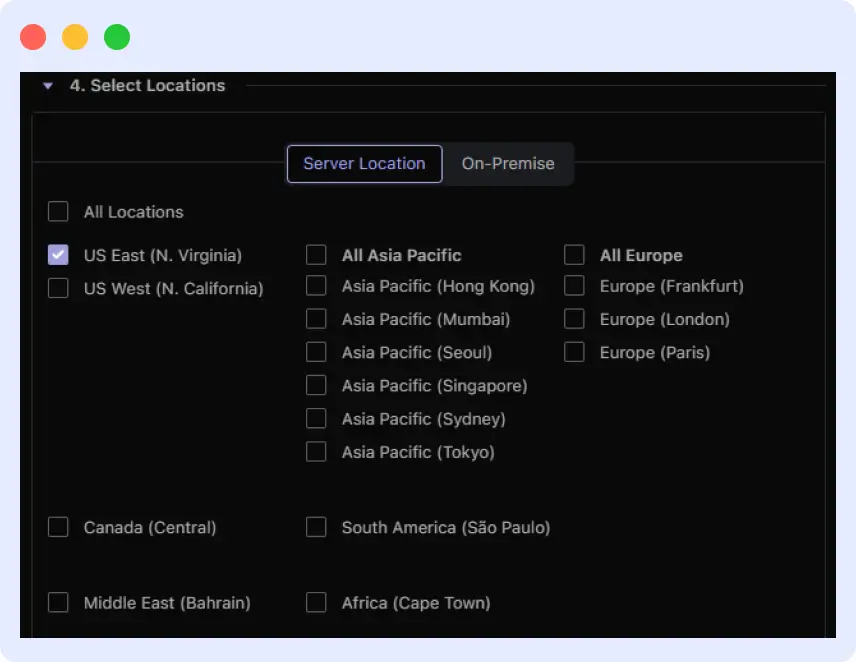
With Middleware, you don’t have to worry about global monitoring; it’s built in:
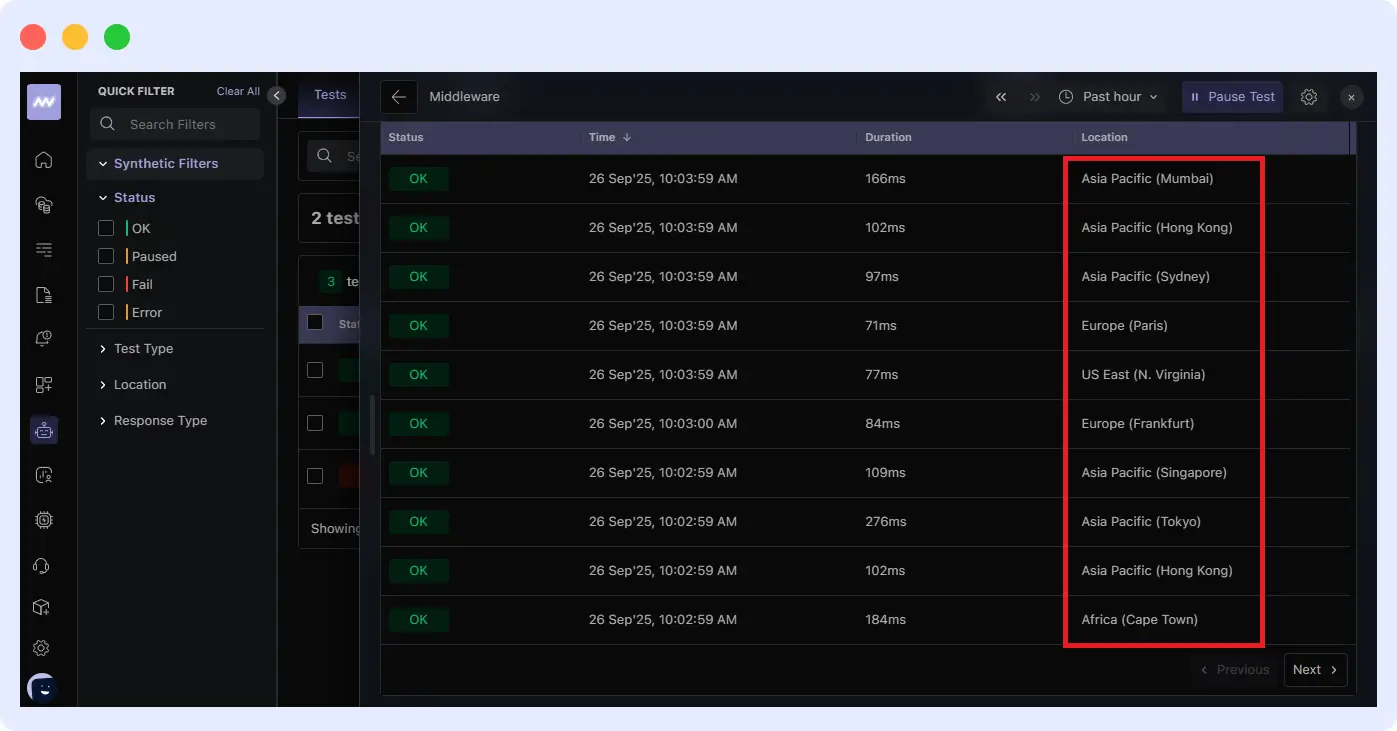
- Synthetic tests run from multiple worldwide locations, simulating real user journeys across regions.
- When an error appears, Middleware highlights the affected region or flow, helping teams quickly identify performance issues.
- Distributed traces provide additional context to analyze backend behavior and pinpoint the root cause of failures.
- This unified visibility allows teams to respond quickly and accurately, targeting only the affected region instead of deploying broad, unnecessary fixes.
Outcome: Middleware enables faster resolution of region-specific issues, ensuring consistent performance for users everywhere. This not only boosts customer satisfaction but also helps maintain SLA commitments, protect revenue from international markets, and support global business growth.
🌐Set up Middleware synthetic monitoring across multiple regions to proactively catch and resolve regional performance issues before they impact global customers.
4. Testing API and Third-party Dependencies
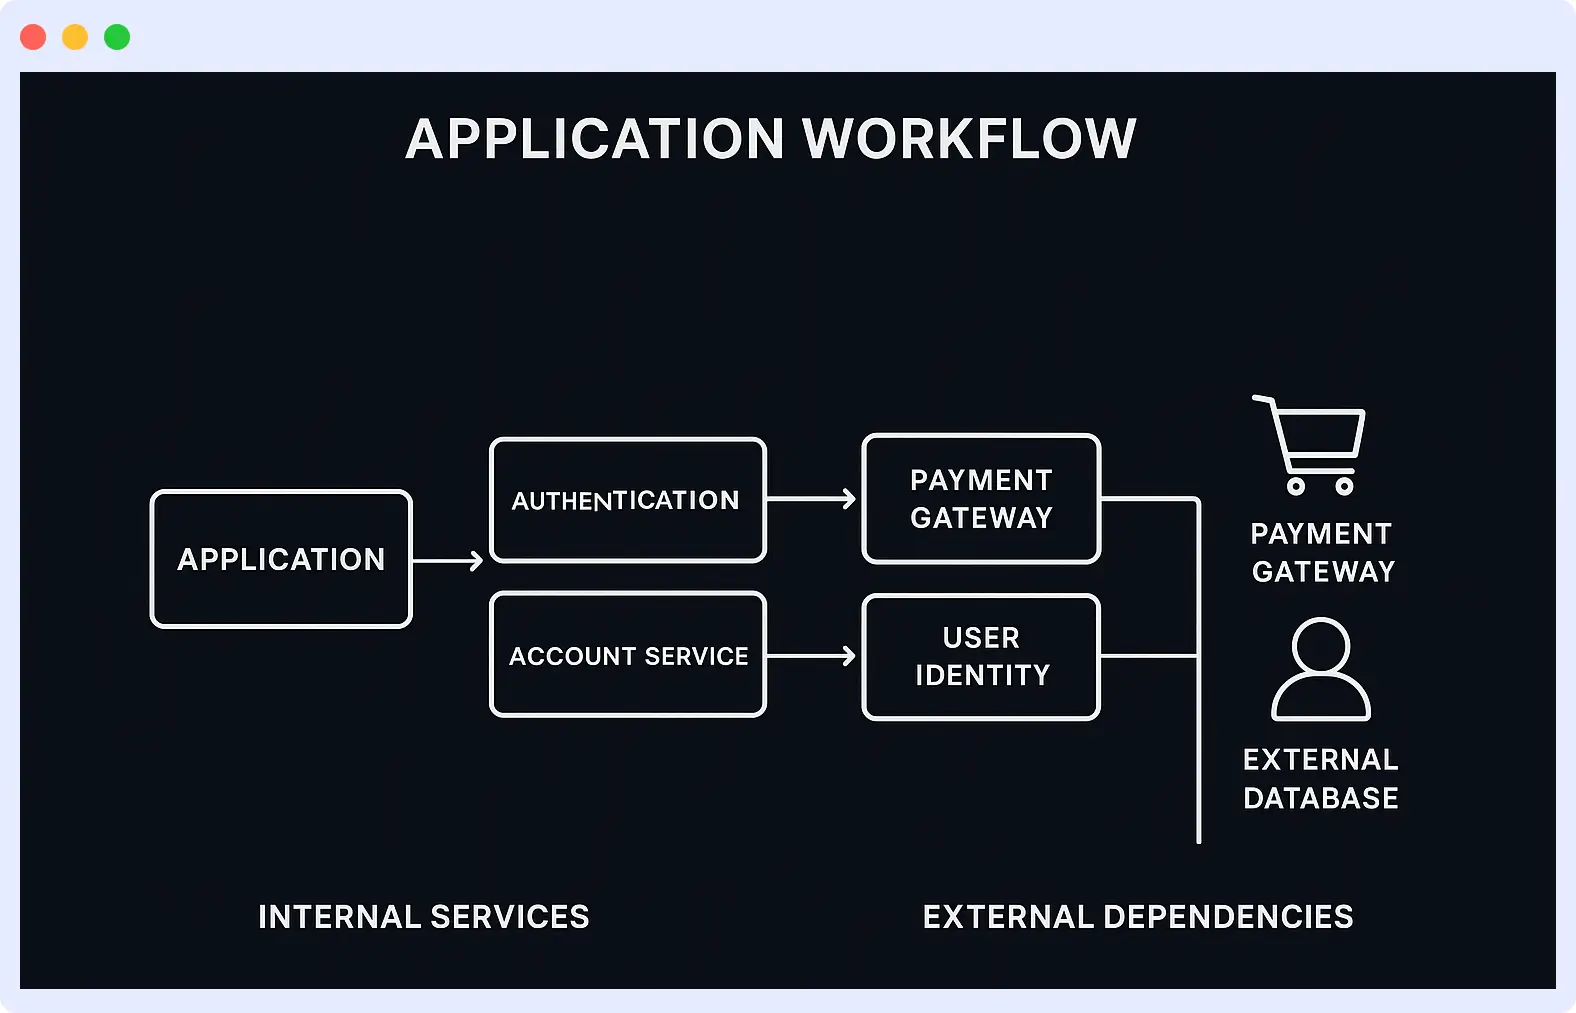
Modern applications depend on third-party services such as payment processors, authentication providers, and external databases. A single interruption in one of these services can spread across your entire app.
The challenge is that internal monitoring often shows everything is fine, while users are still hitting errors in different parts.
With Middleware, all these are covered:
- Synthetic monitors validate critical flows externally, testing them as a real user would.
- Distributed traces instantly reveal the source of an issue, whether it’s your code or a failing third-party API.
- Alerts confirm the problem’s origin, so your team avoids wasting time debugging the wrong system.
Outcome: Monitoring and tracing protect essential user flows, such as payments and logins, by tracking external dependencies. This lowers the chance of failed transactions, angry consumers, SLA penalties, and brand damage.
🔍Set up Middleware to run synthetic tests against your third-party APIs. When a dependency fails, you’ll instantly see whether it’s your system or the vendor causing the problem.
Ready for Proactive Incident Detection?
Don’t wait for users to complain before fixing issues. With Middleware, you can unify synthetic monitoring and distributed tracing to detect problems early, identify root causes instantly, and keep your systems reliable.
See how Middleware helps you cut MTTR by up to 70% and reduce downtime costs. Get started today and experience unified monitoring in action.
FAQs
What is proactive incident detection?
Proactive incident detection finds and fixes problems before users discover them. Instead of waiting for complaints, teams employ tools to identify and fix issues quickly.
How do synthetic monitoring and distributed tracing work together?
Synthetic monitoring runs tests to verify that apps work, while distributed tracing traces requests within the system. Together, they give a full view, helping spot where and why problems happen.
How can Middleware reduce MTTR?
Middleware reduces Mean Time to Repair (MTTR) by integrating synthetic monitoring with tracing in a single platform. This lets teams quickly find the exact cause of issues and fix them faster.
Can unified monitoring help prevent outages?
Yes. Unified monitoring combines different data to detect issues early. This early warning helps stop outages before they happen.


