TL;DR
- OpenTelemetry is the default choice for observability, but getting it fully configured across a real infrastructure can take two to three sprints.
- Middleware’s auto-discovery agent detects every application and database running across your entire host fleet in minutes no manual inventory.
- Zero-code instrumentation lets you instrument selected services without touching your codebase, using a single CLI command.
- Filtering traces, enabling Journald log collection, and tagging logs by environment are all handled through the Middleware UI — no YAML editing required.
- Everything Middleware collects is pure OpenTelemetry data. It can be routed to any OTEL-compatible backend including Jaeger or Zipkin.
- Engineering teams go from zero visibility to full observability coverage in hours, not weeks.
If you are planning to set up observability for your infrastructure and applications, OpenTelemetry is almost always the right starting point.
Two reasons make it the default:
- It is an open standard with broad support across every major observability vendor.
- It ships with a mature ecosystem of ready-to-use tooling: SDKs, the OpenTelemetry Collector, the OpenTelemetry Operator, and more.
In practice, we see two distinct types of engineering teams when they come to Middleware to discuss their observability needs.
Teams new to observability or OpenTelemetry: they need structure, sensible defaults, and a fast path to coverage without deep expertise in OTEL configuration.
Platform teams already fluent in OpenTelemetry: they arrive with their own setup and want to plug into Middleware for prompt-based dashboarding, proactive alerting, AI-powered auto-fixes via OpsAI, data retention, RBAC, anomaly detection, and the ability to make instant sense of the telemetry data they have already collected.
This post focuses on the first group. Part2 covers how Middleware serves as an OpenTelemetry-native backend for teams who are already running their own collector pipelines.
What engineering teams actually want from observability
Strip away the tooling conversation, and most engineering teams have the same four goals:
- Maximum application uptime so SLAs are met.
- Alerts the moment something breaks before users notice.
- A fast path to root cause for issues that are not in the runbook.
- A setup process that does not consume weeks of sprint capacity.
The fourth point is where most observability implementations fall apart. A real-world infrastructure, a mix of AWS EC2 instances, a Kubernetes cluster on GCP, self-hosted databases, and a managed MongoDB Atlas deployment, can easily require two to three sprints just to instrument properly. That is before anyone looks at a single dashboard.
The fastest way to set up OpenTelemetry observability without spending weeks on configuration is to use a platform that handles infrastructure discovery, application instrumentation, and collector configuration automatically.
Middleware does this through three mechanisms auto-discovery, zero-code instrumentation, and UI-based collector controls each removing a distinct layer of manual YAML and scripting work. A team with no prior OpenTelemetry setup can go from zero visibility to full observability coverage in hours rather than sprints. For a broader primer on what observability means, see our full guide.
Auto-discovery: surface every component in minutes
Consider a fleet of 15 EC2 machines. Across those machines, you might have:
- Java Spring Boot applications running as systemd services
- MySQL databases handling user profile data
- Python applications running inside Docker containers
- Some machines are running all of the above
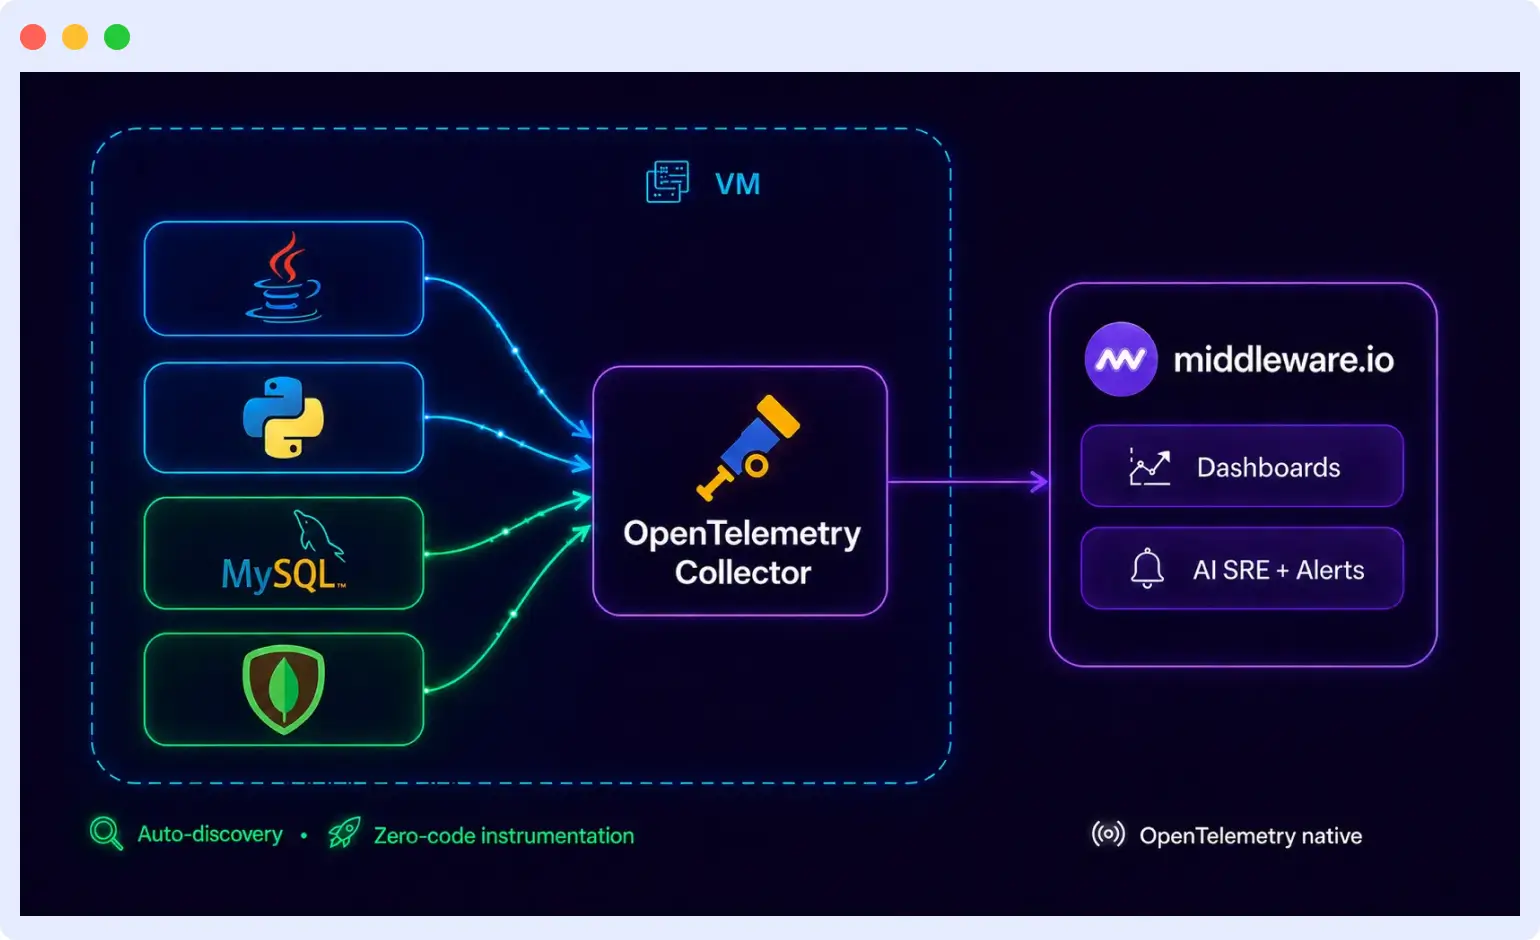
Auto-discovery in an observability platform works by installing an agent on each host that scans for running processes, services, and databases automatically no manually maintained inventory required. Middleware deploys this agent across all hosts at once via a one-shot install script. Once the agent is running, it detects every application and database on each host and surfaces the full list in the Middleware UI.
A five-minute script replaces what would otherwise be a manual discovery exercise spread across multiple team members and days.
The agent uses a combination of the OpenTelemetry Collector, zero-code instrumentation tooling, and intelligent detection of services by reading process metadata from /proc files. The output is standard OpenTelemetry data it can be routed to Middleware or to any OpenTelemetry-compatible backend including Jaeger or Zipkin.
Zero-code instrumentation: instrument what matters, skip what doesn’t
Discovering everything running on your infrastructure does not mean you need to instrument all of it at once. Priority matters.
Say the agent finds 12 applications on your first EC2 machine. Seven of them run your critical production services. The workflow is straightforward:
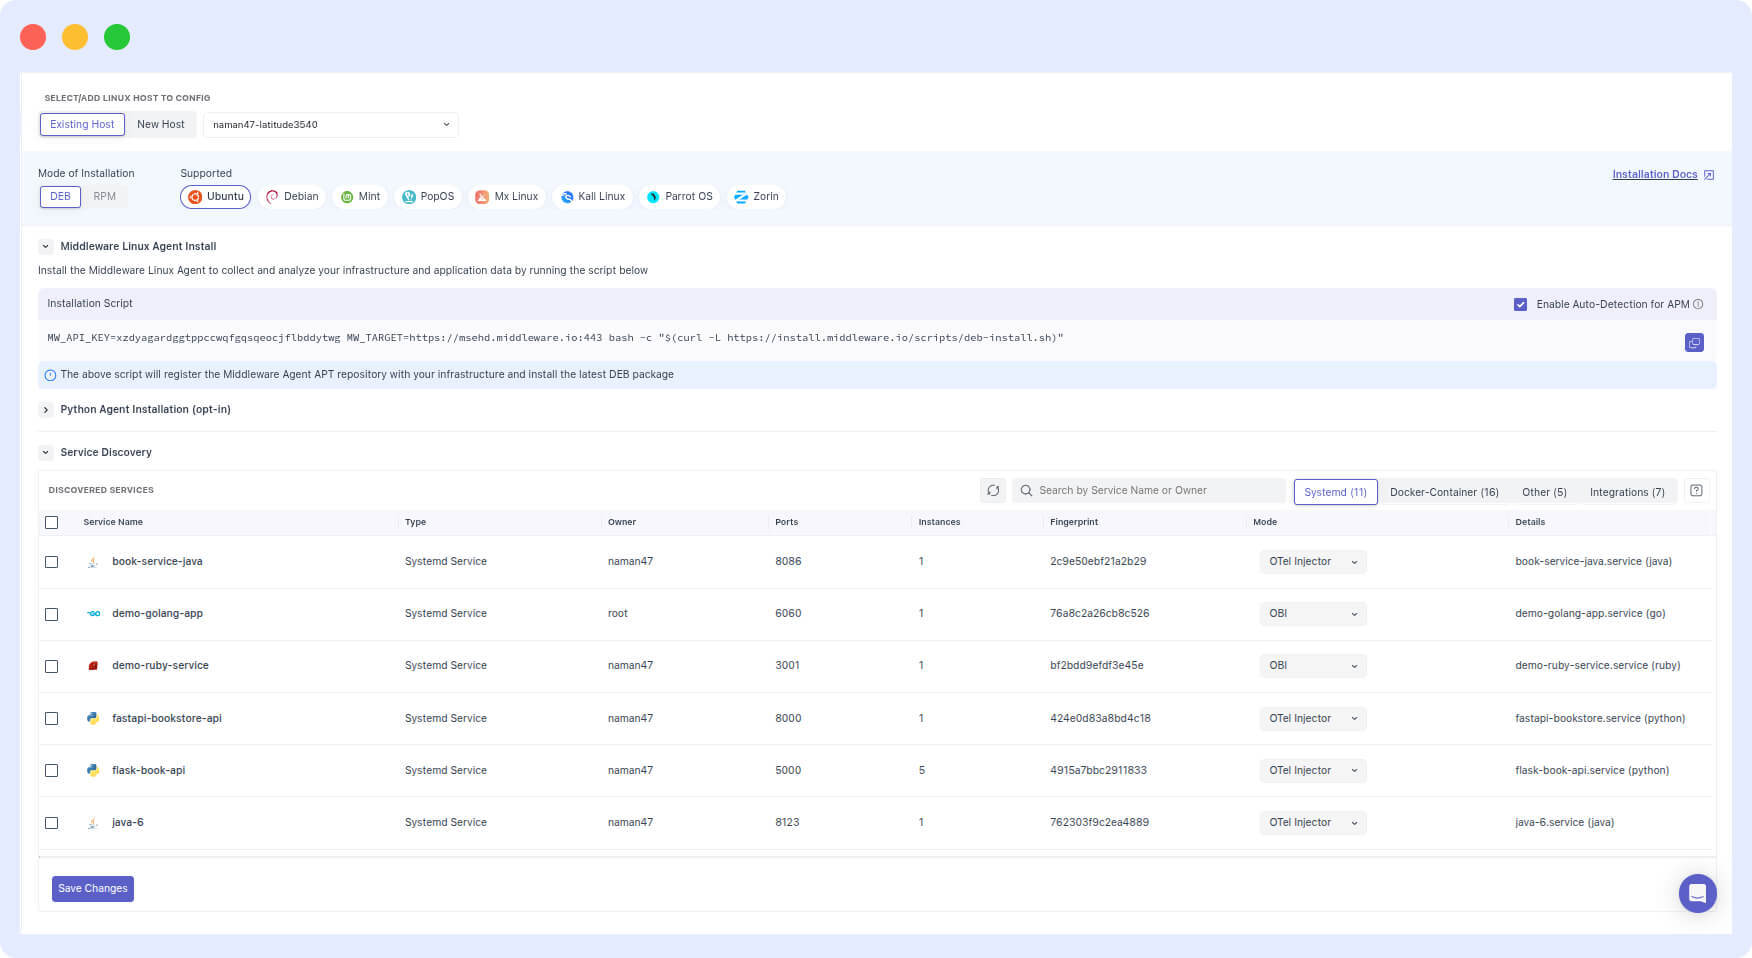
- Select those seven services in the Middleware UI.
- Save.
- Run the CLI command Middleware generates.
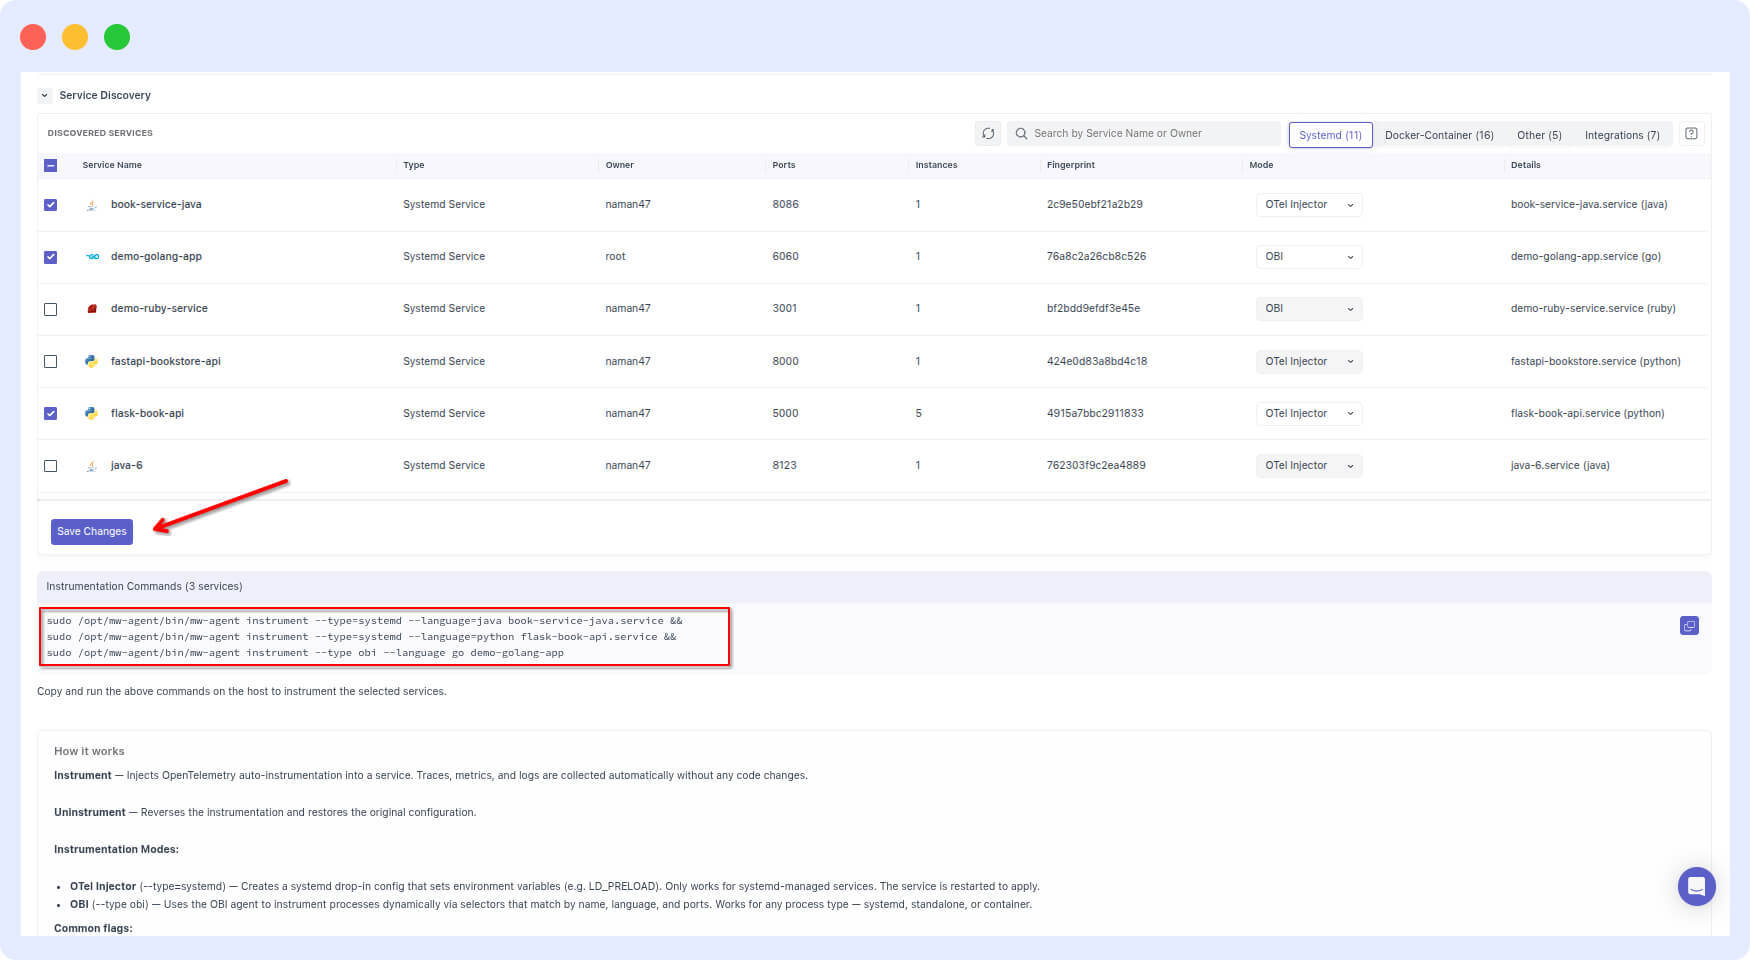
Your seven services are now instrumented. No changes to your codebase. No manual OpenTelemetry SDK integration. The same approach works across EC2, ECS, Kubernetes, Lambda, Cloud Run, and Windows IIS.
What is zero-code instrumentation in OpenTelemetry?
Zero-code instrumentation is the ability to add observability to an application, capturing traces, metrics, and logs without modifying the application’s source code. It works by attaching OpenTelemetry auto-instrumentation libraries and eBPF hooks at the process level rather than the code level.
The fastest way to instrument applications without changing code is to use an agent that handles this automatically: Middleware bundles the OpenTelemetry Collector, zero-code instrumentation libraries, and eBPF tooling into a single install, then wires everything to the collector for you. The data produced is identical to what you would get from manually integrating the OpenTelemetry SDK no trade-off in data quality.
Configuration without YAML
Once instrumentation is running, engineering teams typically have a short list of refinements:
- “Half of the traces in your system are health check calls from our queue service. We do not need those.”
- “You are reading logs from
/var/logbut our application logs go to Journald.” - “Our staging and production logs share the same service name. We need to separate them.”
In native OpenTelemetry, each of these requires editing otel-config.yaml directly. Here is how each configuration works and what it looks like in practice:
How do you filter health check traces in OpenTelemetry Collector? Use the filterprocessor to drop spans where the route matches your health check paths. This prevents noise from internal liveness and readiness probes from filling your trace storage:
yaml
processors:
  filter/drop_healthchecks:
    error_mode: ignore
    traces:
      span:
        - 'attributes["http.route"] == "/health"'
        - 'attributes["http.route"] == "/ready"'
        - 'attributes["http.target"] == "/health"'
        - 'attributes["url.path"] == "/health"'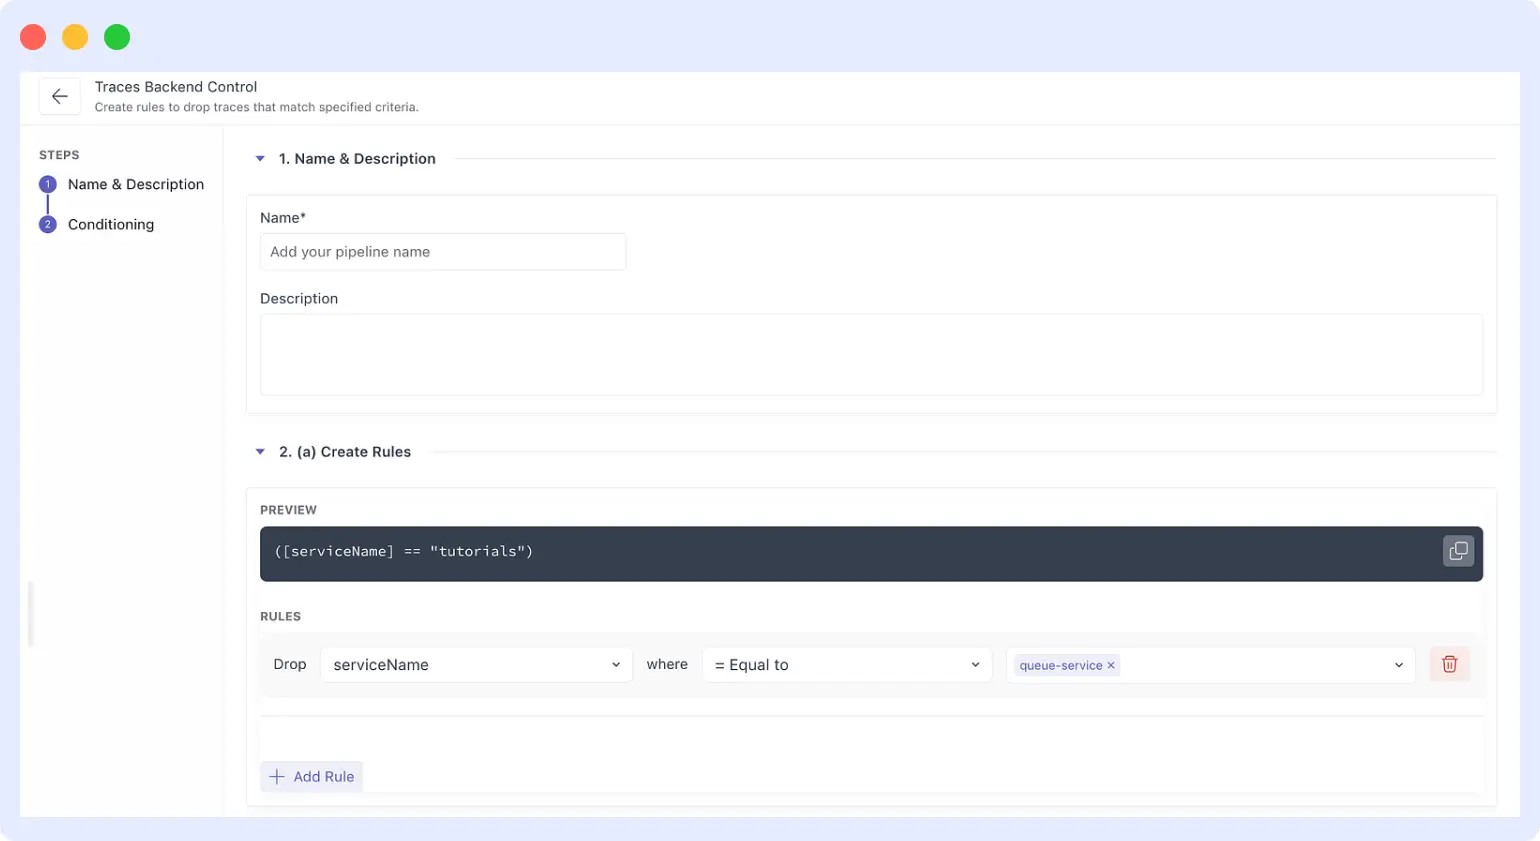
How do you collect Journald logs with OpenTelemetry? Add it journaldreceiver to your collector config, pointing it at the journal directory and specifying which systemd units to read from. This replaces file-based log scraping for services that write to the system journal rather than a log file:
yaml
receivers:
  journald:
    directory: /var/log/journal
    units:
      - nginx.service
      - docker.service
    priority: info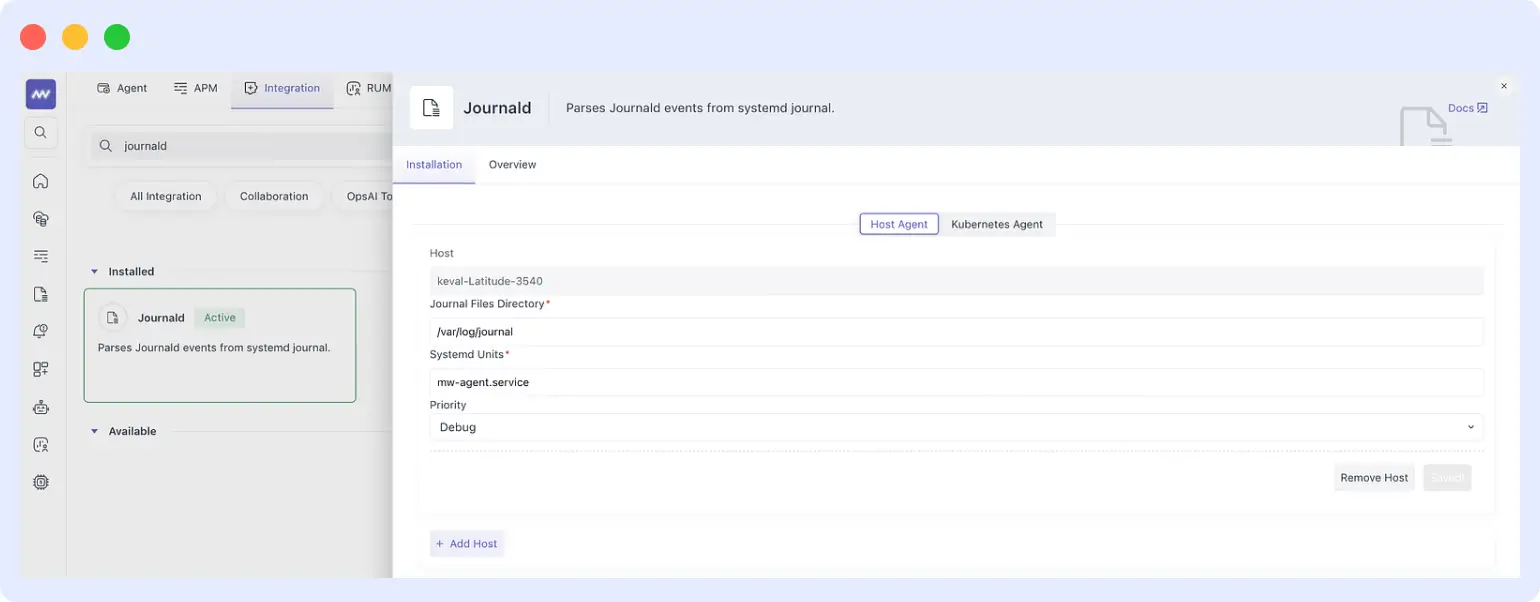
How do you separate staging and production logs in OpenTelemetry? Use the attributeprocessor to inject a deployment.environment attribute on every log record. This lets you filter by environment in your observability backend without needing different collector pipelines per environment:
yaml
processors:
  attributes/environment:
    actions:
      - key: deployment.environment
        value: production
        action: upsert
These are standard patterns but learning them, testing them, and maintaining them takes time that most teams do not have.
Middleware surfaces all three as UI controls:
- Filter traces from a specific service: Middleware UI > Settings > Traces Backend Control > create a drop rule for the queue service (see screenshot).
- Enable Journald log collection: Middleware UI > Integrations > search “Journald” > configure journal directory, systemd units, and priority level (see screenshot).
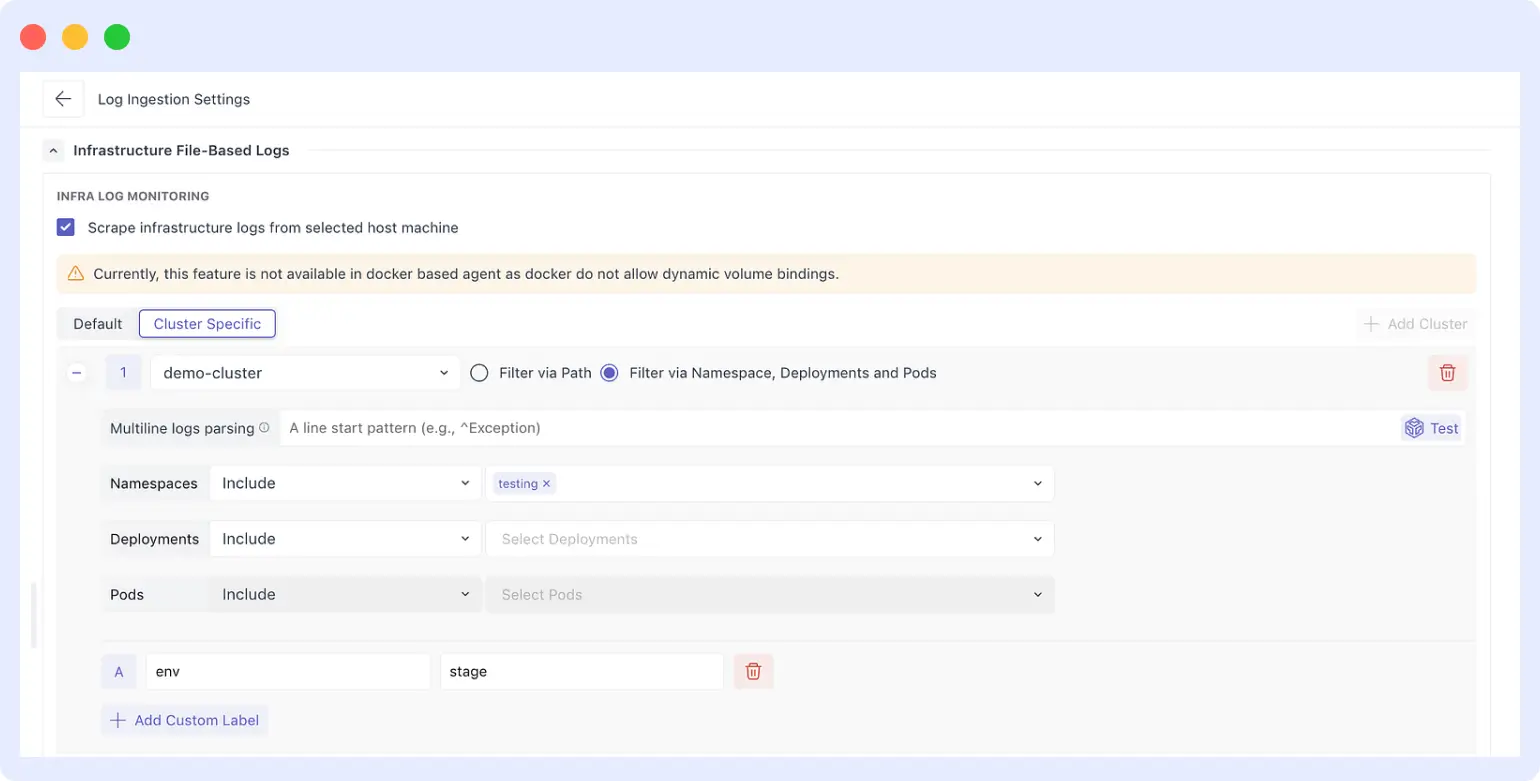
- Segregate logs by environment: Middleware UI > Log Ingestion Settings > add a custom label (
env: stageorenv: production) scoped to specific clusters, namespaces, or pods (see screenshot).
Behind every UI toggle, Middleware applies the corresponding OpenTelemetry processor configuration. The generated otel-config.yaml is always available to inspect a useful way to learn the underlying patterns without needing to write them from scratch under time pressure.
Summary: what Middleware does at each stage of OpenTelemetry setup
| Stage | Without Middleware | With Middleware |
|---|---|---|
| Infrastructure discovery | Manual audit across all hosts | Auto-discovery via one-shot agent install |
| Application instrumentation | SDK integration per service, per language | Zero-code instrumentation via CLI command |
| Collector configuration | Hand-editing otel-config.yaml | UI toggles that generate YAML automatically |
| Time to first signal | 2–3 sprints | Hours |
| Data format | OpenTelemetry | OpenTelemetry (identical output) |
The goal is not to abstract OpenTelemetry away, it is to remove setup friction so teams get immediate coverage and can go deeper into OTEL configuration at their own pace.
What comes next
In part 2, we cover what Middleware offers to platform teams who are already running OpenTelemetry: how Middleware acts as an observability backend that correlates metrics, traces, and logs to surface root cause automatically and how OpsAI investigates incidents for you so you do not have to start from scratch every time an alert fires.
If you want to see auto-discovery and zero-code instrumentation in action for your own infrastructure, start a free trial of Middleware or explore the documentation.
FAQs
How does Middleware auto-discovery work?
Middleware installs a lightweight agent on each host via a one-shot script. The agent uses eBPF-based detection alongside the OpenTelemetry Collector to identify every running application and database on that host — including processes inside Docker containers and systemd services. Results appear in the Middleware UI within minutes of install.
Does zero-code instrumentation require changes to my application code?
No. Middleware’s zero-code instrumentation works at the process level using OpenTelemetry’s auto-instrumentation libraries and eBPF hooks. You select the services you want to instrument in the Middleware UI, run the generated CLI command on the host, and instrumentation is applied without any code changes.
Is the observability data vendor-locked to Middleware?
No. All data collected by the Middleware agent is standard OpenTelemetry format — metrics, traces, and logs follow the OTLP protocol. You can route this data to any OpenTelemetry-compatible backend, including open-source tools like Jaeger and Zipkin.
What infrastructure types does Middleware support?
Middleware supports EC2 and other VMs, ECS, Kubernetes, AWS Lambda, Google Cloud Run, and Windows IIS servers. The auto-discovery and zero-code instrumentation workflow is consistent across all of these.
What happens to the OpenTelemetry Collector configuration when I use the Middleware UI?
Middleware generates and manages the otel-config.yaml on your behalf based on your UI settings. The file is always available for you to inspect, modify, or learn from. If you want to apply custom processor configurations that are not available in the UI, you can edit the YAML directly.
Related reading
- Kubernetes deployment: the misconfigurations that cause outages
- How we built an AI SRE agent that troubleshoots production issues
- Bring observability directly into your IDE with Middleware MCP Server