



Pointing a frontier model at your logs makes a great Friday demo. Running it against a real Sev1 at 3 am is a different problem entirely. There are broadly seven gaps that emerge when engineering teams build their own AI SRE agent: fragmented telemetry, Kubernetes opacity, shallow reasoning without an evidence chain, missing tribal knowledge, no evaluations, runaway token costs, and unsafe write access.
Those gaps combine into three failure patterns that quickly break trust. This piece walks through each one and explains why an observability-native agent like Middleware OpsAI closes them by starting at the data layer rather than the model.
Key takeaways
- DIY agents fail production RCA in eight distinct ways, from fragmented telemetry to unsafe write access.
- Fragmented tool access and Kubernetes’ ephemeral state are the two biggest blind spots for homegrown agents.
- Without a forced evidence chain, DIY agents anchor on the first plausible hypothesis and produce confident wrong answers.
- Building evals, model routing, and security scoping in-house typically costs $700K or more in year one, mostly in engineering headcount.
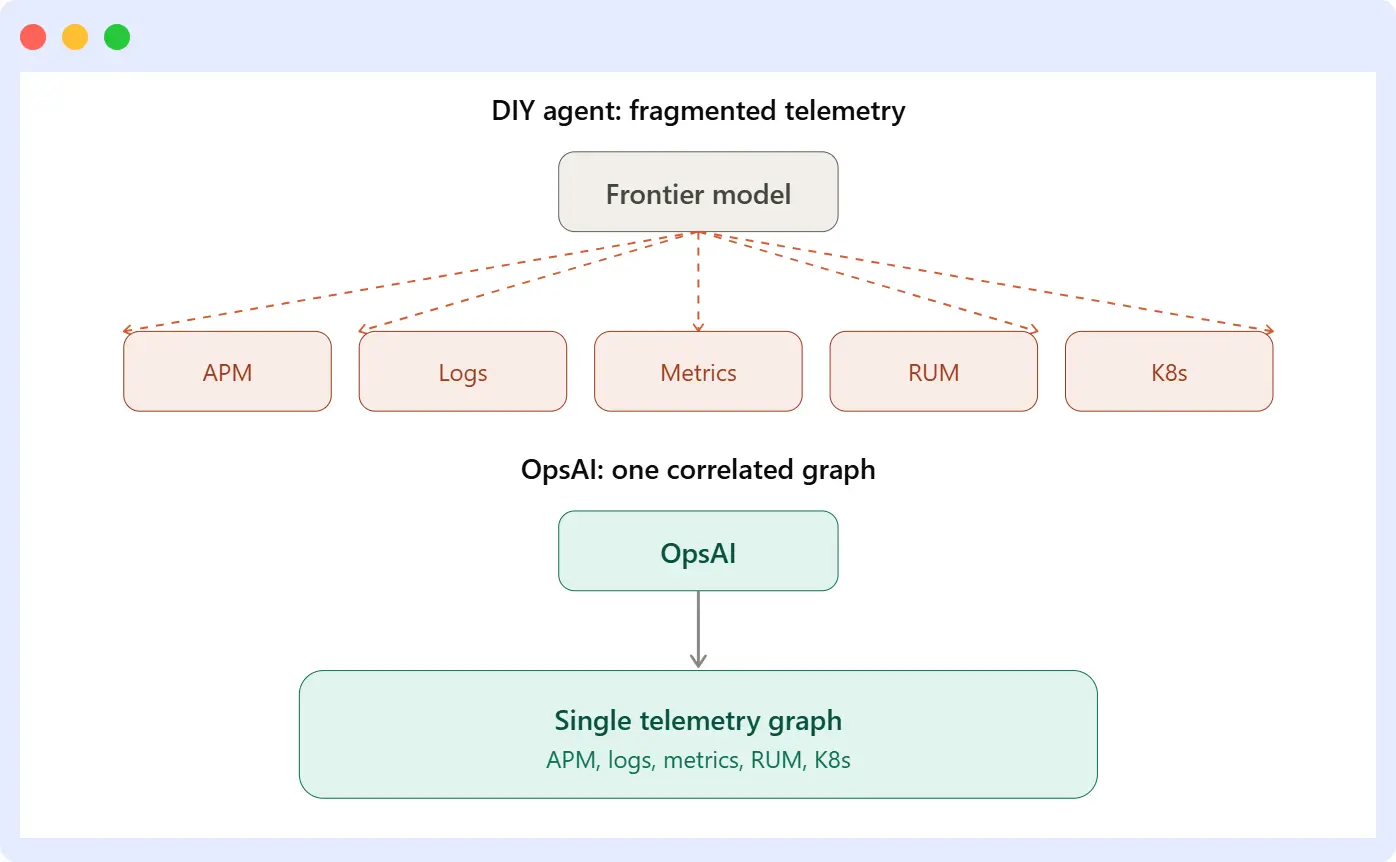
- OpsAI closes these gaps by reasoning over one correlated telemetry graph instead of stitching together five vendor tools.
Why AI is great at code and terrible at production
AI has quietly taken over how modern teams write code. The same models flounder the moment they touch production. This is not a matter of picking a bigger model or writing a sharper prompt. Production is a different problem from code.
Code cooperates. It is bounded; it documents itself through names and types, and the feedback loop is seconds long. Production is unbounded, stateful, and unforgiving. A wrong review comment costs a follow-up message. A wrong action during a Sev1 costs revenue, customer trust, and sometimes a second incident.
The 2026 data backs this up:
| What teams told us | Number |
|---|---|
| Want a human to approve AI actions before they run in production | 48.3% |
| Still need to manually debug AI-written code after it passes QA and staging | 43% |
| Need 2 to 3 redeploys just to confirm an AI fix actually works | 88% |
| Shipped a production incident caused by AI-written code in the last 90 days | 61% |
| Had to roll back AI code because unit tests missed the problem | 74.3% |
| AI code tasks that shipped with a known security flaw | 44% |
| Drop in delivery stability for every 25% rise in AI adoption | 7.2% |
At Middleware, we’ve watched hundreds of teams try to close that gap by wiring a frontier model to their logs and calling it an SRE agent. It works in a demo. It falls apart in a live incident. Below is where the wheels come off, and what an observability native agent has to do differently.
What makes production a different problem
Roughly 60 percent of on-call engineers‘ time goes into hunting for root causes across ten or more monitoring tools instead of building features. Modern microservices stacks throw thousands of alerts a week, and most incidents cross app, infra, database, and platform ownership before anyone finds the cause.
Code AI works because code is one domain with a fast, deterministic feedback loop. Production breaks four assumptions that made code AI look easy:
Telemetry is unbounded. A busy Kubernetes cluster emits more log volume in an hour than any context window will hold. Intelligence is knowing what to query, not stuffing more tokens into the prompt.
Investigations are stateful. What the agent learned at 2 am has to survive the 4 am handoff. So does the engineer who picks up the ticket.
Load-bearing knowledge is invisible. The batch job that spikes CPU on the 15th of the month. The service that quietly retries when one AZ blips. None of it is in a log line. It lives with the engineer who has been on rotation for two years.
Mistakes are asymmetric. A wrong triage sends a junior engineer down the wrong path for 40 minutes. A wrong action during remediation can extend the outage.
None of the four shows up in a weekend prototype where the sample size is one alert, and no one is watching.
The seven gaps in a DIY or In-house agent build
1. Fragmented telemetry with no unified data foundation
The first gap is not the model. It is the plumbing beneath it.
Most engineering orgs run APM in one tool, logs in another, infra metrics in a third, RUM in a fourth, and Kubernetes events in a fifth. A DIY or In-house custom agent has to hop across five APIs to piece together one incident, and every hop loses schema, timing, and correlation. The result is a model reasoning over five disconnected streams and hallucinating the joins between them.
An observable native agent starts from a single telemetry graph where logs, traces, metrics, and events share one timeline and one identity. When OpsAI investigates a spike, it does not ask “what happened?” across five vendors. It reads one correlated view. That was the whole point of the platform rebuild: the AI is only as good as the substrate it queries.
2. Kubernetes and cloud native opacity
Kubernetes is where most production incidents actually live in 2026, and it is also where DIY agents are weakest. The reason is not that Kubernetes is hard to query. It is that Kubernetes state is ephemeral, hierarchical, and event-driven, and a general-purpose LLM, handed a kubectl tool, captures none of that.
Three things break at once.
Ephemeral resources. A pod that OOMed twenty minutes ago is gone. Its logs, its labels, its resource limits, its parent deployment revision. All of it. A DIY agent that queries the live cluster state sees the healthy replacement pod and closes the ticket.
Multi-layer context. One K8s incident touches container, pod, deployment, node, namespace, and cluster at the same time. A DIY agent that pulls one layer at a time reasons over each in isolation and misses the resource contention or scheduling decision that actually caused the outage.
State is a timeline, not a snapshot. Ninety percent of K8s incidents live in the sequence of events, not the current state. Deploy at 14:02, HPA scaled up at 14:04, one node ran out of memory at 14:07, the kube scheduler evicted pods across three services at 14:08. A tool that returns the current state cannot reconstruct that.
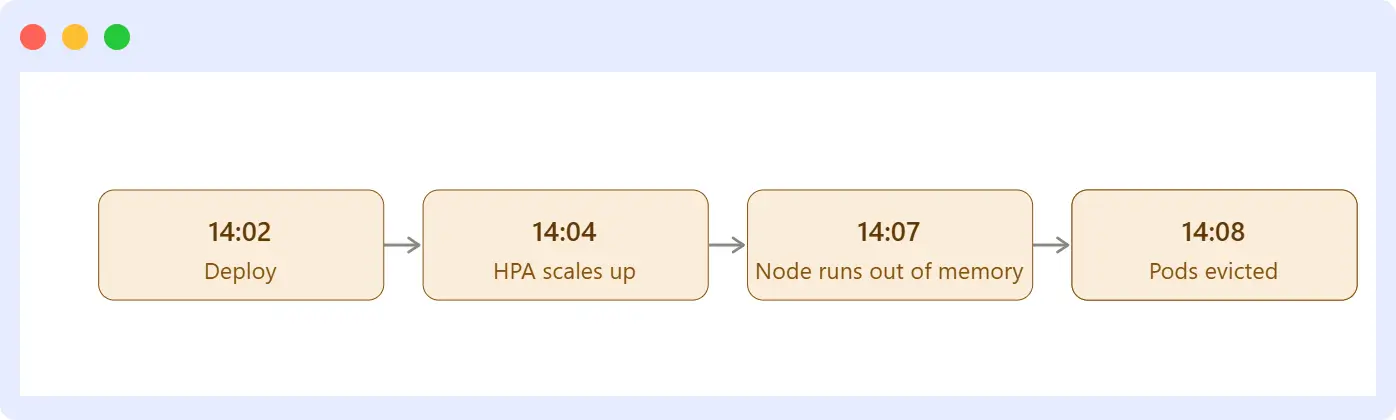
Closing this gap needs a K8s aware collector that captures pod, node, and deploy timelines continuously, and a reasoning layer that walks the sequence, not the snapshot. That is why we ship Kubernetes Ops AI as a first-class part of the platform: cluster overview dashboards, topology visualizations, deploy timelines, and RCA that treats Kubernetes as a stateful system, not a set of API endpoints. Auto RCA suggests fixes for review. Auto Fix applies them.
3. Shallow reasoning without an evidence chain
Frontier models are trained to produce the most coherent answer. In production investigations, coherence and correctness split apart under pressure. There is one right answer, and it is the one with a citable chain of evidence from symptom to root cause.
DIY agents almost always fall for the first plausible hypothesis. The output reads well, cites real log lines, and points at the wrong service. The on-call engineer either applies the wrong fix or spends 40 minutes disproving it. Either way, trust erodes, and the tool quietly gets ignored.
What breaks the pattern is a system that forces a causal chain, not a summary: an evidence timeline the engineer can audit, disconfirming checks that try to kill the hypothesis before committing, and a model that holds its ground under pushback instead of folding to the loudest chat message. Our own approach to identifying root cause in distributed systems puts the causal chain, not the summary, at the center of the output.
4. Tribal knowledge that never made it into a runbook
Every team’s most valuable operational knowledge is undocumented. The correlation between the nightly ETL and the p99 spike. The pod that gets restarted every Thursday. The customer whose retries cascade under load. None of it lives in a log or a runbook. It lives with an engineer who has been on rotation long enough to notice.
DIY builds treat this as a data problem: crawl the wiki, index Confluence, load the CLAUDE.md file. That gathers what has been written down and misses everything that has not. Worse, the moment services get renamed or a deploy rewires the dependency graph, the indexed runbook goes stale. A stale runbook is worse than none, because the agent trusts it.
Closing this gap needs two things: running as a live system, not a one-time setup:
- A service and dependency graph that updates automatically from live telemetry.
- A learning loop that captures every engineer’s correction and feeds it into the next investigation.
OpsAI keeps its context current because it lives inside the same platform that already tracks services, deploys, and dependencies. There is no crawl to go stale.
5. No way to measure whether it is getting better
Almost no DIY build has evals.
Without evals, teams change prompts blindly. You cannot tell whether the agent is right 90 percent of the time or 60 percent. Every model upgrade becomes a blind migration. When the agent hallucinates during a real incident, the fix is a slightly different system prompt and a prayer.
Building evals for production reasoning is not a weekend project. You need positive cases (did it find the right cause?), negative cases (did it correctly say “I don’t know” when the evidence was thin?), and calibration (when it says 90 percent confident, is it right 90 percent of the time?). And you need to regenerate the eval set as your environment drifts, or the score becomes fiction.
6. Token cost that scales with alert volume
At demo volume, tokens are free. At production volume, they are not.
A single alert investigation loads the system prompt, service metadata, and runbooks; then makes a dozen tool calls to observability APIs; then reasons over every result; then plans a fix. If you follow the pattern that made the demo work, more context, more tokens, more reasoning on every problem, the bill scales with alert volume and log volume at the same time. And the observability APIs the agent hammers are metered the same way your engineers’ dashboards are.
We see teams hit this wall around month three, when they realize their DIY agent costs more than the SREs it was supposed to help. An agent that retrieves only what the current hypothesis needs stays flat per investigation. One that stuffs the context window on every run does not.
7. Security, permissions, and audit
An AI agent with production access is a new identity in your security model. Most DIY builds treat it as a script running under a human’s credentials, and that shortcut breaks at the first audit.
Each agent needs its own principal, its own least privilege scope, and reads separated from writes. Every integration needs revocable credentials rather than a broad OAuth token. Every action taken in production needs an audit trail that answers “why,” not just “what.” When the agent starts writing (rolling back a deploy, restarting a pod, opening a PR), you need a policy layer that sorts every action into autonomous, approved, or observed, and a hard separation between the model that reasons and the engine that acts.
DIY builds usually collapse all of this into one approval gate or skip it entirely. That holds until the first time a well-meaning agent restarts the wrong pod at 3 am.
Three ways it breaks during a live incident
The seven gaps don’t fail one at a time. They combine during real incidents and produce three shapes we see repeatedly.
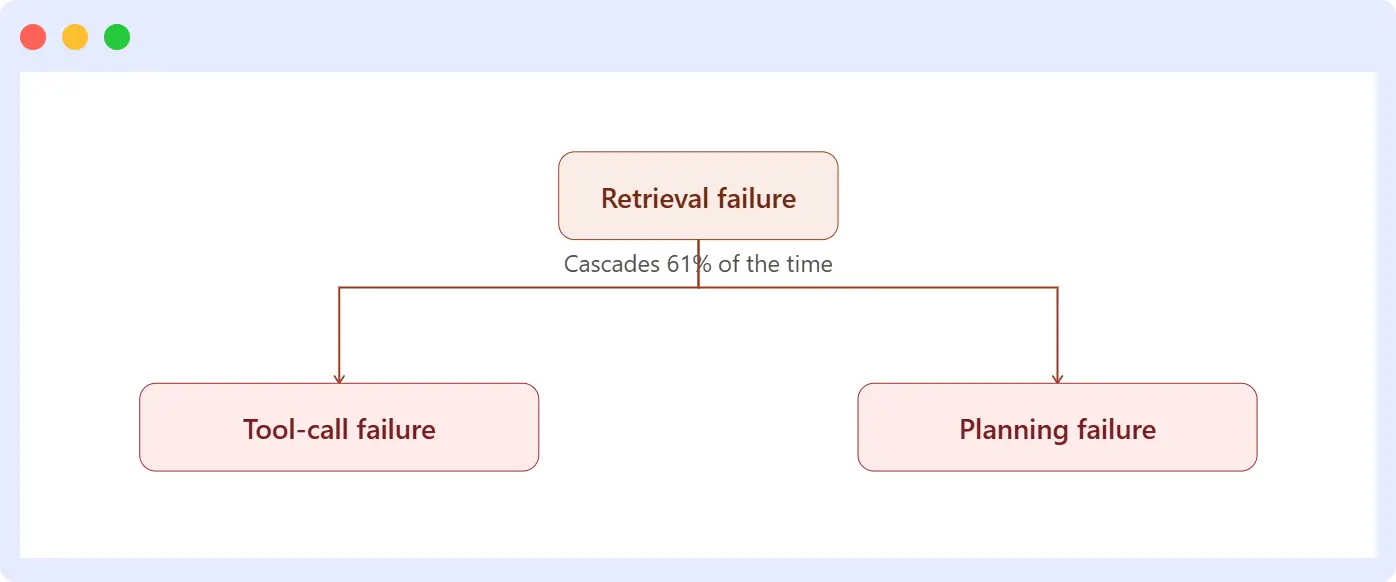
The confident wrong answer. Well formatted, cites real evidence, points at the wrong service. The junior engineer on call trusts it because every citation checks out. The actual cause was three services upstream. That is shallow reasoning plus an incomplete knowledge graph, in the same output.
The investigation that dies on a laptop. The agent worked for the engineer who ran it. Context reset when the incident got handed off. The next on-call had to start over. Production is a multiplayer problem, and most DIY tooling is single-player by design.
The action that didn’t know what it didn’t know. The agent had tool access and a plan. It ran a reasonable action based on an incomplete context. It missed a batch job dependency that another team had mentioned in Slack six months ago. A smarter model would not have caught it either. Missing tribal knowledge plus write access is a bad combination.
What actually works: observability native AI
The reason OpsAI closes these gaps is not that we picked a better model. It is that the agent starts from the observability platform, not from a chat window.
OpsAI has first-party access to APM, RUM, logs, infra metrics, and Kubernetes events on the same substrate. It doesn’t stitch across five vendors. It reads a single correlated timeline, runs detailed analysis of the issue and, for application-level problems, fixes the code and opens a pull request when it is confident enough. For Kubernetes issues, it applies the fix directly inside the cluster. When it isn’t, it hands the engineer an evidence chain instead of a guess.
That architecture is what shows up in the numbers:
- OpsAI resolves more than 80 percent of Middleware’s own production issues automatically, before a human sees the page.
- In customer beta accounts, detection to resolution is above 90 percent.
- Head-to-head on identical prompts across Grafana, Datadog, APM, RUM, and Kubernetes scenarios, OpsAI is 6x to 10x faster than competing AI SRE agents.
- Corgi Insurance cut debugging and resolution time by nearly 90 percent after adopting Middleware.
- Hotplate, a popular food delivery platform, reported a 90 percent reduction in errors after implementing Middleware’s observability suite.
- Activeloop credited the AI-powered insights with faster resolution and stronger uptime for their Fortune 500 customers.
None of that would land if the agent were producing confident wrong answers. It works because the observability layer under the model is doing most of the work. More on the operating model in our write-up on how AI-based insights change observability.
DIY agent vs. Middleware OpsAI
| Gap | DIY or in-house agent | Middleware OpsAI |
|---|---|---|
| Telemetry | Stitches five separate vendor APIs per incident. | Reads one correlated telemetry graph. |
| Kubernetes | Queries live cluster state, misses ephemeral pods and event sequence. | Captures pod, node, and deploy timelines continuously. |
| Reasoning | Anchors on the first plausible hypothesis. | Forces a causal chain with disconfirming checks. |
| Knowledge | Indexes runbooks once; goes stale as services change. | Updates automatically from live telemetry, plus a learning loop. |
| Evals | No consistent way to measure accuracy over time. | Positive, negative, and calibration evals, regenerated as the environment drifts. |
| Model selection | One model handles every task at the same cost. | Task-aware routing plus a verification pass before output reaches the engineer. |
| Token cost | Scales linearly with alert volume. | Retrieves only what the current hypothesis needs. |
| Security | Runs under a human’s credentials with one broad approval gate. | Scoped principals, redaction at the boundary, autonomous/approved/observed policy tiers. |
What building this yourself actually costs
These are not Middleware’s own figures. They come from 2026 market data on AI/ML hiring and current LLM API pricing, for a team building an equivalent system in-house:
| Line item | Year-one range | What it covers |
|---|---|---|
| People | $700K to $1.4M | A 3 to 4 person AI/ML build team. Fully-loaded AI/ML engineer cost runs $190K to $300K or more per engineer once salary, benefits, tooling, and compute overhead are included. |
| Evals and quality | Often folded into the team above, or another $150K to $300K for a dedicated hire | Building and maintaining a production eval platform is specialized work that usually needs its own engineer. |
| Infrastructure and ops tooling | $30K to $100K a year, ongoing | Monitoring, security, and compliance tooling layered on top of the agent itself, separate from the underlying observability stack. |
| LLM tokens | Cents to a few dollars per investigation, but scales with alert volume | A guided investigation typically runs 20,000 to 50,000 tokens. At current blended API pricing of roughly $1 to $4 per million tokens, that stays small until volume climbs into the thousands of alerts a month. |
Independent industry cost surveys put a production-grade enterprise AI system at $500K to $1.5M to build in the first year, on top of ongoing monitoring costs of $30K to $100K a year and retraining or maintenance running 15 to 25 percent of the original build cost annually. Tokens are usually the smallest line. The real cost is the standing team: someone has to handle model deprecations, rewrite prompts as usage drifts, and get paged when the AI itself misfires. Teams that get to a system they trust to act autonomously typically spend well over a year past “functional” to get there.
Bottom line
Wiring a model to your logs gives you a demo by Friday. Getting it to a place where an engineer trusts it at 3 am is a different build entirely. The parts of that build that matter most sit below the model: a unified telemetry graph that includes Kubernetes state as a timeline, causal reasoning with cited evidence, a live knowledge graph, continuous evals, disciplined token use, and a policy layer for write actions.
That is why we built OpsAI on top of Middleware’s observability platform instead of shipping another chatbot. If you’d rather not spend two years engineering the harness, start free or read the technical write-up.
FAQs
Why does a frontier model demo well and then fail in production?
A demo has one alert, one engineer, and no consequences. Production has millions of log lines, multiple owners per incident, and asymmetric costs for wrong answers. The demo tests the model. Production tests the harness and the data layer around it.
Can’t we just fine-tune a model on our runbooks?
You can, and it helps, but it does not close the biggest gaps: unified telemetry, Kubernetes state, causal reasoning, evals, and safe write access. A fine-tuned model with no evidence chain still produces a confident wrong answer.
Why is Kubernetes such a common failure mode for DIY agents?
Kubernetes state is ephemeral and event-driven. A DIY agent that queries the live cluster state sees a healthy pod after a crash and misses the timeline of scheduling decisions and evictions that caused the incident. Closing this needs a K8s-aware collector that captures the full sequence, not a snapshot.
What is different about OpsAI compared to a general-purpose AI agent?
OpsAI is built on Middleware’s observability platform, which means it queries one correlated telemetry graph instead of five vendor APIs. It runs detailed analysis, opens PRs when confident, applies fixes directly inside the Kubernetes cluster, and hands engineers an evidence chain when not. Architecture detail is in the OpsAI writeup and the OpsAI vs Resolve AI benchmark.
How does OpsAI compare in cost to building this in-house?
A DIY build for a mid-size org runs into millions across people, evals, infrastructure, and tokens, and takes 18 to 36 months to reach trusted autonomy. OpsAI ships that whole stack as part of the Middleware’s platform. Pricing and setup are on the OpsAI product page.
Does OpsAI work if we already use Datadog or Grafana?
Yes. OpsAI ingests alerts from Datadog and Grafana and runs investigations on their metrics and logs from inside Middleware, without a migration.

