



On-call engineering is one of the hardest knowledge-transfer problems in software, and most AI SRE agent for on-call engineers conversations start in the wrong place. A junior engineer inherits a production system at 2 AM with a P1 alert firing. They have no context for why the service behaves the way it does. Traditional runbooks go stale. Tribal knowledge walks out the door with senior engineers. This post explains how Middleware OpsAI acts as an always-available AI SRE copilot during live incidents. It surfaces root cause analysis in real time, guides on-call engineers through resolution step by step, and shortens the learning curve without requiring escalation or institutional memory.
Key takeaways
- On-call burnout is a knowledge gap as much as a staffing gap: most incident time goes into manually correlating data an engineer should not have to hunt for
- OpsAI works as a real-time AI SRE copilot, surfacing root cause analysis, stack trace context, and a proposed fix the moment a P1 alert fires, so on-call engineers start in resolution mode instead of investigation mode
- Kubernetes incidents can be fixed directly through Auto Fix mode or routed through Auto RCA mode for a reviewed recommendation, keeping engineers in control at every step
- Application errors get a GitHub pull request with a clean diff and full incident context attached, so junior engineers are never left debugging blind
- Alerts from Datadog and Grafana feed directly into OpsAI, so on-call engineers get AI-guided analysis no matter which monitoring stack the team runs
- Every incident OpsAI resolves adds to a structured, queryable incident history, turning tribal knowledge into institutional knowledge that speeds up the next resolution
- OpsAI auto-resolves more than 50% of production incidents internally at Middleware, and the rate climbs past 70% across beta customers
The on-call knowledge problem no one talks about
Ask any engineering manager why on-call rotations are painful, and you will hear about alert volume, false positives, and 3 AM pages. Those are real. But the deeper problem is something else: the enormous gap between what an on-call engineer needs to know and what they actually know the moment they pick up a P1 alert.
Senior SREs carry years of context in their heads. They know which service has a memory leak on heavy traffic days. They know the checkout API 500s when a specific upstream dependency returns a malformed response. None of this lives in a runbook.
It lives in Slack threads from eight months ago, in post-mortems no one rereads at 2 AM, and in the heads of engineers who no longer work at the company.
When a junior engineer joins the on-call rotation, they inherit this system without the context. The result is predictable: longer MTTR, more escalations, more burnout on both ends; the incident management KPIs every team tracks all move in the wrong direction at once.
That cognitive overload slows decisions. It turns human judgment into a bottleneck instead of a safeguard.
This is the problem OpsAI is designed to solve. Not by replacing the on-call engineer, but by giving them the knowledge they do not have yet, in real time, in the context of the specific incident they are looking at right now.
What is an AI SRE agent, and what does it do during live incidents
An AI SRE agent is a software system that continuously monitors your production environment, detects issues across your full stack, automatically performs root cause analysis, and, when confident enough, applies or proposes a fix without requiring human investigation time.
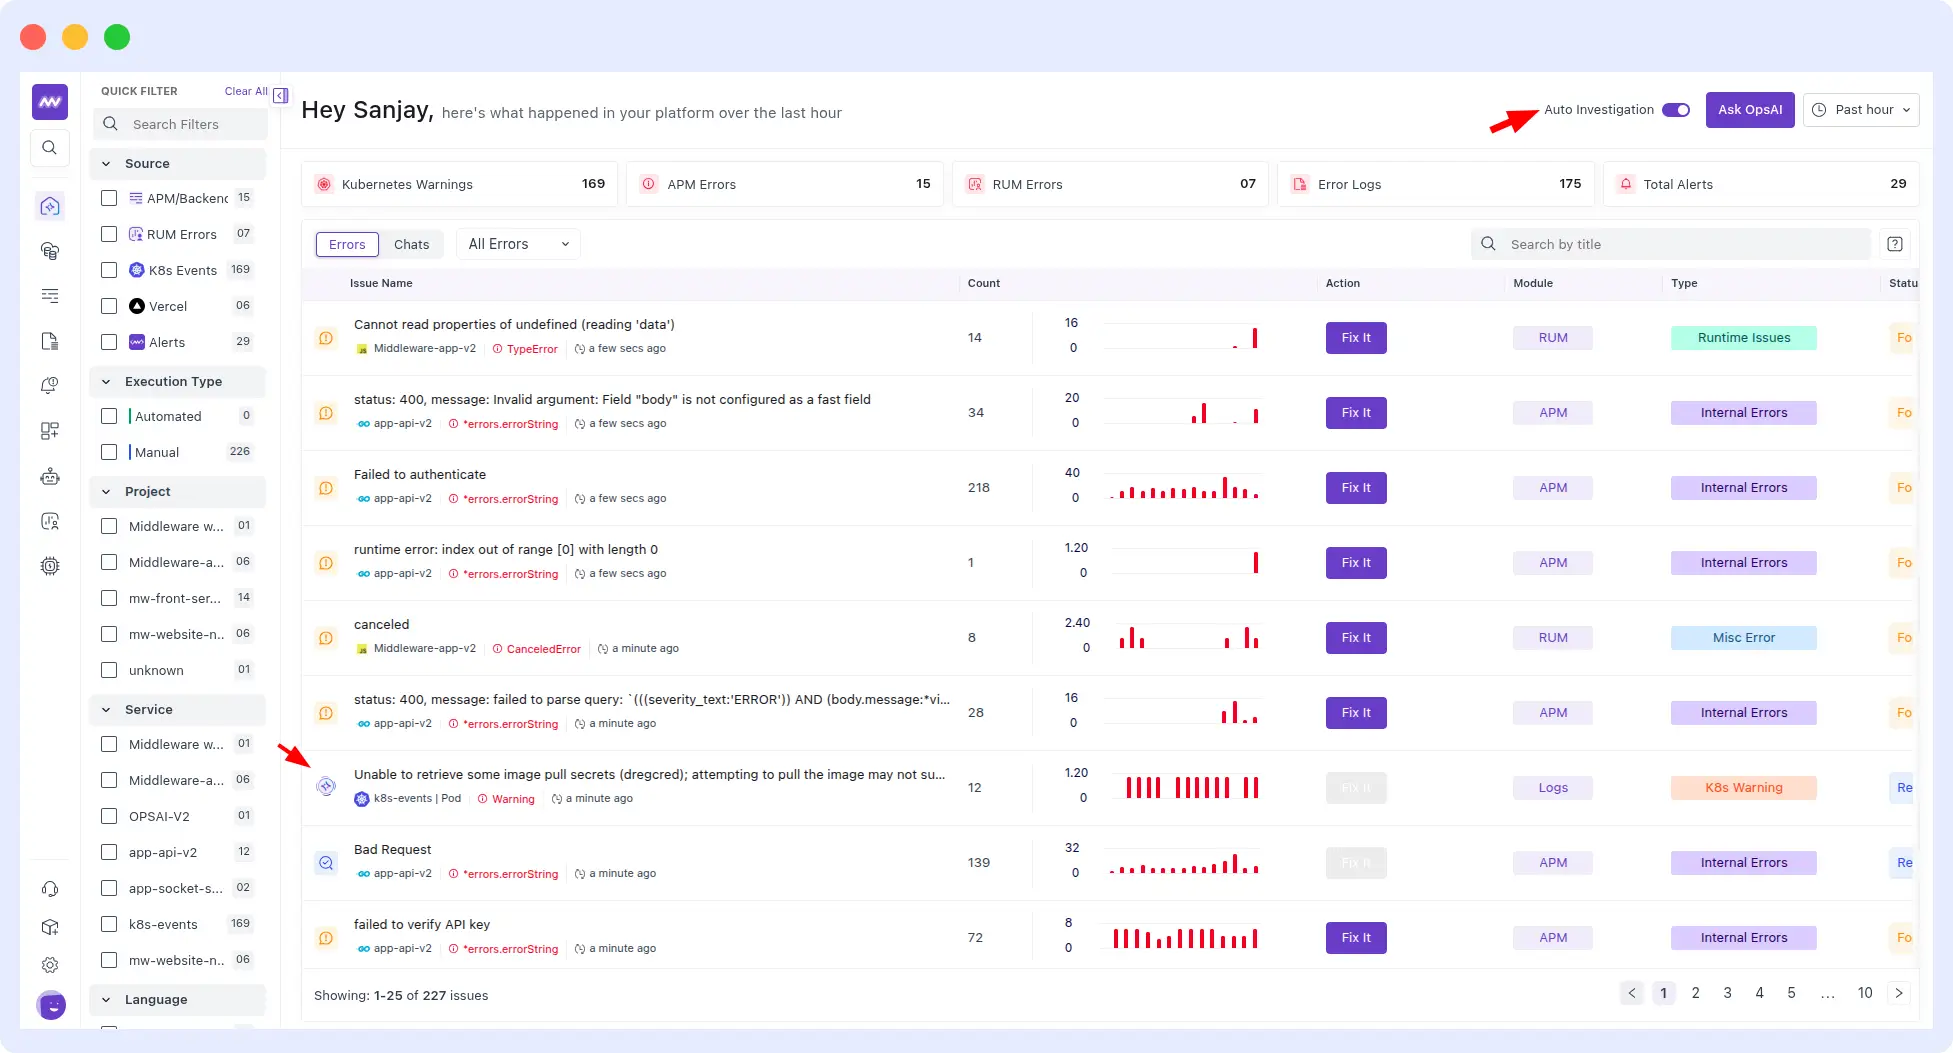
The key distinction from traditional monitoring is the word “agent.” A monitoring tool observes and alerts. An agent acts. It takes the alert, assembles the relevant context, forms a hypothesis about root cause, and either resolves the issue or presents a ready-to-act recommendation to the on-call engineer.
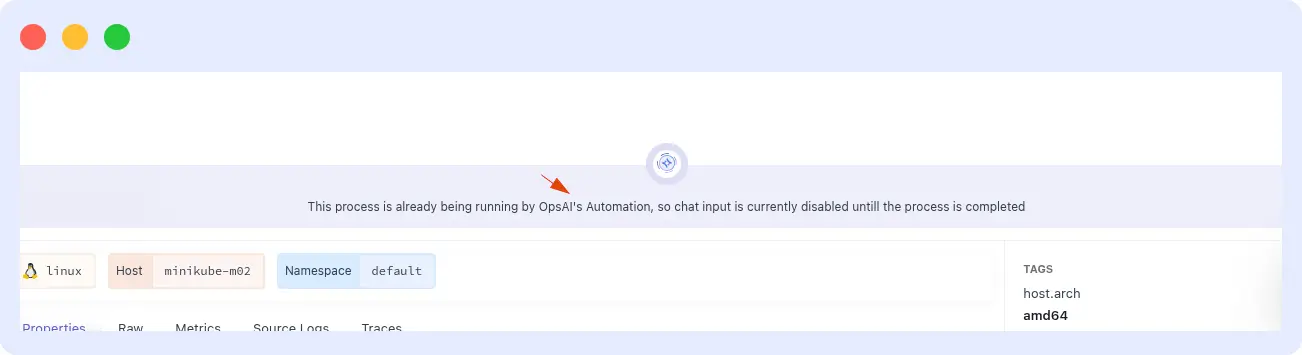
Middleware OpsAI is an AI SRE agent built directly into the Middleware full-stack observability platform. During a live incident, here is specifically what OpsAI does:
- Detects the issue: across APM traces, RUM sessions, Kubernetes events, and infrastructure metrics simultaneously, not just from the alert that fired
- Correlates signals: it does not look at one metric in isolation; it pulls in stack traces, log context, error metadata, and the pre-incident metric trajectory together
- Retrieves code context: via a secure GitHub MCP connection, OpsAI reads only the files related to the specific error and combines them with the observability data
- Runs root cause analysis: it identifies the file, function, and line most likely responsible for the failure, with a plain-language explanation of why it broke
- Proposes or applies a fix: for Kubernetes, it can patch the cluster directly; for application errors, it opens a pull request with a clean diff and enough context for a fast review
For an on-call engineer, especially one who is new to the system, this transforms the incident experience from “where do I even start” to “here is the root cause and here is the fix, do you want to apply it.”
What OpsAI shows an on-call engineer when a P1 alert fires at 2 AM
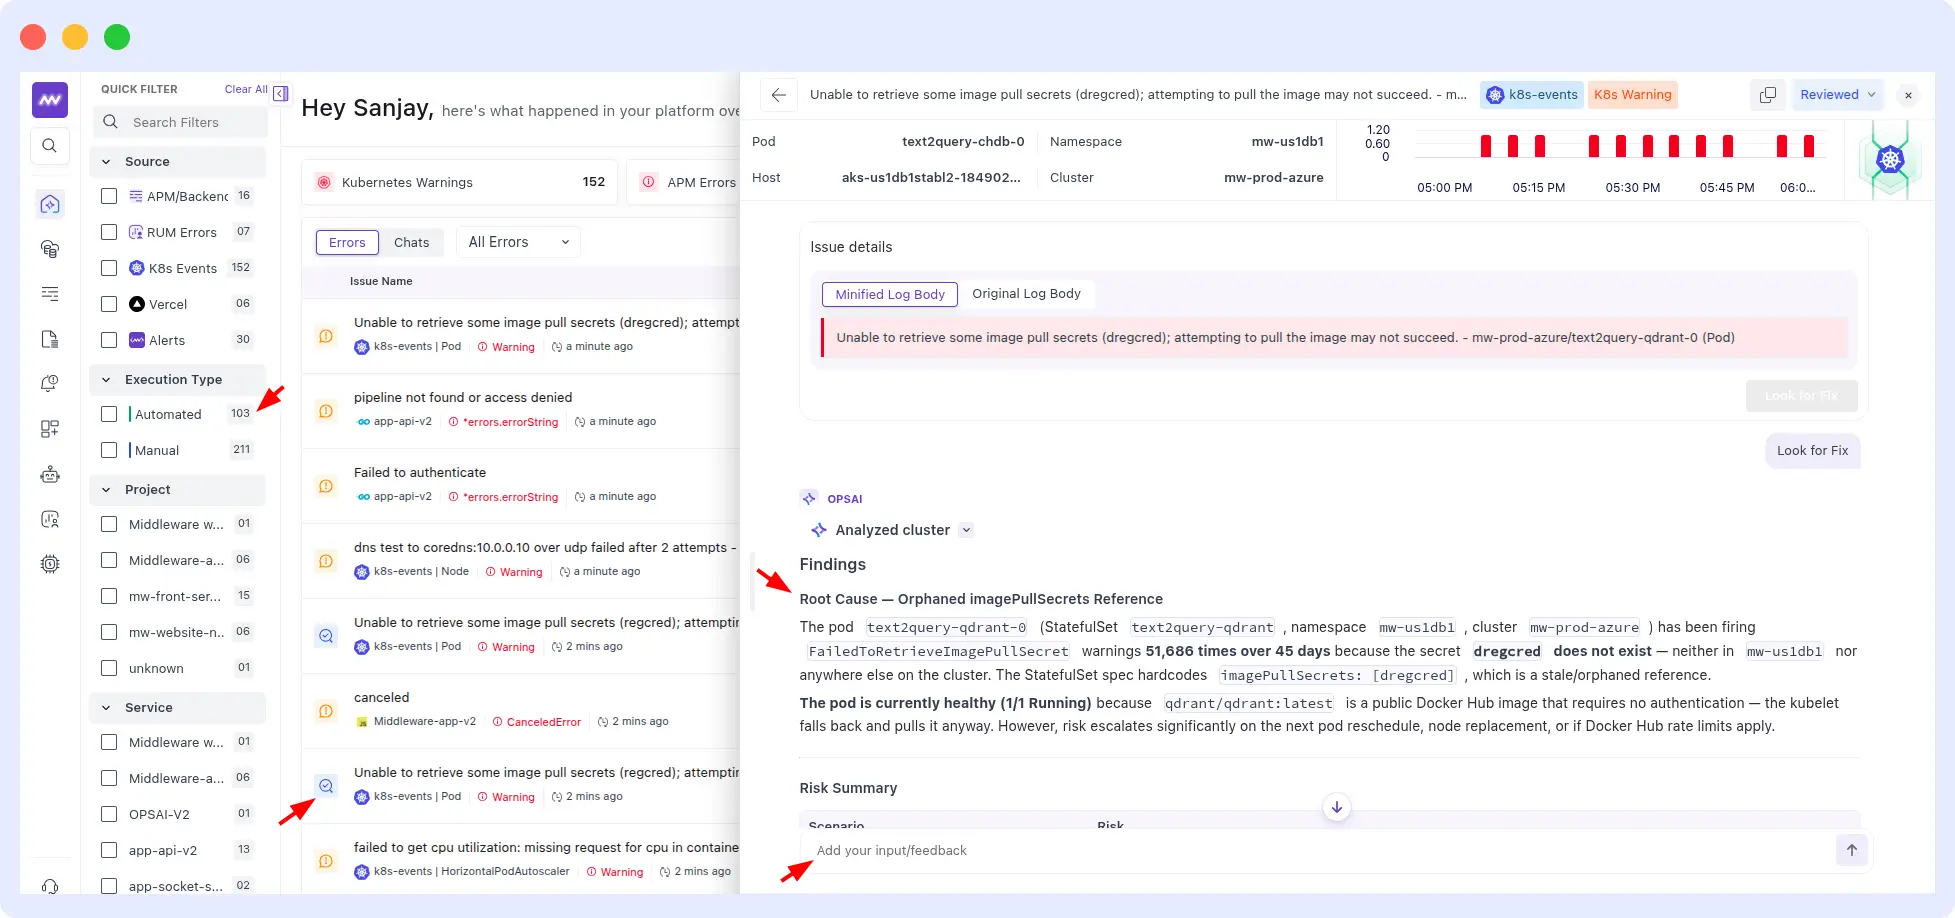
This is the most concrete question to answer, because it is the one that determines whether an AI SRE copilot actually reduces on-call stress or just adds another tool to check. When a P1 alert fires and an on-call engineer opens the OpsAI findings panel, here is exactly what they see.
1. Incident summary in plain language
Not raw metrics or a list of log lines. A plain-language summary of what broke: which service, what error type, how many users or requests are affected, and whether this pattern has appeared before.
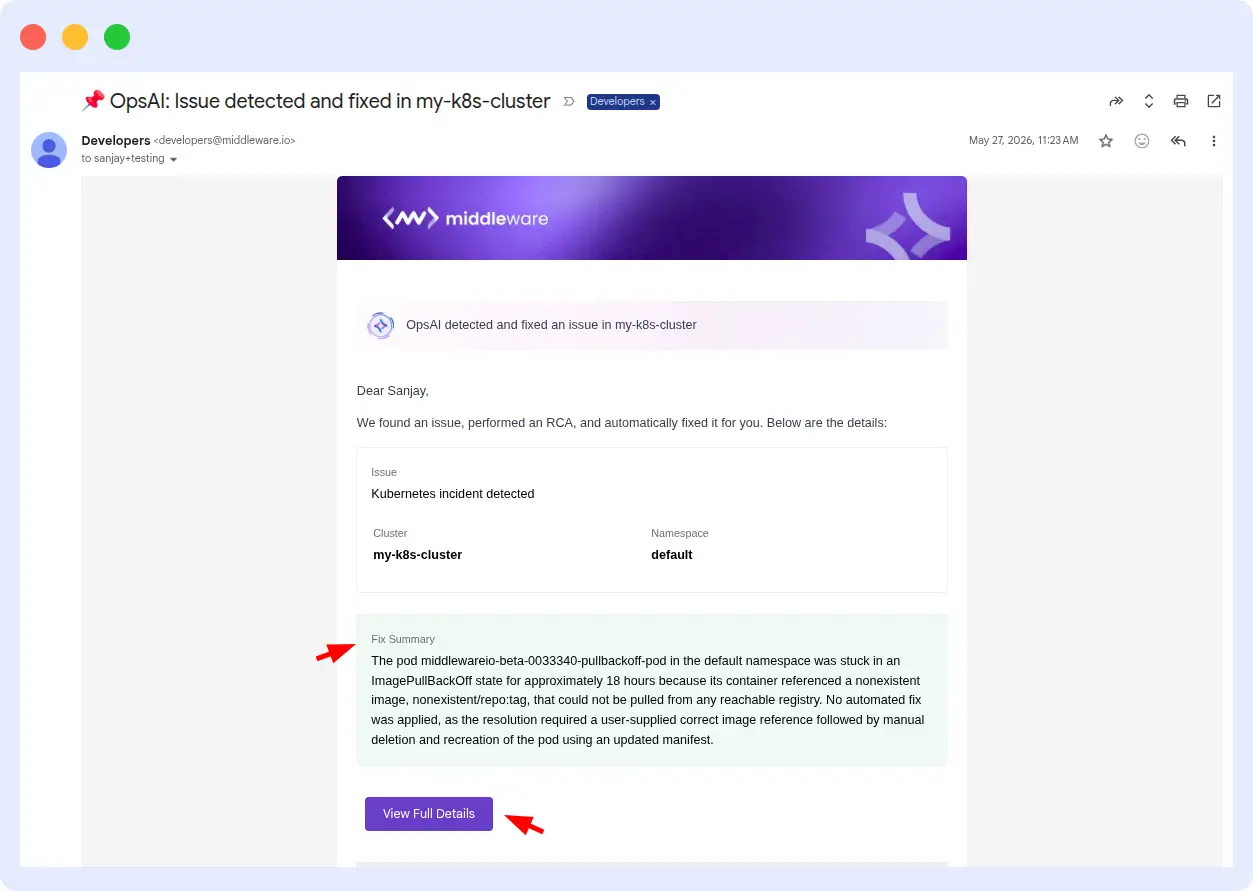
This alone removes the first 10 to 15 minutes of an incident, the time an engineer would otherwise spend just understanding what they are looking at.
2. Full root cause analysis with evidence
OpsAI surfaces the most likely root cause with the evidence that supports it: the specific stack frame where the error originated, the log lines surrounding the failure, the infrastructure metric that was trending abnormally in the 5 minutes before the alert fired, and, when a GitHub or Bitbucket repository is connected, the exact file and line in your codebase that is responsible.
For a junior engineer who does not know the codebase deeply, this is the difference between a 45-minute investigation and a 3-minute confirmation. They are not finding the root cause from scratch, they are verifying and approving OpsAI’s finding.
3. Proposed fix with context
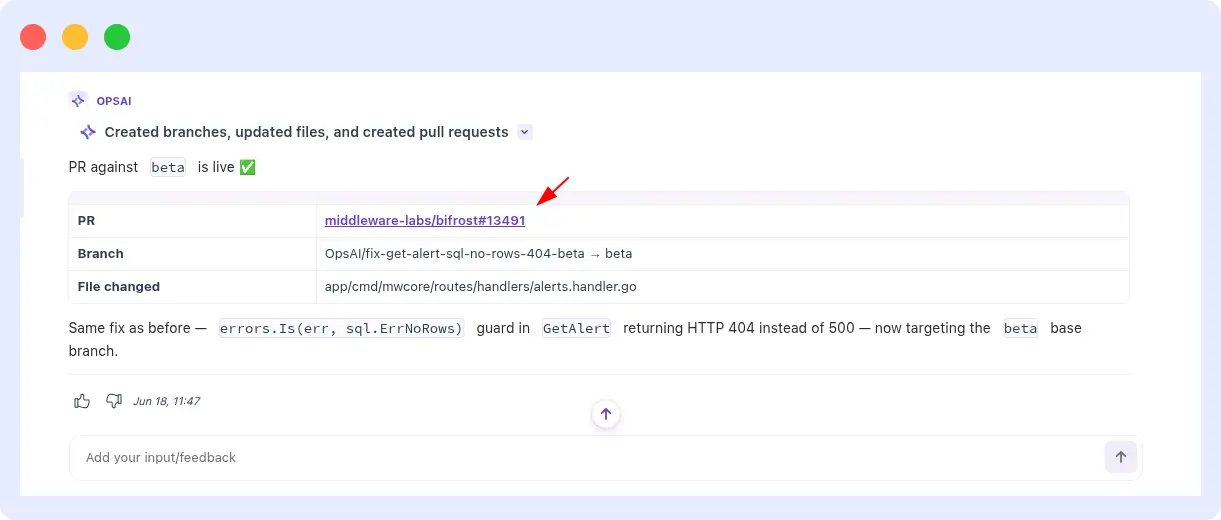
For application errors, OpsAI opens a GitHub pull request with a code change targeting the identified root cause. The PR includes a diff, a description of what changed and why, and cross-references to the incident. The on-call engineer does not need to write a fix under pressure, they need to review one.
For Kubernetes incidents, OpsAI presents the proposed fix in the findings panel, for example raising the memory limit on a pod after an OOMKill, with the option to apply it directly (Auto Fix mode) or to approve it first (Auto RCA mode).
4. Historical context if the pattern has recurred
If the same incident pattern has appeared before, OpsAI surfaces that history: when it happened previously, what the root cause was, and how it was resolved. For a new engineer, this context is invaluable. They do not need to find the right Slack thread or post-mortem document, the relevant history is presented as part of the incident findings, directly in the tool they are already using.
5. Cross-stack correlation view
OpsAI shows which other services and layers are involved: if the backend error is causing a frontend RUM degradation, if a Kubernetes pod restart is connected to the APM latency spike, if a Datadog alert from a different team is related to the same root cause. This cross-stack view prevents the common mistake of fixing a symptom in one layer while the root cause lives in another.
AI SRE copilot vs traditional runbooks: what actually works for new engineers
Runbooks have been the standard answer to the on-call knowledge problem for more than a decade. Write down what to do when X happens, keep it updated, train new engineers on it. In theory, this works. In practice, it fails for three structural reasons.
| Dimension | Traditional runbooks | OpsAI AI SRE copilot |
|---|---|---|
| Freshness | Go stale immediately after infrastructure changes | Always current, based on live telemetry, not documentation |
| Coverage | Only documents known failure modes | Handles novel failures via anomaly detection and RCA |
| Time to useful guidance | Engineer must find the right runbook first (2 to 10 min) | Findings surfaced automatically when alert fires (0 min) |
| Specificity | Generic procedure (“check the logs”) | Pinpoints exact file, line, and fix for this specific incident |
| Learning effect | Engineer reads steps but may not understand the why | RCA explanation teaches root cause reasoning over time |
| Maintenance burden | High, must be kept in sync with every infra change | Zero, based on live observability data, self-updating |
| Escalation required | Frequently, when runbook does not match the incident | Rarely, OpsAI covers 70%+ of incidents automatically |
The deeper issue with runbooks is that they are a static artifact in a dynamic environment. Every deployment, every configuration change, every new dependency potentially invalidates a runbook step. Keeping them current requires the same senior engineers whose time on-call rotations are supposed to protect.
An AI SRE copilot does not replace runbooks entirely, for compliance-sensitive environments, documented procedures have their place. But for the actual moment of incident response, an agent with live telemetry access and root cause analysis capability is a fundamentally better guide than a Confluence page written six months ago.
How OpsAI reduces on-call burnout without adding headcount
On-call burnout has two root causes that are often conflated. The first is volume: too many alerts, too many pages, too many nights interrupted. The second is cognitive load: even a single well-placed 2 AM page is brutal if the engineer has to do 45 minutes of correlation work under pressure before they can even identify the problem. OpsAI addresses both.
Reducing volume through smarter alert handling
OpsAI groups related alerts into a single incident instead of forwarding each signal as a separate page. Say a database connection failure cascades into 400 downstream service errors. OpsAI surfaces one incident, the database connection failure, not 400 separate alerts.
Engineers get paged once, with full context, instead of 400 times in rapid succession.
OpsAI’s AI-powered anomaly detection also filters false positives before they become pages. Real deviations from baseline are flagged; noise from routine traffic variation is suppressed.
Reducing cognitive load through pre-assembled context
The most exhausting part of on-call work isn’t applying a fix. It’s the investigation that precedes it.
An engineer paged at 2 AM typically spends the first 20 to 45 minutes just correlating data checking the APM dashboard, pulling logs, searching Slack for past incidents. That’s what makes on-call shifts damaging over time. Not just lost sleep, but sustained cognitive effort under pressure.
When OpsAI handles the correlation automatically and surfaces a complete findings panel before the engineer has finished reading the alert, that investigation time collapses to near zero. The engineer reviews, approves, and moves on. The cognitive load of an on-call shift drops significantly even when the number of incidents stays the same.
Auto-resolution for the incidents that do not need humans at all
OpsAI resolves more than 80% of production incidents at Middleware internally without human intervention, and in customer benchmarks it delivers 6x–10x faster time-to-resolution than competing AI SRE agents. For incidents that fall within OpsAI’s Auto Fix capability, primarily Kubernetes issues like OOMKills, CrashLoopBackOff events, and HPA misconfigurations, the engineer is not paged at all. The problem is detected, diagnosed, fixed, and logged before it reaches the on-call rotation, much like how AI-driven alerts caught a memory leak before it became an outage.
The direct effect on on-call quality of life is substantial: fewer 3 AM pages, shorter incident windows when pages do occur, and a clear record of what happened and why, which makes the next shift handoff easier for everyone.
AI-assisted knowledge transfer: replacing tribal memory with incident intelligence
Tribal memory is the term SRE teams use for knowledge that exists only in people’s heads why a service behaves the way it does, which config quirks were never documented, which failure modes only show up under specific load.
When the people who hold that knowledge leave, it leaves with them.
This is a structural risk that grows with every year a system operates. Teams that have been together for five years have enormous tribal knowledge. When they onboard a new engineer into the on-call rotation, they are trying to transfer years of hard-won context in a few weeks of documentation and shadowing sessions. Most of it does not transfer. It surfaces later, painfully, during incidents.
How OpsAI encodes incident intelligence
Every incident OpsAI investigates becomes part of a queryable incident history. That history captures:
- What broke and what the log pattern looked like
- What the infrastructure was doing at the time
- The root cause and how it was fixed
This isn’t a static document. It’s a structured knowledge base OpsAI draws on during future investigations.
When a new on-call engineer encounters an incident that a senior SRE would recognize instantly from two years of experience, OpsAI surfaces the relevant history automatically. The new engineer sees that the pattern has appeared several times before, what the root cause was each time, and what fixed it. They get the benefit of institutional memory without needing to have been there for the original incidents.
Learning through doing, not just reading
OpsAI does not just hand new engineers an answer, it shows its reasoning. The findings panel explains not just what broke but why: which metric trajectory preceded the failure, why the specific log sequence is significant, how the stack trace maps to the codebase. Over time, engineers who work alongside OpsAI develop the pattern recognition that used to take years of on-call experience to build. The AI copilot becomes a teacher as much as a resolver.
This is a meaningful shift in how SRE knowledge compounds in an organization. Instead of knowledge concentrating in a few senior engineers and being lost when they leave, it accumulates in OpsAI’s incident history and is distributed equally to every engineer on the rotation.
Real scenarios: a junior engineer’s first P1 with OpsAI
Scenario 1: P1 at 2 AM, unfamiliar service, no senior available
A junior engineer on their second week of on-call rotation gets paged at 2:17 AM. The alert is: payment service error rate above 5% for 3 minutes. They have never debugged the payment service before.
Without OpsAI: They open the APM dashboard, see hundreds of error spans, try to find a pattern, search Slack for “payment service error,” find a thread from eight months ago that may or may not be relevant, attempt to read the codebase, escalate to a senior engineer at 2:45 AM. The senior engineer identifies the issue in 4 minutes from experience. MTTR: 35 minutes, plus a burned senior engineer’s night.
With OpsAI: The engineer opens the OpsAI findings panel. It shows the root cause is a KeyError in the payment validation function triggered by a specific upstream API response format change. The same pattern appeared 6 weeks ago and was resolved by adding input validation on the response schema. OpsAI has already opened a pull request with the same fix applied to the current codebase. The engineer reviews the PR in 3 minutes, merges it, and closes the incident. MTTR: 8 minutes. No escalation. No senior paged.
Scenario 2: Kubernetes pod crash loop during a high-traffic event
A new SRE is on call during a flash sale. Multiple pods in the order processing namespace start showing OOMKilled events. Kubernetes keeps restarting them with the same memory limit, so they keep dying.
With OpsAI in Auto RCA mode: OpsAI detects the OOMKill events, cross-references the pod’s P99 memory usage data from the past 30 minutes, and presents a recommendation: raise the memory limit on the order-processor deployment from 512Mi to 768Mi based on actual usage plus a safety buffer. The engineer sees the recommendation in the findings panel with the supporting memory metric data, approves it with one click, and the pods stabilize. For a detailed breakdown of how OpsAI handles this specific failure type, see the Kubernetes pod crash auto-remediation guide.
Scenario 3: Cascading alert storm from a single root cause
An on-call engineer receives 23 alerts in 4 minutes across 8 different services. Without incident grouping, this is genuinely overwhelming, it is unclear whether these are 23 separate incidents or one incident with 23 symptoms.
With OpsAI: The 23 alerts are grouped into a single incident. OpsAI identifies the shared root cause: a database connection pool exhaustion in one upstream service that cascaded into timeouts across all dependent services. The findings panel shows all 23 alert sources, maps them to the single root cause, and proposes the fix. The engineer handles one incident, not 23.
Getting started: enabling OpsAI for your on-call team
OpsAI is part of the Middleware platform and activates automatically once your agents are connected. Here is the setup path for the three most common on-call environments.
For Kubernetes-heavy environments
Install the Middleware Kube Agent with OpsAI enabled:
helm repo add middleware-labs https://helm.middleware.io

helm install mw-agent middleware-labs/mw-kube-agent-v3
  --set global.mw.apiKey=<MW_API_KEY>
  --set global.mw.target=<MW_TARGET_URL>
  --set opsai.enabled=true
  --set global.clusterMetadata.name=<CLUSTER_NAME>
  --set mw-autoinstrumentation.enabled=true
  -n mw-agent-ns --create-namespace
Choose your resolution mode based on environment: Auto Fix for staging (OpsAI applies fixes directly, zero intervention needed), Auto RCA for production (OpsAI proposes the fix, engineer approves with one click).
For application errors via APM and RUM
Install the Middleware APM SDK for your language — Python, Node.js, Go, Java, Next.js are all supported. Add the RUM JavaScript snippet to your frontend to capture user-facing errors alongside backend traces.
Connect your GitHub or Bitbucket repository via the GitHub MCP integration in Middleware settings. Set these build-time environment variables in your CI pipeline so OpsAI can target the right branch when opening PRs:
MW_VCS_REPOSITORY_URL=<your repository URL>
MW_VCS_COMMIT_SHA=<commit SHA>
OpsAI begins monitoring APM traces and RUM sessions immediately. When an error fires, it surfaces findings in the OpsAI panel and opens a pull request, no additional configuration needed.
For Vercel deployments
Connect your Vercel account to Middleware to ingest Error and Fatal Error logs into OpsAI. OpsAI automatically detects production issues, correlates Vercel logs with related traces, deployments, and application telemetry, and performs automated root cause analysis. If your repository is connected through the GitHub MCP integration, OpsAI can also generate a pull request with a proposed fix, helping your team resolve frontend and serverless application issues faster.
For a detailed walkthrough on investigating Vercel incidents, running Root Cause Analysis (RCA), and generating code fixes with OpsAI, see the Fix Issues with OpsAI section in the Vercel integration documentation.
For teams already using Datadog or Grafana
OpsAI ingests alerts from both Datadog and Grafana without requiring migration. Connect your existing tools via the integrations panel:
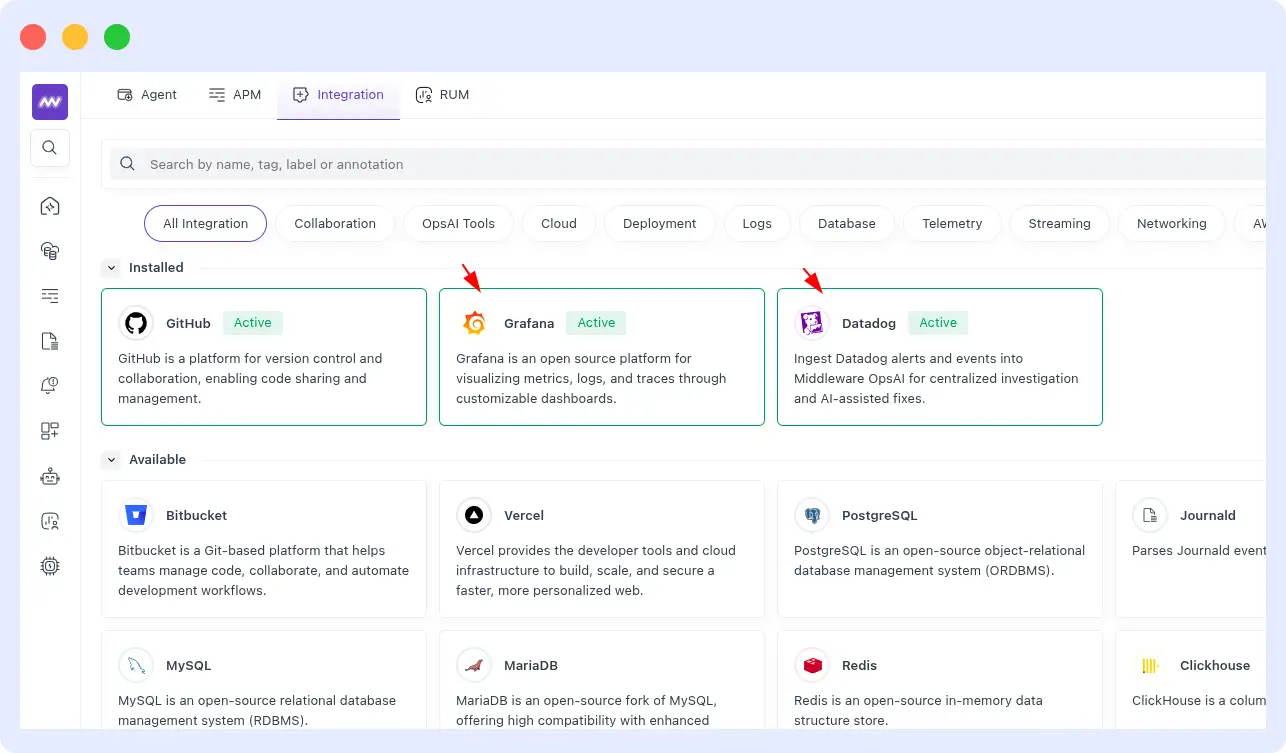
- Datadog integration: OpsAI ingests Monitor and Kubernetes alerts and runs investigations using Datadog’s metrics, logs, and traces
- Grafana integration: connect via Contact Point and Notification policy webhook; OpsAI runs investigations against Grafana data inside Middleware
Enabling alert ingestion for the on-call team
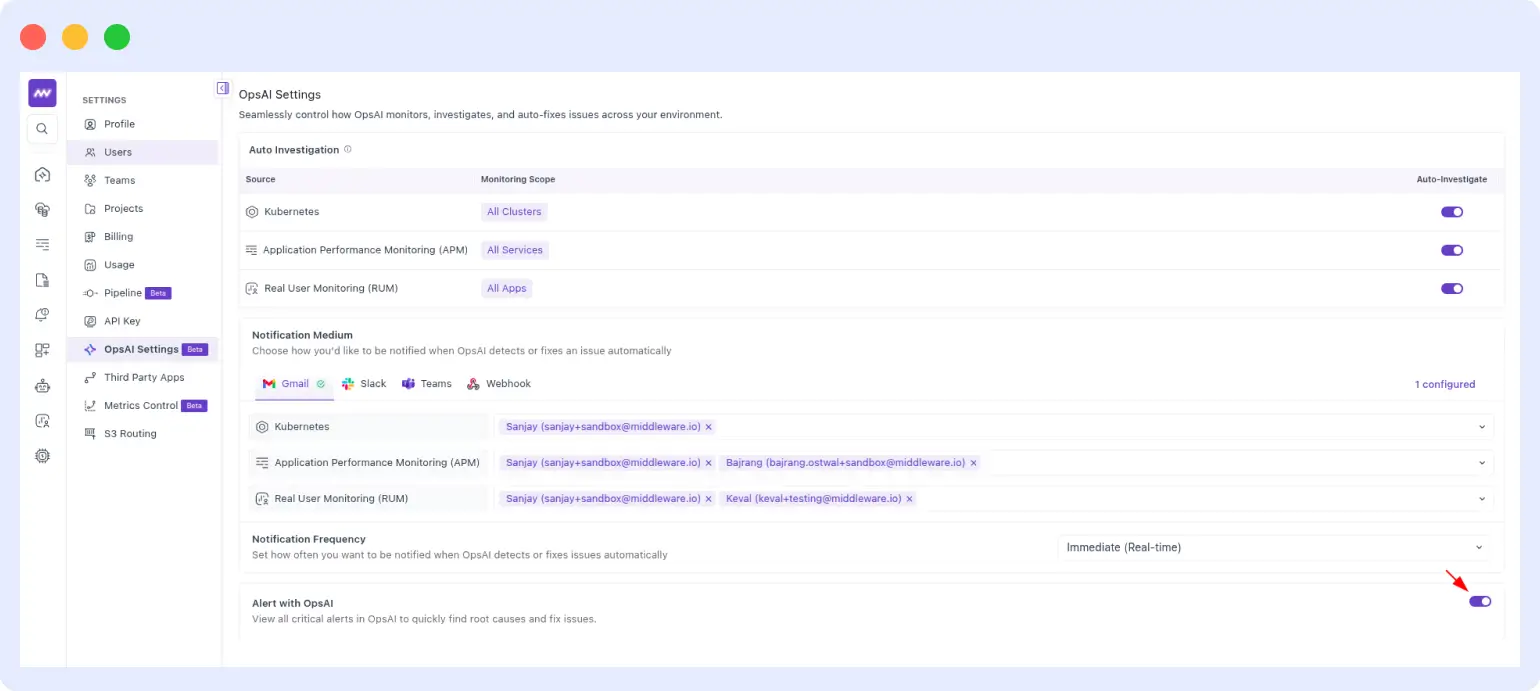
To feed all Middleware native alerts into OpsAI automatically, go to Settings > OpsAI Setting and enable the Alert Ingestions toggle. From that point, every critical alert fired by Middleware monitors flows into the OpsAI findings panel with a full investigation attached, so when an on-call engineer gets paged, the RCA is already waiting for them.
Full setup documentation for OpsAI.
Start for free — OpsAI activates automatically once your APM, RUM, or Kubernetes agent is connected. No credit card required. Your on-call team sees findings in the next incident.
FAQs
How can AI help on-call engineers handle incidents without escalating?
OpsAI removes the two main reasons escalation happens: not knowing where the root cause is, and not knowing how to fix it. By the time an on-call engineer opens an alert, OpsAI has already identified the root cause, pulled the relevant code context from GitHub, and proposed or opened a fix. Junior engineers can resolve incidents that would previously have required a senior escalation, not because the incidents are simpler, but because OpsAI provides the context that makes them solvable independently.
What is an AI SRE agent and how does it work during live incidents?
An AI SRE agent is a system that monitors your production environment continuously, detects issues across your full stack (APM, RUM, Kubernetes, infrastructure), performs root cause analysis automatically, and proposes or applies fixes without requiring manual investigation. During a live incident, it assembles stack traces, log context, infrastructure metrics, and source code into a unified findings view, giving the on-call engineer a complete picture instead of raw telemetry to correlate manually.
Can an AI assistant guide an on-call engineer through P1 incident resolution in real time?
Yes. OpsAI surfaces a structured findings panel when any alert fires: plain-language incident summary, identified root cause with supporting evidence, and a proposed fix with a code diff or Kubernetes patch. The engineer reviews and approves rather than investigating from scratch. For recurring patterns, OpsAI also surfaces historical context, what caused the same issue before and how it was resolved, so the engineer is never starting blind.
How do I reduce on-call burnout for on-call engineers using AI tools?
OpsAI reduces burnout through two mechanisms: fewer pages (Auto Fix handles Kubernetes incidents before they escalate to the rotation) and shorter cognitive load per incident (pre-assembled RCA means investigation time collapses from 30 to 45 minutes to 5 to 8 minutes). The combination reduces both the frequency and the intensity of on-call work without requiring additional headcount or longer escalation chains.
AI SRE copilot vs traditional runbooks: which is better for new engineers?
For live incident guidance, an AI SRE copilot is significantly more effective than runbooks. Runbooks go stale with every infrastructure change, cover only known failure modes, and require engineers to find the right runbook before they can use it. OpsAI provides live, incident-specific guidance based on current telemetry, it does not require the engineer to know which runbook applies, because OpsAI already knows what the incident is and what to do about it.
Why do on-call engineers take so long to resolve incidents, and how can AI help?
Most incident time is spent on correlation: pulling logs, checking metrics, reading traces, searching Slack for relevant history. This is not engineering work, it is data assembly work. OpsAI handles this assembly automatically, pulling together all relevant signals before the engineer has finished reading the alert. The time savings are not marginal: investigations that previously took 30 to 45 minutes routinely complete in under 5 minutes with OpsAI surfacing findings in real time.
How can I use an AI assistant to transfer SRE knowledge without relying on tribal memory?
OpsAI builds structured incident history from every investigation it runs: what broke, what the pattern looked like, what the root cause was, and how it was fixed. When a new engineer encounters an incident that an experienced SRE would recognize from memory, OpsAI surfaces the relevant history automatically. Over time, this shifts institutional knowledge from individual engineers’ heads into a queryable system that every on-call engineer can access, regardless of how long they have been on the team.
What should an AI copilot show an engineer when a P1 alert fires at 2 AM?
At minimum: a plain-language description of what broke, the identified root cause with supporting evidence, the specific service and code location responsible, a proposed fix, and any historical context from past occurrences of the same pattern. OpsAI provides all of this in the findings panel before the engineer has to open a single additional dashboard. The goal is to put the engineer in review-and-approve mode immediately, not investigation mode.
Does OpsAI work if my team uses Datadog or Grafana for monitoring?
Yes. OpsAI ingests alerts from both Datadog and Grafana, runs investigations using their metrics, logs, and traces, and surfaces findings inside the Middleware UI. On-call engineers get AI-assisted RCA regardless of which monitoring tools the team standardized on. See the OpsAI vs Resolve AI comparison for a detailed look at how OpsAI handles multi-tool environments.
Is OpsAI an SRE automation feature built into APM, or a separate tool?
OpsAI is built directly into Middleware’s APM, so SRE automation is not a bolt-on integration, it runs on the same traces, error data, and deployment context your APM already collects. When an APM alert fires, OpsAI has immediate access to the full trace and code context needed for root cause analysis, rather than waiting on a separate system to ingest and re-correlate the data. For teams evaluating APM platforms specifically for built-in SRE automation, this tight coupling is what keeps time-to-root-cause low.
Can an AI SRE agent handle log management as part of on-call workflows?
Yes. OpsAI treats log data as one of several correlated signals, not a separate destination engineers have to search manually. When an incident fires, it pulls the relevant log lines automatically and presents them alongside the stack trace, infrastructure metrics, and code context — all in the same findings panel.
As a result, on-call engineers get log-level detail without opening a separate log management tool or writing a query under pressure.
Explore more on OpsAI:
- OpsAI product overview
- OpsAI setup documentation
- Introducing Middleware OpsAI: the AI SRE agent
- How we built an AI SRE agent for production incidents
- Kubernetes pod crash auto-remediation with OpsAI
- OpsAI vs Resolve AI: real-world performance comparison
- Application performance monitoring
- Infrastructure monitoring

