Amazon Elastic Kubernetes Service (EKS) is a managed Kubernetes service that simplifies cluster operations in AWS, removing the need to configure and manage your own control plane.
EKS automatically manages the availability and scalability of control plane nodes for scheduling, application availability, cluster data storage, and other critical tasks. This lets development teams focus on building and delivering applications instead of managing infrastructure. Still, operating applications at scale has challenges. How do you know if pods are healthy? How do you detect and resolve performance bottlenecks before they affect users?
To manage such challenges, you require effective EKS monitoring. Although EKS makes cluster management easier, you cannot eliminate visibility. As with every other Kubernetes environment, there is a need for comprehensive monitoring of EKS to maintain reliable and secure applications.
Looking to learn more about Kubernetes observability? Explore our resources on monitoring, scaling, and cost optimization for modern cloud-native teams.
What are the main components of Amazon EKS?
EKS has two major components that work together to manage your Kubernetes workloads:
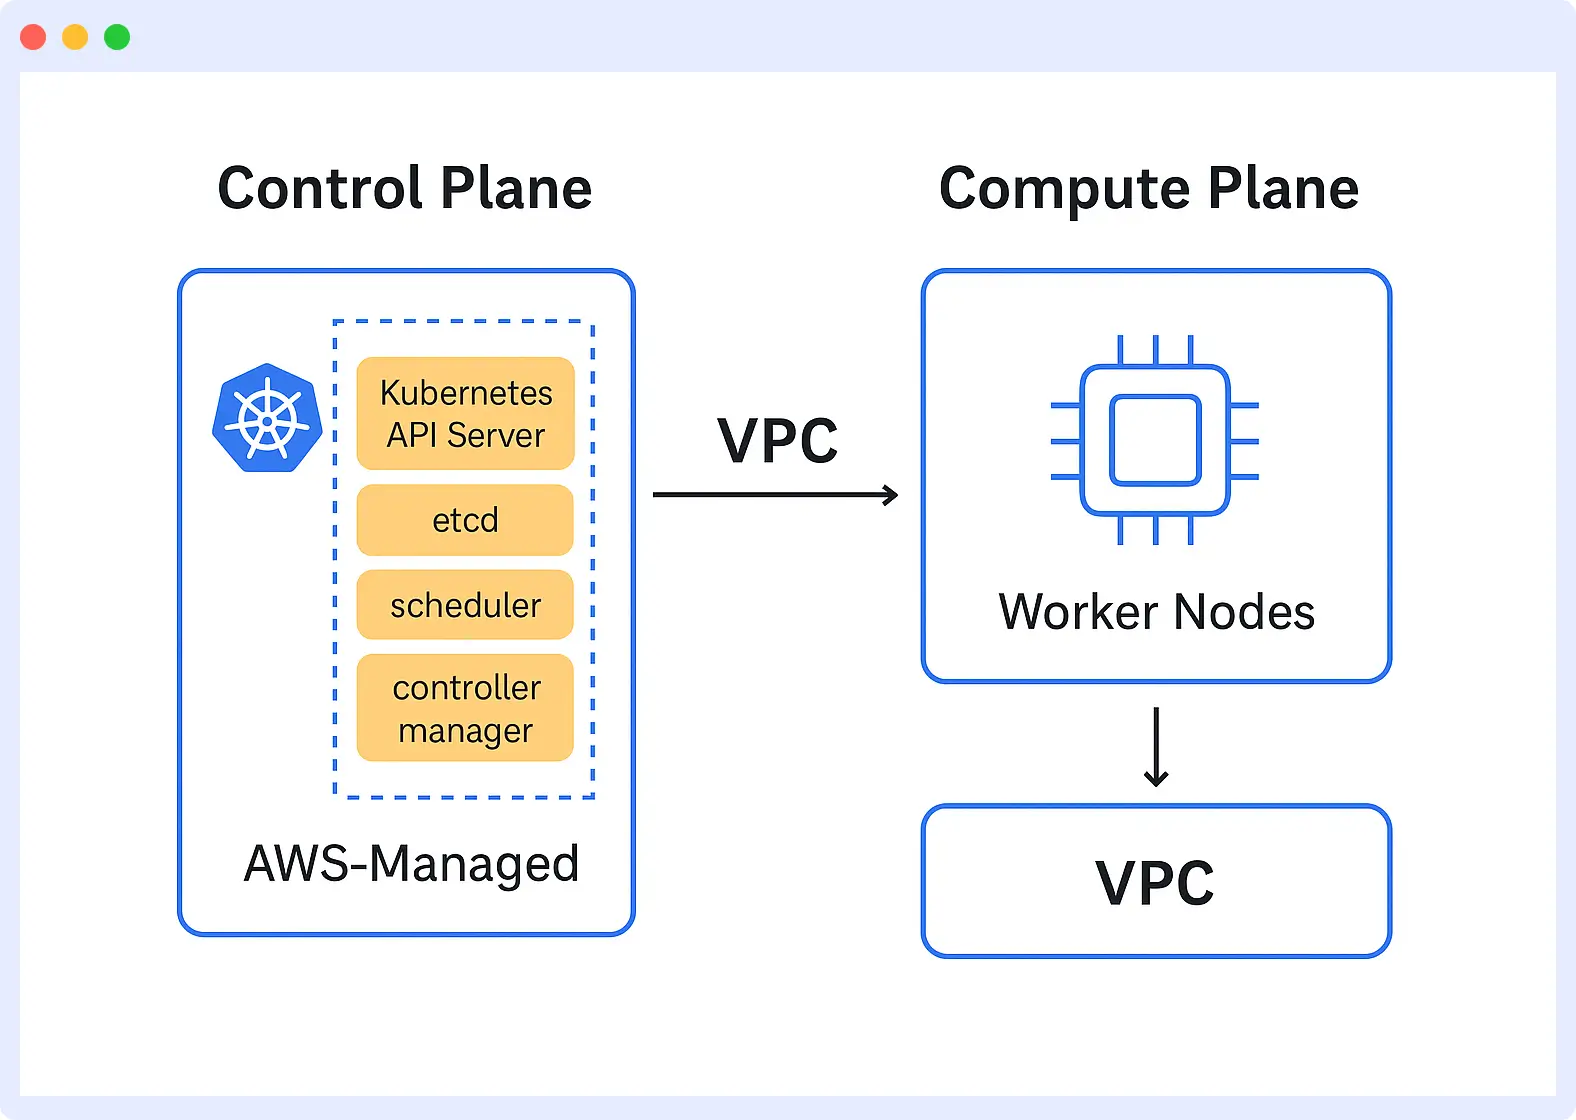
1. Control Plane
The control plane of Amazon EKS is handled entirely by AWS. It handles all the heavy lifting of running Kubernetes, including API request handling, workload scheduling, and maintaining overall cluster health. It even manages the etcd database, which contains all the significant cluster information.
2. Compute Layer
The compute layer is where your workloads execute. EKS has a number of compute options, such as managed node groups (EC2 instances), Fargate (serverless), and self-managed nodes. Whatever the choice, your pods and containers execute here, plus networking, storage, and your actual application workloads that are servicing your users.
The compute layer is where your workloads run. EKS supports multiple options: managed node groups (EC2 instances), Fargate (serverless), and self-managed nodes. Regardless of the choice, this is where pods and containers operate, along with networking, storage, and the application workloads serving your users.
What to Monitor in EKS
Effective EKS monitoring means tracking signals across infrastructure, applications, and security to ensure cluster health, performance, and compliance.
Infrastructure Monitoring
Your cluster’s foundation is the infrastructure. Monitoring its health ensures workloads have the resources and stability they need to run smoothly.
- API server latency, etcd performance, and scheduler health
- CPU, memory, disk I/O, and network utilization across worker nodes
- Pod-to-pod communication, network throughput, and storage volume performance
Application Monitoring
Applications sit on top of this infrastructure, and poor visibility can quickly impact user experience. Monitoring helps you detect bottlenecks and performance issues before they escalate.
- Container health status, restart counts, and resource consumption patterns
- Response times, error rates, and request throughput for services
- Request flows across microservices and custom business metrics
Security Monitoring
No EKS environment is complete without strong security. Monitoring for threats, misconfigurations, and vulnerabilities helps protect workloads and sensitive data.
- API requests, authentication attempts, and RBAC permission changes
- Network traffic patterns and policy violations
- Container image vulnerabilities and configuration drift
For a comprehensive overview of metrics, tools, and monitoring workflows across Kubernetes environments, read our Kubernetes Monitoring: A Complete Guide.
Why Monitoring EKS Is Important
Monitoring in Amazon EKS provides vital visibility into your clusters, ensuring workloads remain healthy, performant, and secure. Some important reasons are:
1. Operational Visibility and Health
EKS clusters are highly distributed, multi-layered systems, ranging from basic EC2 instances to pods, services, and applications. On the other hand, you cannot gauge what is going on within your cluster unless you monitor properly.
To maintain all this on track, you require insights into the health of your clusters, nodes, pod performance, and application metrics.
2. Performance Optimization
Kubernetes workloads are volatile and resource-intensive. The monitoring will allow you to understand the trends of CPU, memory, and network utilisation so that you can right-size your resources, optimise your spend, and prevent your applications from having issues.
For detailed steps on tackling slowdowns and errors, check our guide on fixing application performance issues.
3. Active Issue Detection
Instead of waiting for users to report issues, monitoring enables you to identify concerns early. This way, downtime gets reduced and user experience gets a boost.
4. Security and Compliance
EKS monitoring identifies security abnormalities, unauthorized access attempts, strange network traffic behaviors, and compliance breaches. This is important in ensuring a secure container environment.
5. Cost Management
Resource utilization monitoring identifies waste, optimizes resource allocation, and enables effective decisions concerning instance types, storage, and network costs.
EKS Monitoring Tools and Solutions
You can manage EKS with AWS-native tools, open-source solutions, or commercial tools like Middleware. The solution will vary depending on how your team works and your needs.
AWS Native Solutions
AWS offers the first set of EKS monitoring solutions. Managed services provided by AWS are easily deployable and manageable because they integrate directly with your AWS offerings. CloudWatch Container Insights monitors metrics and logs at the pod, node, and cluster levels, with integrated dashboards and alerts.
Amazon Managed Service for Prometheus (AMP) provides the functionality of Prometheus without requiring infrastructure management, and Amazon Managed Grafana (AMG) enables rich visualizations of data from various data sources.
AWS X-Ray enables distributed tracing to debug microservices and monitor performance, and AWS Distro for OpenTelemetry (ADOT) unifies telemetry data collection across metrics, traces, and logs.
Open Source Solutions
For teams that want more control over their monitoring infrastructure, there are open-source solutions that are highly customizable and give a high degree of control.
Prometheus metrics offers collection and storage, along with flexible query options, while Grafana provides rich visualization and dashboards from diverse sources.
ELK Stack (Elasticsearch, Logstash, and Kibana) gives robust log management, search, and analysis functionality for centralized logging. Fluent Bit is a lightweight log processor and forwarder that can forward data to different endpoints.
Specialized Solutions
In addition to overall monitoring offerings, some tools cover the particular requirements of EKS. Kube-state-metrics (KSM) publishes metrics of Kubernetes objects like deployments, pods, and services, assisting in monitoring the cluster resource state.
Kubernetes Metrics Server collates kubelet resource usage information and enables functionality such as horizontal pod autoscaling and cluster autoscaling. Kubecost offers cost visibility and optimization, revealing spend by namespace, deployment, or service in real-time, assisting in managing Kubernetes costs.
For a deeper look at monitoring across Kubernetes environments, see our complete guide on Kubernetes Monitoring
Monitoring EKS with Middleware
Using Middleware to monitor your EKS cluster provides easy visibility into all of your nodes, pods, services and applications without the complexity of managing multiple separate tools.
Unlike AWS-native solutions that require integrating CloudWatch, X-Ray, and Managed Grafana separately, or open-source setups that demand significant configuration overhead, Middleware offers unified observability in a single platform.
What Makes Middleware Stand Out
- Unified observability: All metrics, logs, traces, and alerts in one platform instead of switching between multiple tools
- Real-time alerting: Intelligent alerts with context and correlation across your entire stack, not just isolated metrics
- Reduced operational overhead: No need to maintain separate Prometheus instances, Grafana dashboards, or log aggregation pipelines
- Easy setup: Deploy monitoring across your entire EKS environment with a single Helm command
- Cost predictability: Transparent pricing without the complexity of managing multiple AWS service bills
Middleware connects directly to your Kubernetes cluster to collect metrics, logs and events, providing real-time insights into cluster health and performance.
Instead of managing separate tools for infrastructure monitoring, application tracing, and log analysis, Middleware provides a single solution that covers infrastructure, application, and security observability for your EKS workloads.
See Middleware in action with a free trial.
Key Metrics Tracked
Middleware monitors your cluster across several levels:
- Node Metrics: disk I/O for worker node, CPU, memory, network usage.
- Pod Metrics: Resource usage, reboots, and container health.
- Service Metrics: Response rates, response times, and error rates.
- Application Insights: Traces calls through microservices and points out performance bottlenecks.
Connecting Your EKS Cluster to Middleware
To monitor your EKS cluster using Middleware, you must first install the Middleware agent. The agent is a stateless program that executes on your cluster nodes, gathering metrics, logs and traces, and securely transmitting them to the Middleware platform.
The installation command contains parameters that enable your cluster data to be correctly identified and sent to the Middleware.
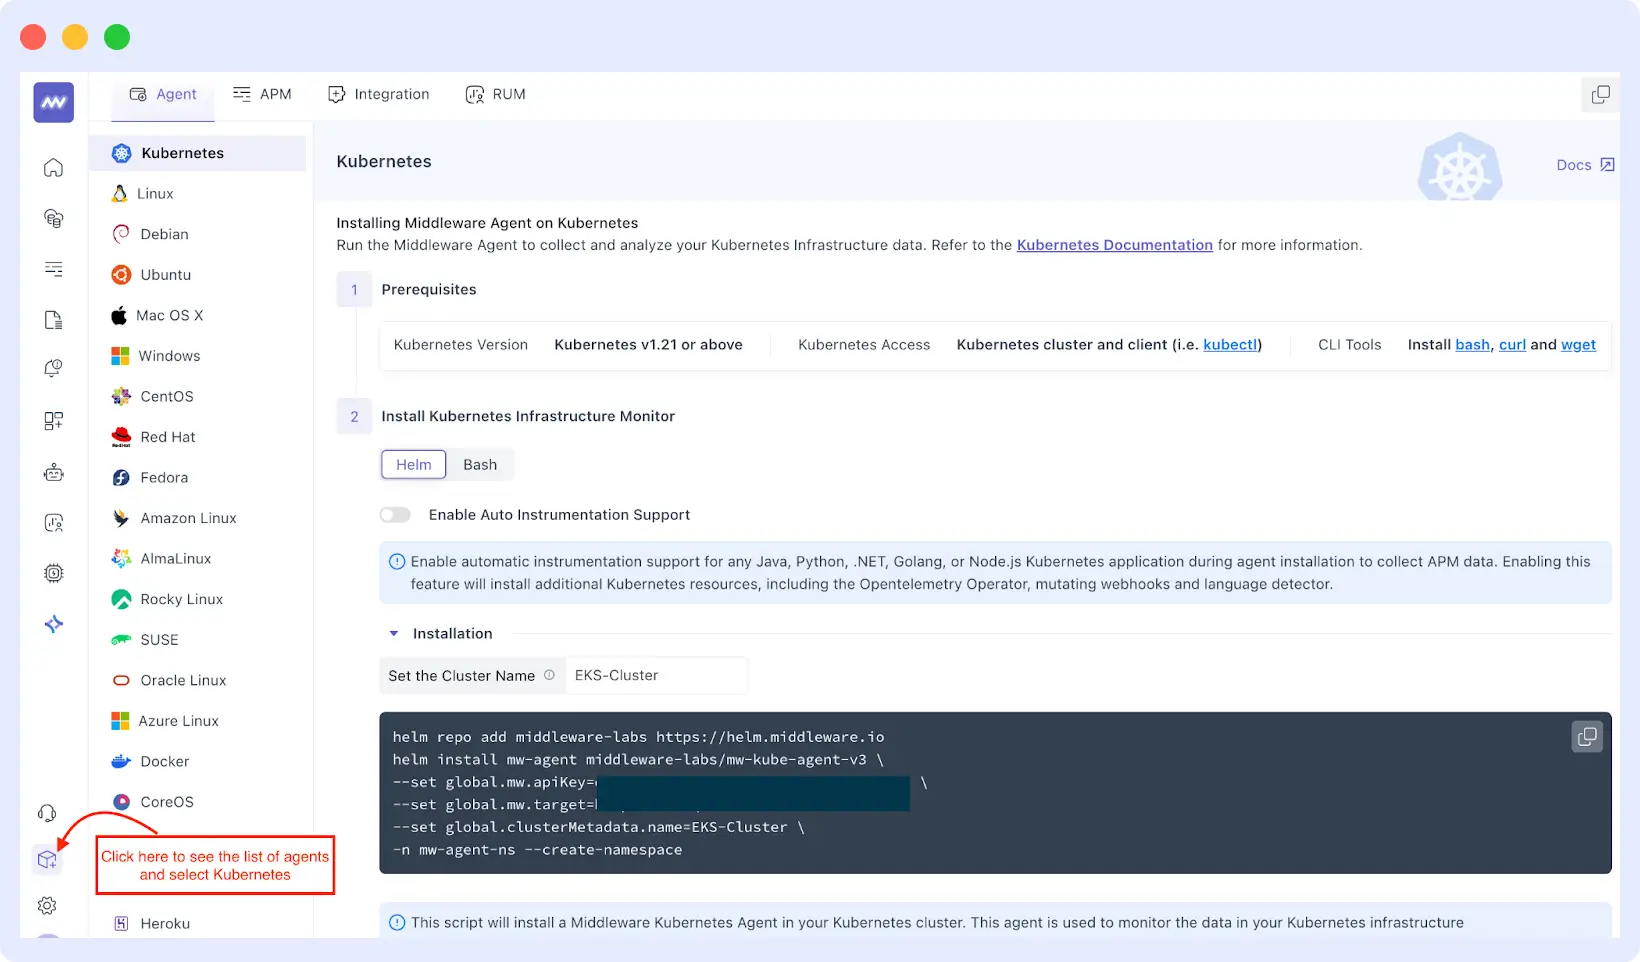
Installing the Middleware Agent
You can install the Middleware agent on your EKS cluster using either Helm or Bash. Select the most appropriate method that aligns with your workflow.
Using Helm
To deploy the Middleware agent to your EKS cluster using Helm, run the following command in your terminal. Once you have made an account on Middleware, an API key and any additional credentials will be provided.
To identify your clusters, you also have the option to assign them a custom name.
helm repo add middleware-labs https://helm.middleware.io
helm install mw-agent middleware-labs/mw-kube-agent-v3 \
  --set global.mw.apiKey= \
  --set global.mw.target= \
  --set global.clusterMetadata.name= \
  -n mw-agent-ns --create-namespace
Using Bash
Alternatively, you can install the Middleware agent directly with a Bash script. Replace the placeholders with your credentials and cluster information.
MW_API_KEY= MW_TARGET= bash -c "$(curl -L https://install.middleware.io/scripts/mw-kube-agent-install-v3.sh)"
Confirm Middleware Agent Deployment
After installing the Middleware agent, run the following commands to ensure it is running correctly:
kubectl get daemonset/mw-kube-agent -n mw-agent-ns
kubectl get deployment/mw-kube-agent -n mw-agent-ns
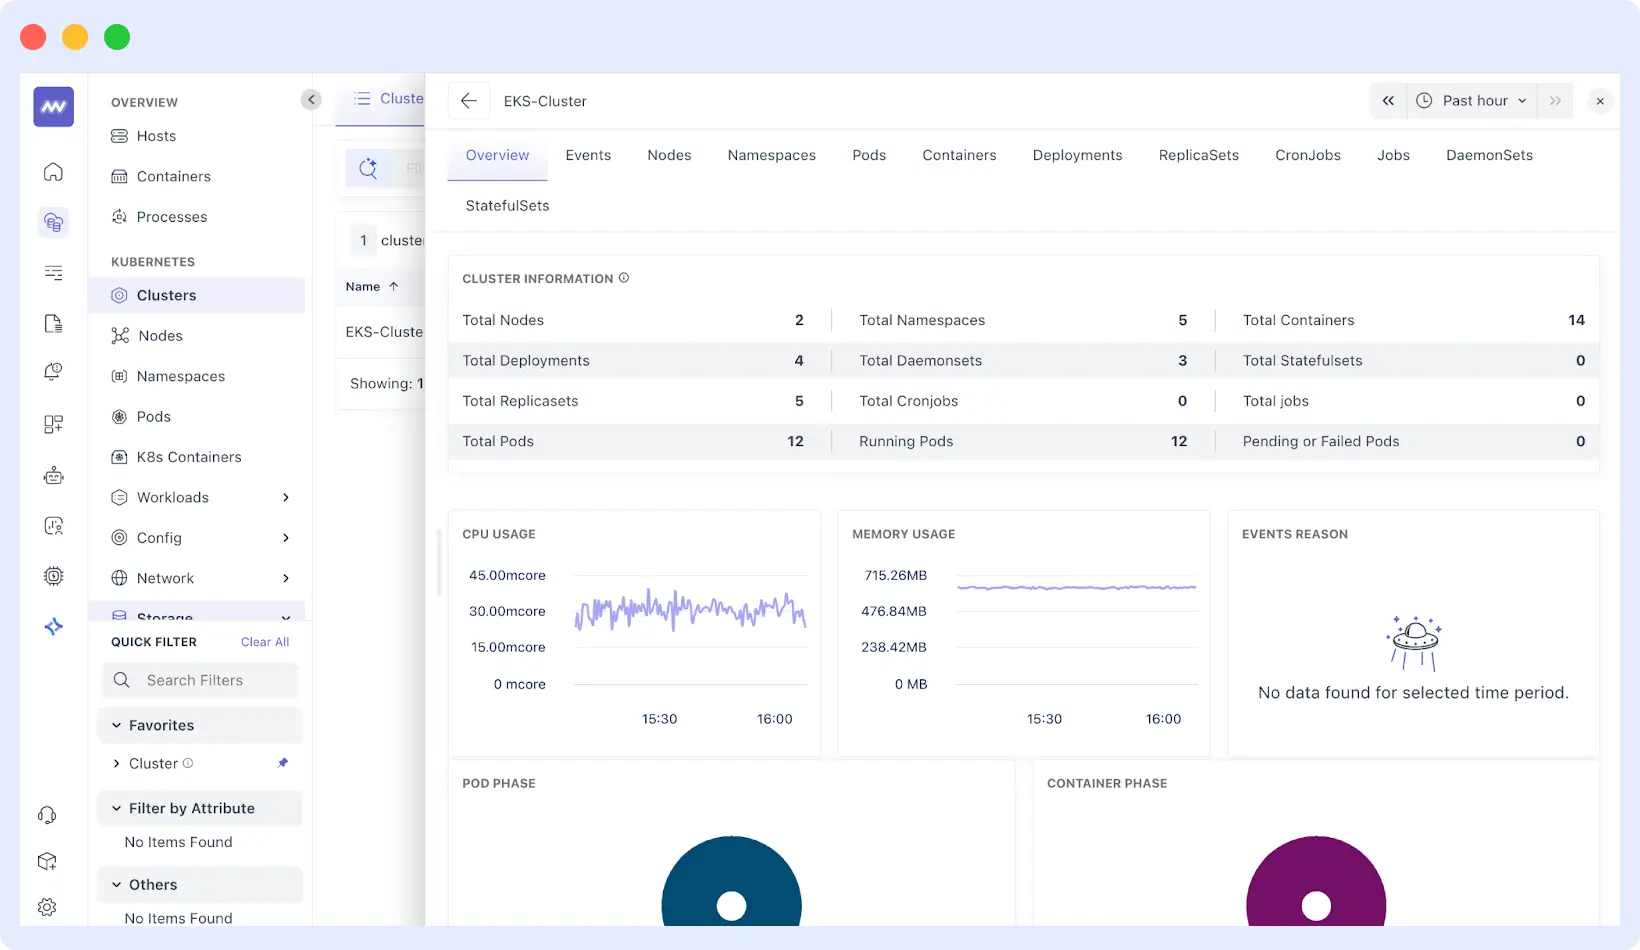
Using the Middleware Dashboard
Once you’ve deployed and confirmed the Middleware agent, proceed to your Middleware account Infrastructure section. There is a dashboard for your EKS cluster, named after the one you chose during the installation process.
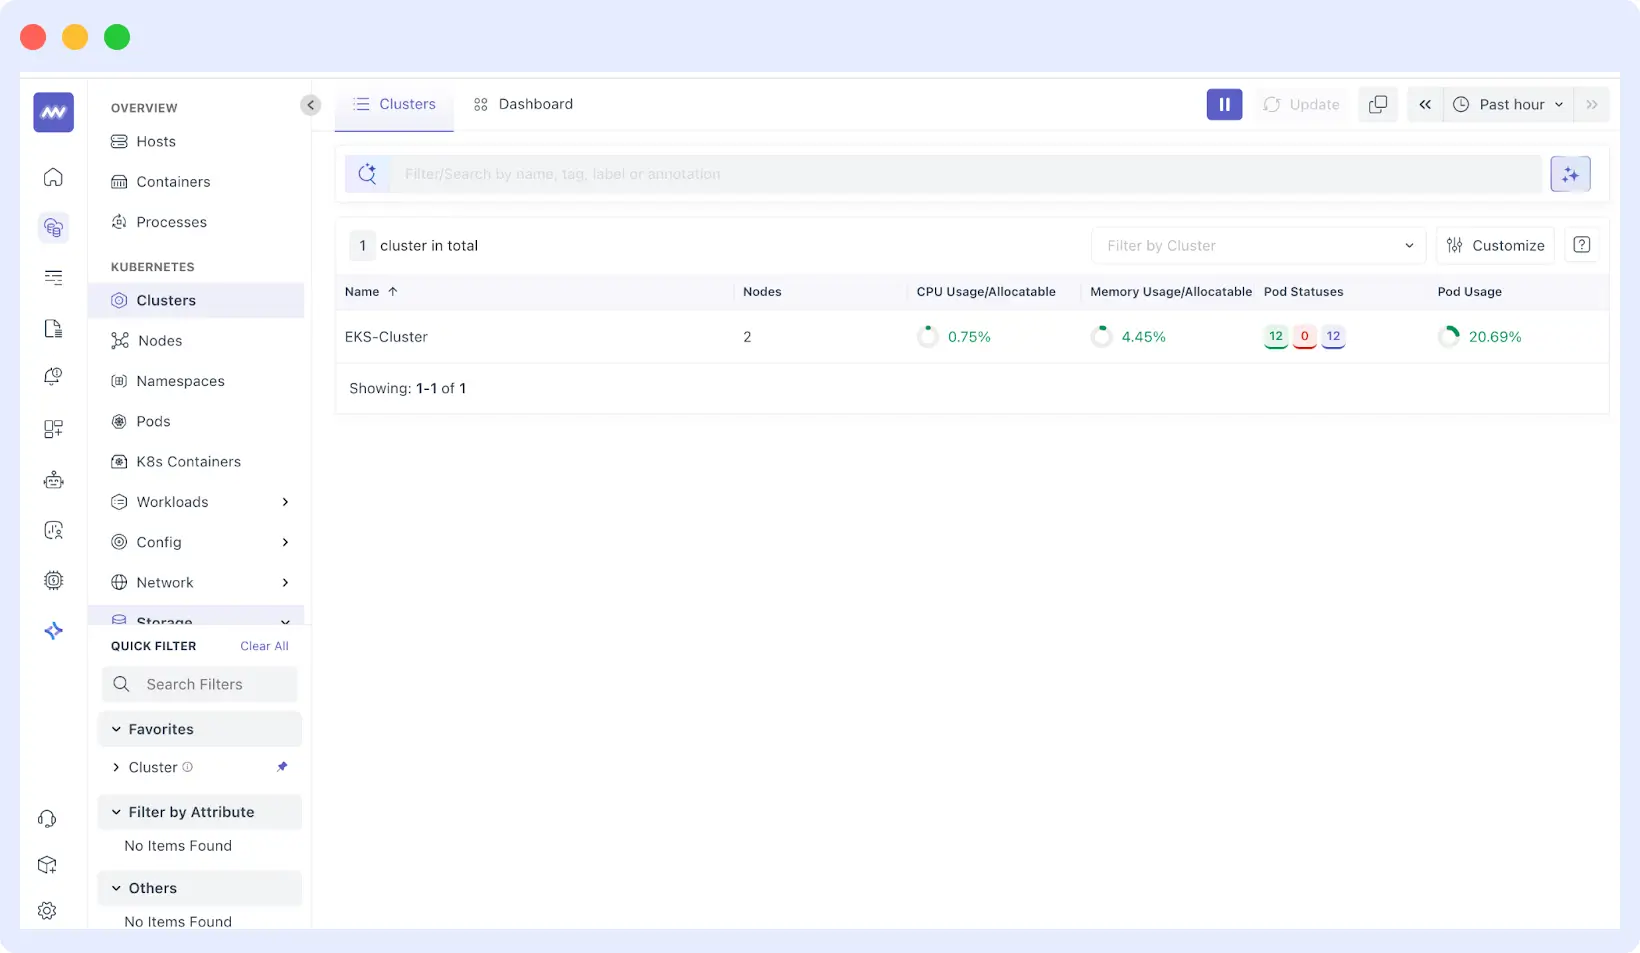
The dashboard is an overview of cluster health and performance at a high level and includes:
- Nodes: CPU, memory, disk usage, and health of each worker node.
- Pods: Pod states (Running, Pending, Failed), resource consumption, and logs.
- Deployments and Services: Application metrics including slow rates, error rates, and throughput rates.
EKS Monitoring Tool Comparison
| Feature | Middleware | AWS Native Tools | Open Source Tools |
| Ease of Use & Setup | One-command deployment with minimal configuration | Requires setting up and integrating multiple services. | Complex installation, integrations needed |
| Alerting | Unified dashboards and alerts across all data sources. | Requires configuring dashboards and alerts in multiple services. | Requires setting up alerting rules and dashboards in separate tools |
| Cost | Free tier and transparent pricing | Pay per service + hidden costs (data ingestion, API calls) | Free, but high operational cost in time/resources |
| Observability | Metrics, logs, and traces in a single platform. | Requires using and integrating multiple services | Requires integrating multiple tools (e.g., Prometheus, ELK Stack). |
| Scalability | Automatically scales with your cluster as a SaaS solution. | Managed services automatically scale with demand. | Requires manual configuration and management to ensure scalability. |
| Maintenance Overhead | Middleware handles updates, scalability, and infrastructure. | AWS manages the underlying services, but you manage the integrations. | You are responsible for managing all components, including scaling, security, and updates. |
Best Practices for Monitoring EKS
- Use sufficient resources to monitor agents, usually 200m CPU and 256Mi memory per node.
- Set alert thresholds based on the expected behavior of your application, rather than generic defaults.
- Target on user-relevant measures like the response times and the error rates of critical alerts.
- Review and make changes to your monitoring setup regularly as applications change to avoid alert fatigue.
- Combine metrics, logs, and traces to have a comprehensive perspective of cluster health.
- Monitor infrastructure, applications, including deployed services and business-level metrics.
Companies adopting better observability strategies often see tangible results. One such example is MindOrigin.
MindOrigin: 75% Reduction in Observability Costs
MindOrigin, a fintech company, achieved a 75% reduction in observability costs by streamlining infrastructure management and unifying log data with Middleware. This transformation led to a 50% faster Mean Time to Resolve (MTTR) and a 75% quicker root cause analysis, significantly enhancing operational efficiency.
“We faced significant issues with our previous tools, including limited visibility and high costs. The lack of comprehensive observability made it difficult to correlate logs, traces, and metrics in one platform, while tools like Datadog, although effective, came with prohibitive costs that escalated as our infrastructure grew.”
Krishna Charan BS, Information Security Head, MindOrigin
Conclusion
EKS monitoring doesn’t have to be complex, but it is essential. As your Kubernetes workloads grow, comprehensive visibility into infrastructure, applications, and security becomes non-negotiable.
Whether you use AWS tools, open-source solutions, or a unified platform, the key is actionable insights before issues affect users. Start with the basics, monitor what matters most, and refine your strategy as your environment evolves.
Ready to simplify EKS monitoring? Try Middleware for unified observability across your EKS clusters. Start your free trial today and see how easy EKS monitoring can be.
📚 Also Read
☸️ Kubernetes Monitoring – Best practices and tools for monitoring Kubernetes clusters effectively.
📘 Application Performance Monitoring (APM) – A complete guide to monitoring, analyzing, and improving application performance.
☁️ Middleware vs AWS CloudWatch Monitoring – Compare features, benefits, and limitations of both platforms for cloud monitoring.
📝 AWS CloudTrail Logs – Understand how to monitor and analyze AWS CloudTrail logs for auditing and compliance.
🔍 Analyze AWS CloudWatch Resources – Learn how to monitor, visualize, and optimize AWS resources using CloudWatch.
⚡ AWS Monitoring Best Practices – Essential strategies to monitor your AWS environment efficiently and securely.


