Imagine, for a moment, that your system is down at 2 AM and you’re scrambling between 4 separate screens. You’re reviewing logs with ELK Stack, monitoring metrics with Grafana, analysing traces with New Relic, and looking for errors with Sentry. Relatable? If so, you’re not alone; most engineering teams are struggling with this level of tool/solution chaos and spend a fortune on license fees for several standalone solutions that don’t talk to one another.
During that 2 AM outage, while you switched from Console A for logs, Console B for traces, and Console C for dashboards, your customers experienced downtime that you could have resolved in half the time.
Let’s stop this loop and discover why progressive engineering teams are starting to consolidate their observability stack into a single (and most potent) solution like Middleware.
What Middleware Replaces?
Middleware is your one monitoring tool instead of a bunch of costly tools. Let me show you precisely what gets discarded and how much your life improves!
Splunk is ridiculously expensive, and ELK is a pain to maintain. With Middleware, you get the same level of logging, search, and analytics, but without the headache. All your logs are in one place with sensible indexing. You can avoid going back and forth between different log viewers while paying licensing costs for multiple products.
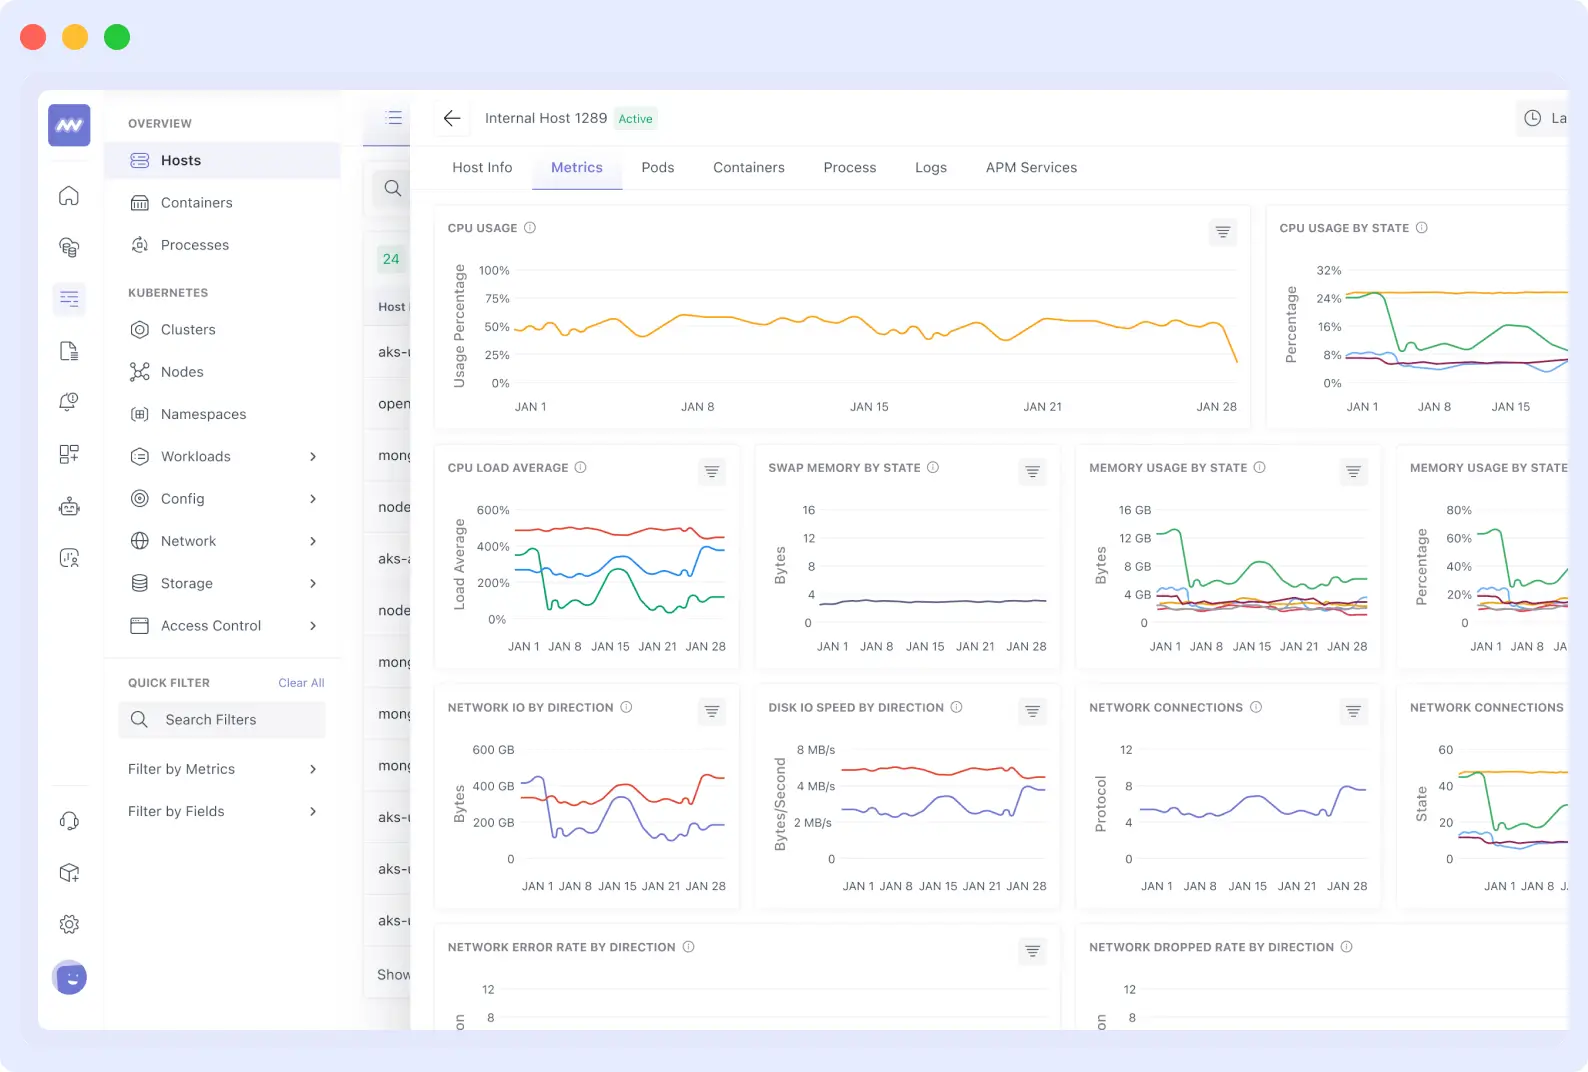
Metrics Collection + Dashboards
Remember how you had to set up Prometheus to collect metrics, then set up Grafana to visualize them? That’s two tools you have to maintain and monitor.
Middleware has everything built in; it collects metrics on its own and generates beautiful dashboards with no complicated tasks. You can create custom charts in minutes, not hours.
APM + Distributed Tracing
Those expensive APM tools that charge per host or transaction? Middleware traces the entire lifecycle of your requests across the whole system. You can identify where slowdowns occur and which services are the culprits.
💡 Learn more about how APM improves customer satisfaction and why unified tracing changes everything.
The beauty of it all? You have the complete picture, with traces, logs, and metrics all in one interface.
Error + Session Monitoring
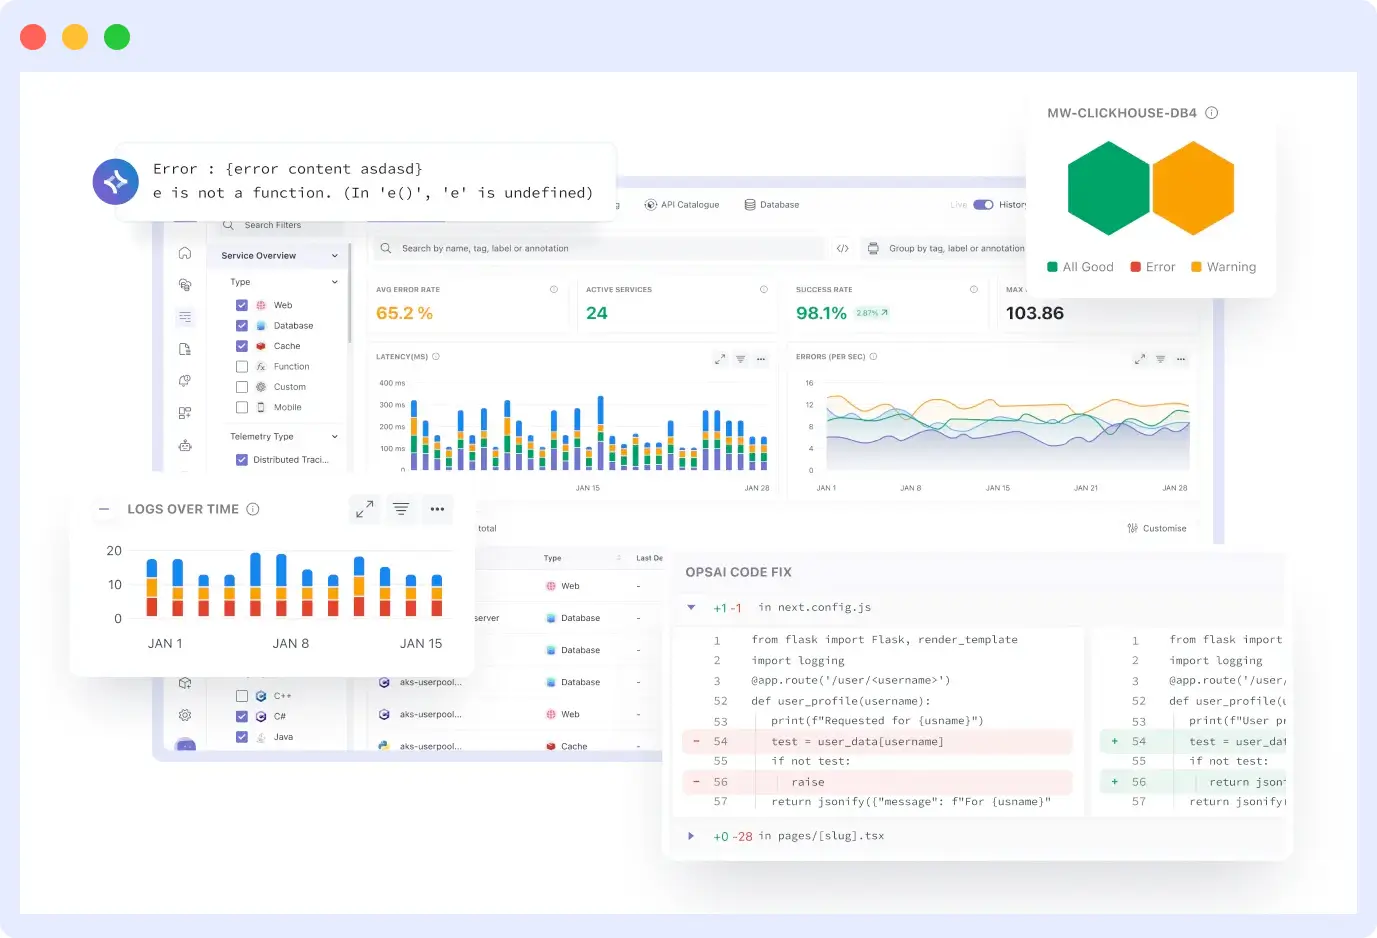
Instead of receiving error notifications in one tool and trying to stitch together what users were doing, middleware intelligently groups related errors.
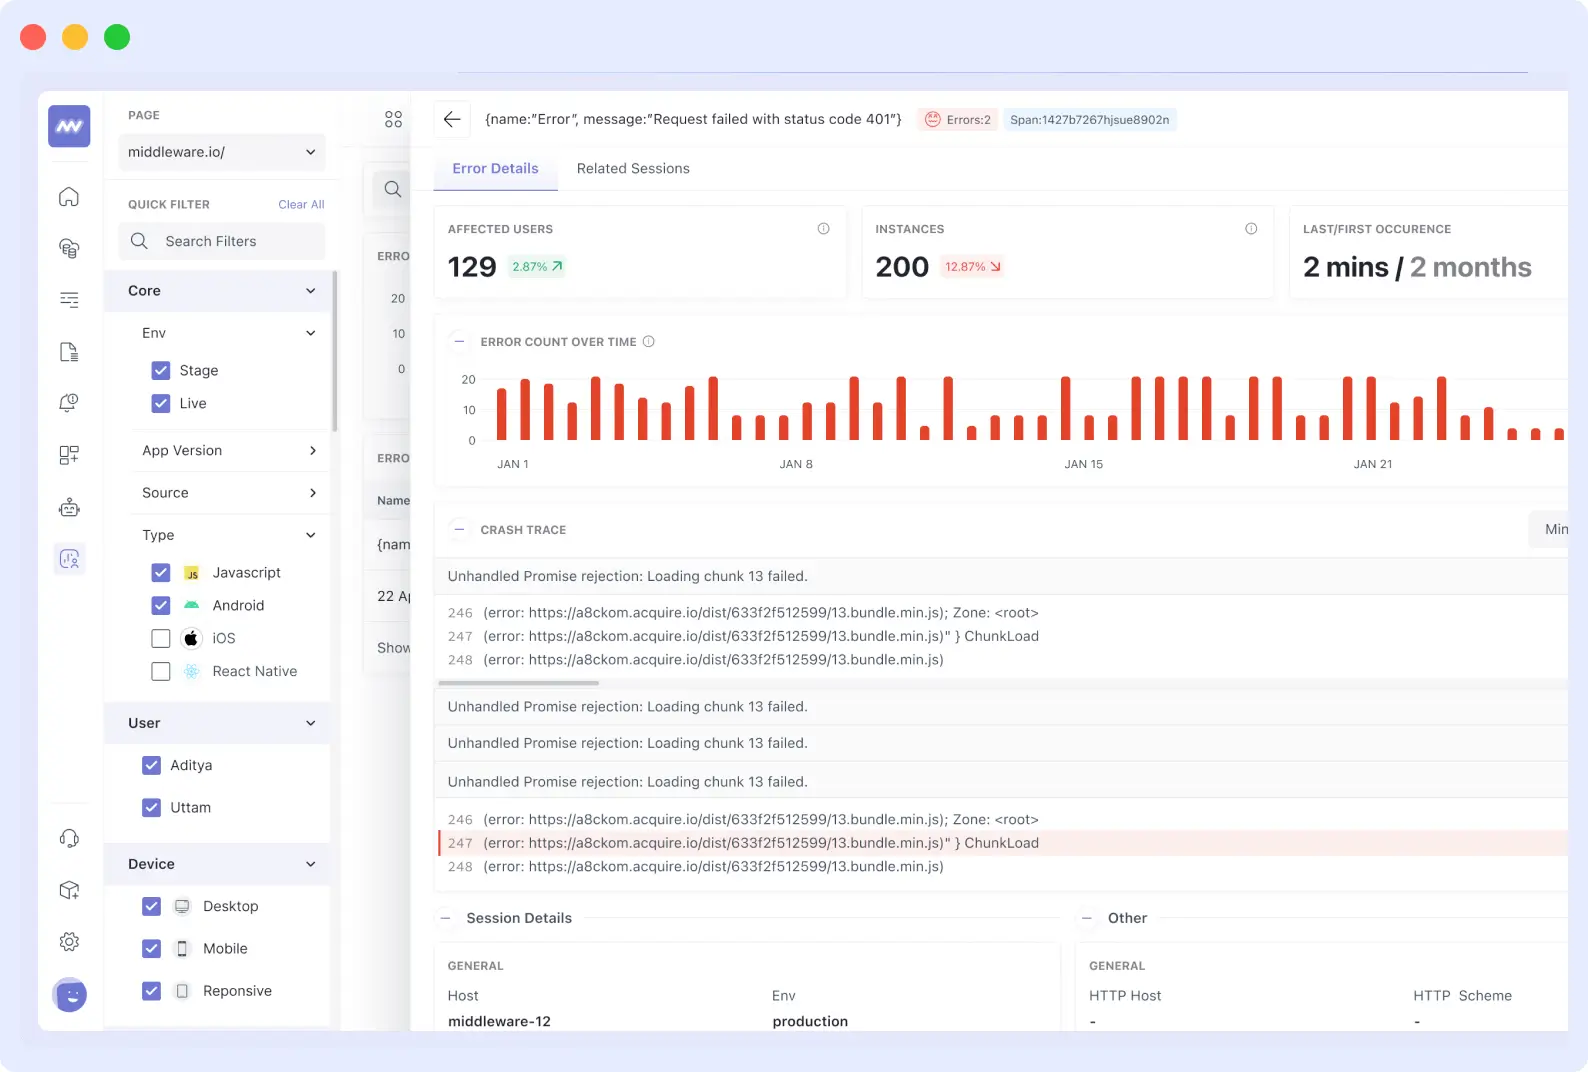
You see the full user impact, not just that something broke, but also how many customers were affected and what they were trying to do when the error occurred.
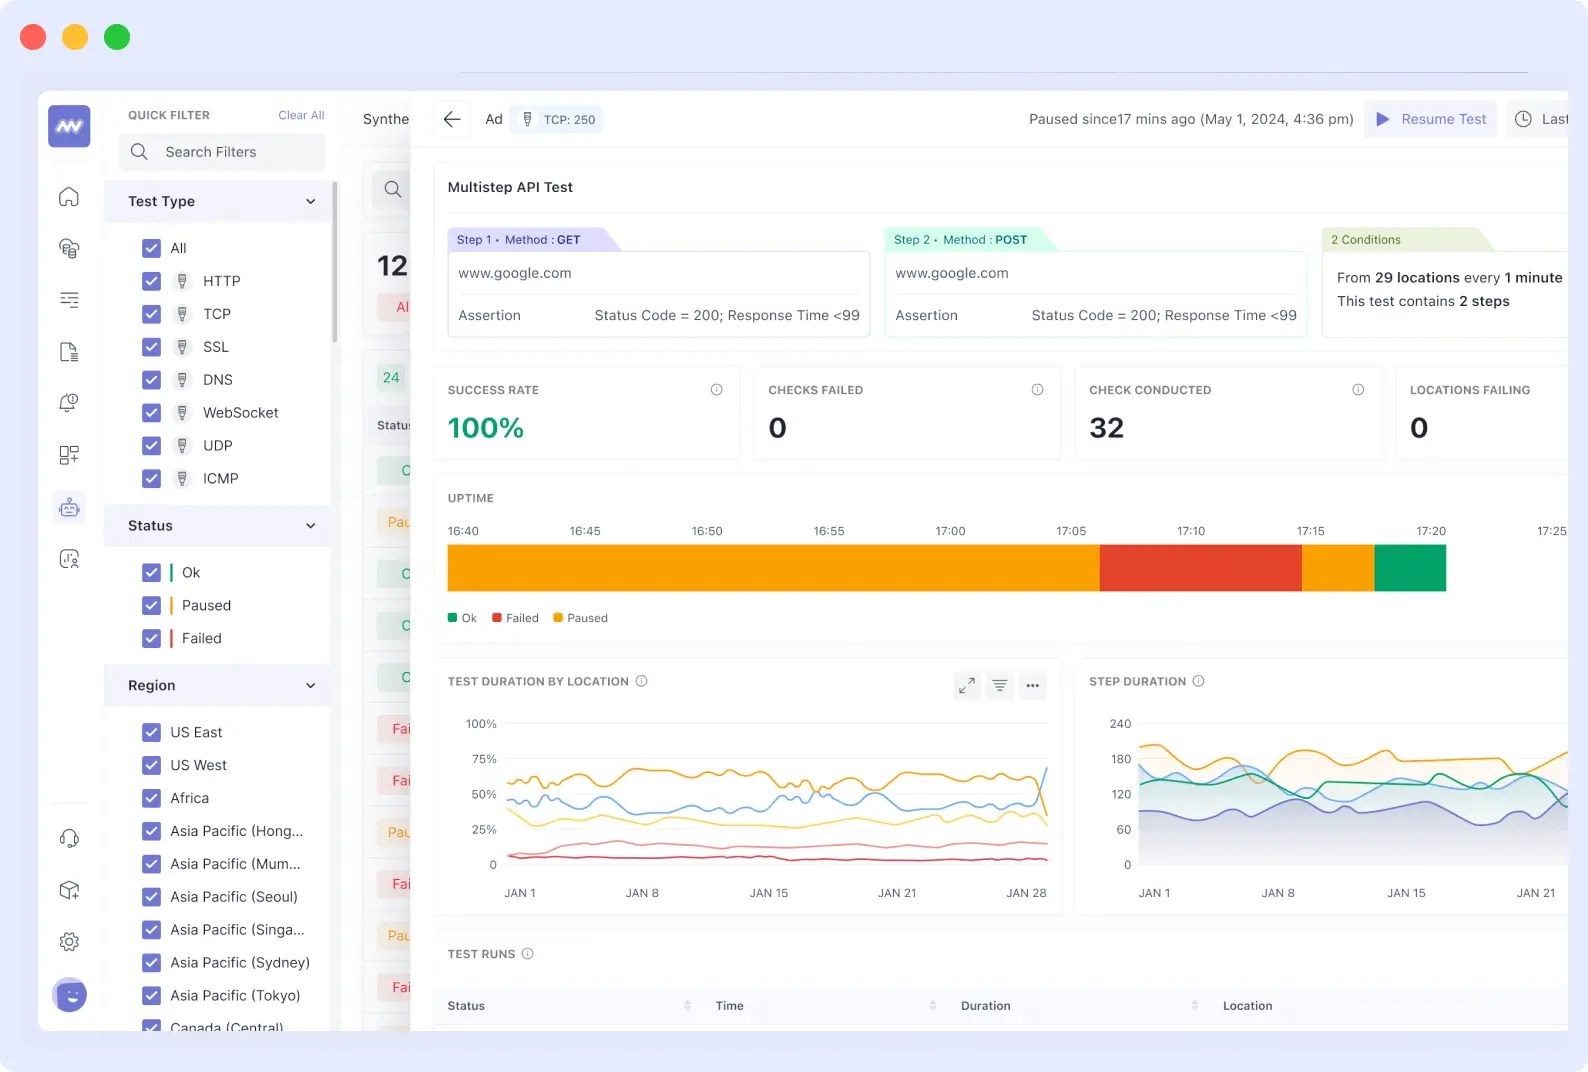
Alerting + Incident Management
No more scrambling between PagerDuty alerts and trying to hunt down runbooks in disparate systems. When things go wrong, Middleware provides an alert with full context and step-by-step runbook guidance right there.
💡 Want to optimize alert management and reduce unnecessary tool spend? Learn how to reduce IT costs with Middleware’s unified Observability platform.
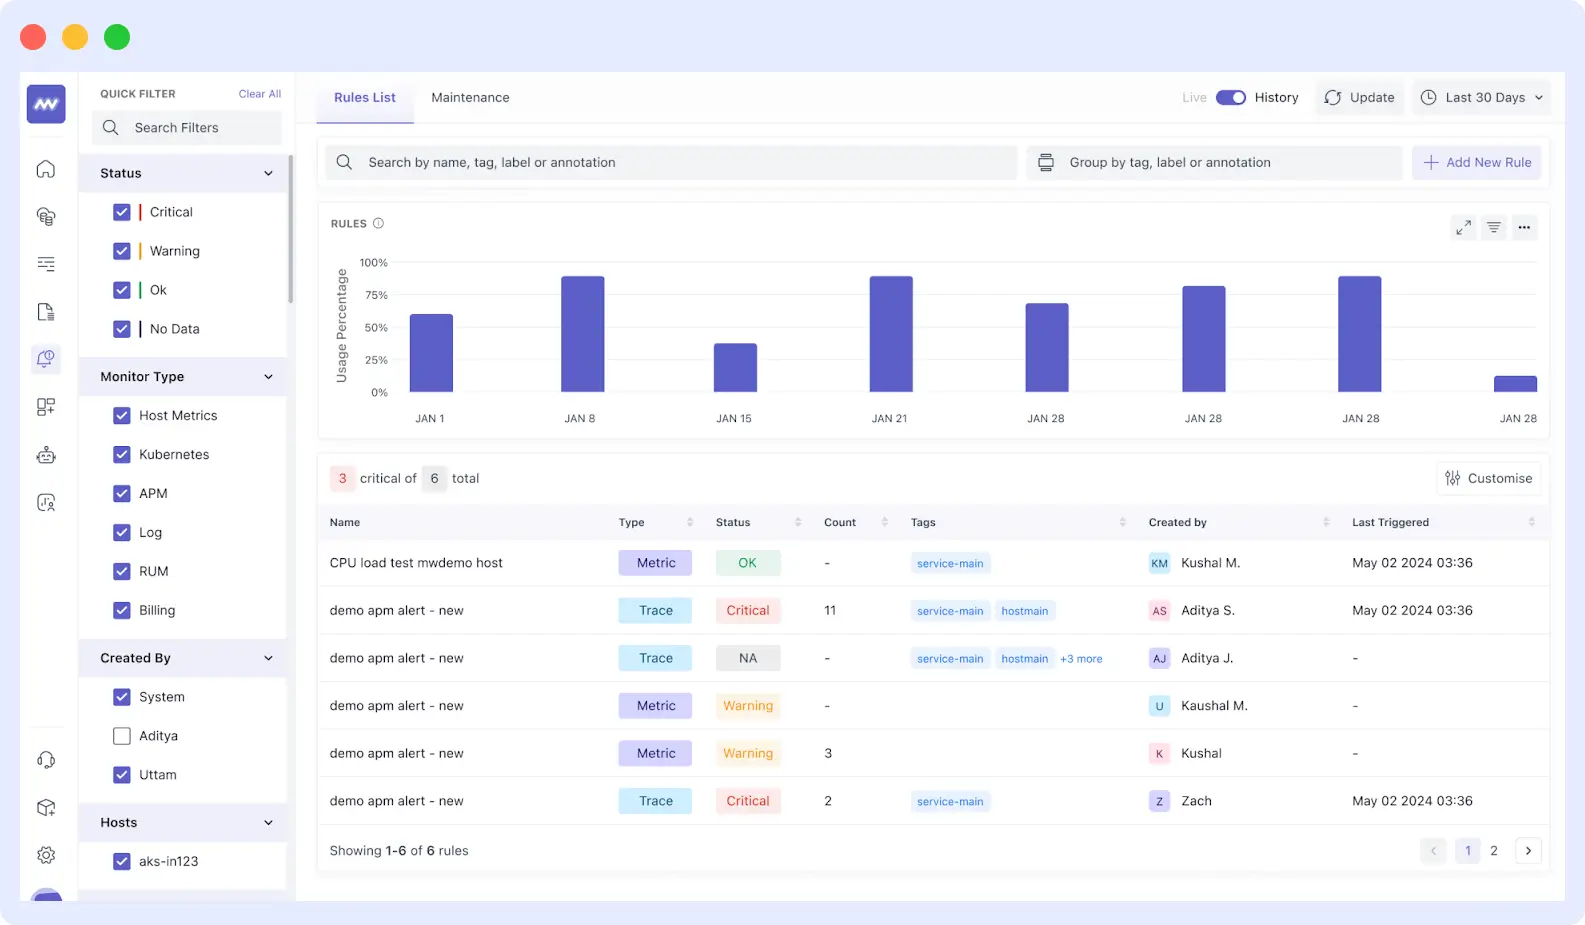
Your team will be able to resolve issues more quickly because everything they need is readily available at their fingertips.
🚨Turn Alerts into Actionable Insights
Stop alert fatigue. Middleware helps your team act on the right alerts at the right time with clear runbooks and full incident context.
Before / After: The Engineering Experience
Allow me to show you what your daily experience is like today, and what it could be like in the future.
The distinction is quite frankly night and day, and once you see it, you’ll think to yourself, Why did I take so long to switch.
Before (Living with 3–4 Tools)
Your day begins with accessing the four tabbed browsers to see what happened overnight. You are in Splunk, reviewing application logs; in Grafana, examining system metrics; and in the New Relic dashboard, looking for performance traces. Then, don’t forget to check all of this with Sentry for error reports. Each tool requires a login, has a distinctly different interface, and all provide you with the same time frame simultaneously.
When there’s an incident, it feels like a crime scene, where investigators must examine a world full of clues. You’re seeing a spike in errors in Sentry, but you need to dive back into the ELK logs to make the correlation between what users were doing.
Additionally, you’re paying for the ingestion of all these programs, and as we’ve learned, those costs can add up to a significant amount. Any new team members? Onboarding across all these tools can be a challenge.
After (One Middleware Platform)
Picture a single tab in your browser where everything is ready for you. Your metrics, traces, logs, and dashboards all track the same events. If you click an error, it will take you directly to the logs and performance data; no detective work is required, the story unfolds.
The stunning part is the incidents. Instead of switching platforms and applications, you would receive AI recommendations with indications of where to look for the root cause.
False alarms become very uncommon; the system understands the context of your alerts. If you need to pull another team into the conversation, they receive the full context in real-time, eliminating the need for “can you send me the logs?” conversations.
Core Benefits of Using Middleware
Unified Visibility
Everything you need is finally in one place, eliminating the need for tab-switching marathons or for remembering which tool displays which data. When you investigate an issue, you see logs, metrics, traces, and user impact all connected to the same timeline, giving you the complete story instantly.
AI-Driven Debugging & Root Cause Analysis
Rather than spending hours hunting through logs, AI algorithms bring you straight to the issue. The platform learns from past incidents and suggests likely causes based on similar incidents, helping you become a debugging superhero who can fix issues within minutes, not hours.
💡 Want to see how GitHub commit and ownership data can accelerate your debugging process? Explore our detailed guide on GitHub Commit Ownership & Error Tracking to learn how Middleware’s Ops AI connects errors to the exact code changes and owners in seconds.
Faster Mean Time to Recovery (MTTR)
Your incident response time is significantly reduced when the software is connected. You skip the data-gathering phase and get straight to solving the actual issue, which means your customers have a shorter outage and your team is considerably less strained during a crisis.
💡 Learn practical ways to reduce MTTR and speed up incident response in our guide: How to Reduce MTTR.
Reduced Total Ownership Cost
Not only are you saving on licensing costs, but you are also eliminating unforeseen integration costs, the training required for different tools for all team members, and duplicate storage. One platform equals one contract, one support team, and one skill set to support.
Easier Collaboration & Knowledge Re-Use
When everyone is on the same platform, sharing knowledge is easy. New team members ramp up faster, senior engineers can pass on knowledge without it walking out the door when employees leave the company, and troubleshooting will remain within the team
3–4 Engineering Tools vs Middleware
Here’s exactly what changes when you make the switch, and trust me, the differences are eye-opening.
| Capability / Experience | Typical 3–4 Tools (logging + metrics + APM + dashboards) | Middleware (single platform) |
| Data Sources During Incidents | Slow correlation means more extended outages, and customers wait while you piece things together. | Multiple licensing fees, separate ingestion costs, and duplicate storage charges are adding up fast. |
| Cost Drivers | Multiple ingestion + licensing fees; duplicate storage | Single ingestion model + optimized retention → lower cost. |
| Debugging Experience | Tab-switching nightmare, manual detective work, guessing what caused what | AI points you to the root cause, and a single timeline shows exactly what happened when |
| MTTR impact | Higher (slow to correlate) | Lower (automated causal analysis) |
| Training New Team Members | Multiple logins, different interfaces, and separate authentication systems to learn | One platform, one login, one way of working, new hires are productive in days, not weeks. |
| Team Collaboration | Scattered alerts, separate dashboards, and information silos between team members | Shared incident views, built-in runbooks, and everyone sees the same data and context. |
High-Level Migration Approach
The best part? You don’t have to rip out everything at once. Start with one service, see the benefits immediately, then gradually migrate the rest of your stack with zero risk to your existing monitoring.
💡 Curious about the real-world impact of switching to Middleware? Explore our comprehensive guide on What to Expect When You Switch to Middleware (Day 0 – Week 4) to see how teams transition from setup to full ROI.
Your Step-by-Step Migration Roadmap
Step 1. Audit your current telemetry
Before doing anything, take stock of what you are already collecting. Write down all the tools you are using, what data they are ingesting, and what you are spending on each of them. This audit serves as a baseline for measuring future success and helps ensure you do not “forget” any critical monitoring during the transition.
Step 2. Start with OpenTelemetry
Here’s where the real benefit comes from: you should use OpenTelemetry standards from the start. Why? This gives you the flexibility to send telemetry to multiple destinations simultaneously. Thus, you are never locked into any single vendor. Think of it as your insurance policy to keep all doors open.
Step 3. Run a non-critical parallel pilot
Select one non-critical service and run your old monitoring alongside your new middleware. This side-by-side comparison lets you assess results, build confidence in the new system, and train your team in a non-pressured environment. You will quickly realize how much more enjoyable life becomes when you have one source of truth.
Step 4: Validate SLOs & Critical Queries
Confirm that all your alerts, dashboards, and service-level objectives are the same (or better) on the new platform. Test your most essential queries and make sure your on-call team can find everything they need. Ensure that there are no surprises when responding to operational incidents.
Step 5: Cutover & Decommission
Once you are confident that everything works, cut over and start decommissioning your old tools one at a time. Celebrate those cancelled subscriptions renewals, your finance team will appreciate seeing fewer items on the budget.
What Teams Are Saying?
Please don’t take my word for it, find out what engineering teams that switched have experienced day after day.
“We chose Middleware because it provides a robust observability platform that combines advanced monitoring, logging, and tracing features at a significantly lower cost compared to competitors like Datadog. Its cost-effectiveness, coupled with its scalability and ease of integration, made it the ideal choice for our infrastructure monitoring needs.”
Krishna Charan BS, Information Security Head, MindOrigin
“Middleware transformed our observability practices. In the brief time we have spent on the platform, it has made bug resolution more efficient and proactive.”
Akshat Gupta, Trademarkia
Ready to Transform Your Observability Stack?
After reading this article, you are now aware of the challenges posed, you have a clear understanding of the solution, and you recognize the favorable outcomes. At this point, the question is not whether unified observability will enhance your team’s existence. Instead, the question is how soon you want to reap the benefits.
In 15 minutes, you will witness how your fragmented monitoring process is replaced with unified observability that actually makes sense. Or get started for free and take advantage of Middleware’s Free tier with built-in usage. Zero commitment, zero hassle. Just explore how much value you can unlock without paying a thing.
💡 Curious about how Middleware fits your usage and budget? Explore Pricing for Your Usage and see which plan works best for your team.
Your 2 AM self will thank you, your team will thank you, and your budget will absolutely thank you.


