



TL;DR
- AI compresses the gap between “something’s wrong” and “here’s why” — without replacing engineers
- Middleware OpsAI is an AI agent that detects, investigates, explains and fixes production incidents automatically
- Anomaly detection catches issues before they cross alert thresholds
- Log clustering + natural language queries replace manual log searching
- Automated root cause analysis cuts 30-minute investigations to 5 minutes
- Smarter alerting reduces noise so real incidents never get missed
- The result: less reactive firefighting, more proactive reliability
Production incidents have always followed a predictable and painful pattern. An alert fires. An engineer gets paged. They open logs, search for the relevant time window, correlate that with a recent deployment, check dashboards across three different tools, and somewhere in that 40-minute scramble, they find the cause. By then, users have already noticed.
That pattern hasn’t changed much in the last decade. The tools got better looking. Dashboards got more panels. But the core debugging workflow stayed the same: a human reading signals, manually connecting dots, racing against a degrading system.
AI is changing that. Not by replacing the engineer, but by compressing the time between “something is wrong” and “here is what is wrong and why.” Tools like Middleware’s OpsAI are purpose-built for exactly this giving on-call engineers an AI agent that detects, correlates, and explains incidents in real time.
A 2024 GitHub survey found that over 97% of developers are now using AI tools at work and the impact is moving beyond code generation into how teams operate and debug in production. This guide covers where that change is actually happening in 2026, what it looks like in practice, and what it means for how DevOps teams structure their incident response.
Meet Middleware OpsAI: your AI SRE agent
Before diving into individual capabilities, it’s worth understanding the product that ties them all together.
Middleware OpsAI is an AI-powered operations agent built directly into the Middleware observability platform. Unlike standalone monitoring tools, OpsAI doesn’t wait for an engineer to start the investigation it starts automatically the moment something looks wrong.
Here’s what OpsAI does end-to-end:
| Stage | What OpsAI Does |
|---|---|
| Detect | Spots anomalies across metrics, logs, and traces using adaptive baselines |
| Correlate | Maps signals across your service dependency graph to find the origin |
| Explain | Surfaces a plain-language incident summary with ranked probable causes |
| Recommend | Suggests fixes based on what resolved similar past incidents |
| Fix | Applies the fix directly restarting services, rolling back deployments, or executing remediation actions without waiting for manual intervention |
The result: your on-call engineer arrives at a partially completed or already resolved incident, not a blank screen and a flashing alert.
👉 Explore Middleware OpsAI — See how the AI agent works across your full stack.
The traditional debugging workflow and where it breaks down
Before getting into what AI changes, it helps to be precise about what the old workflow actually costs.
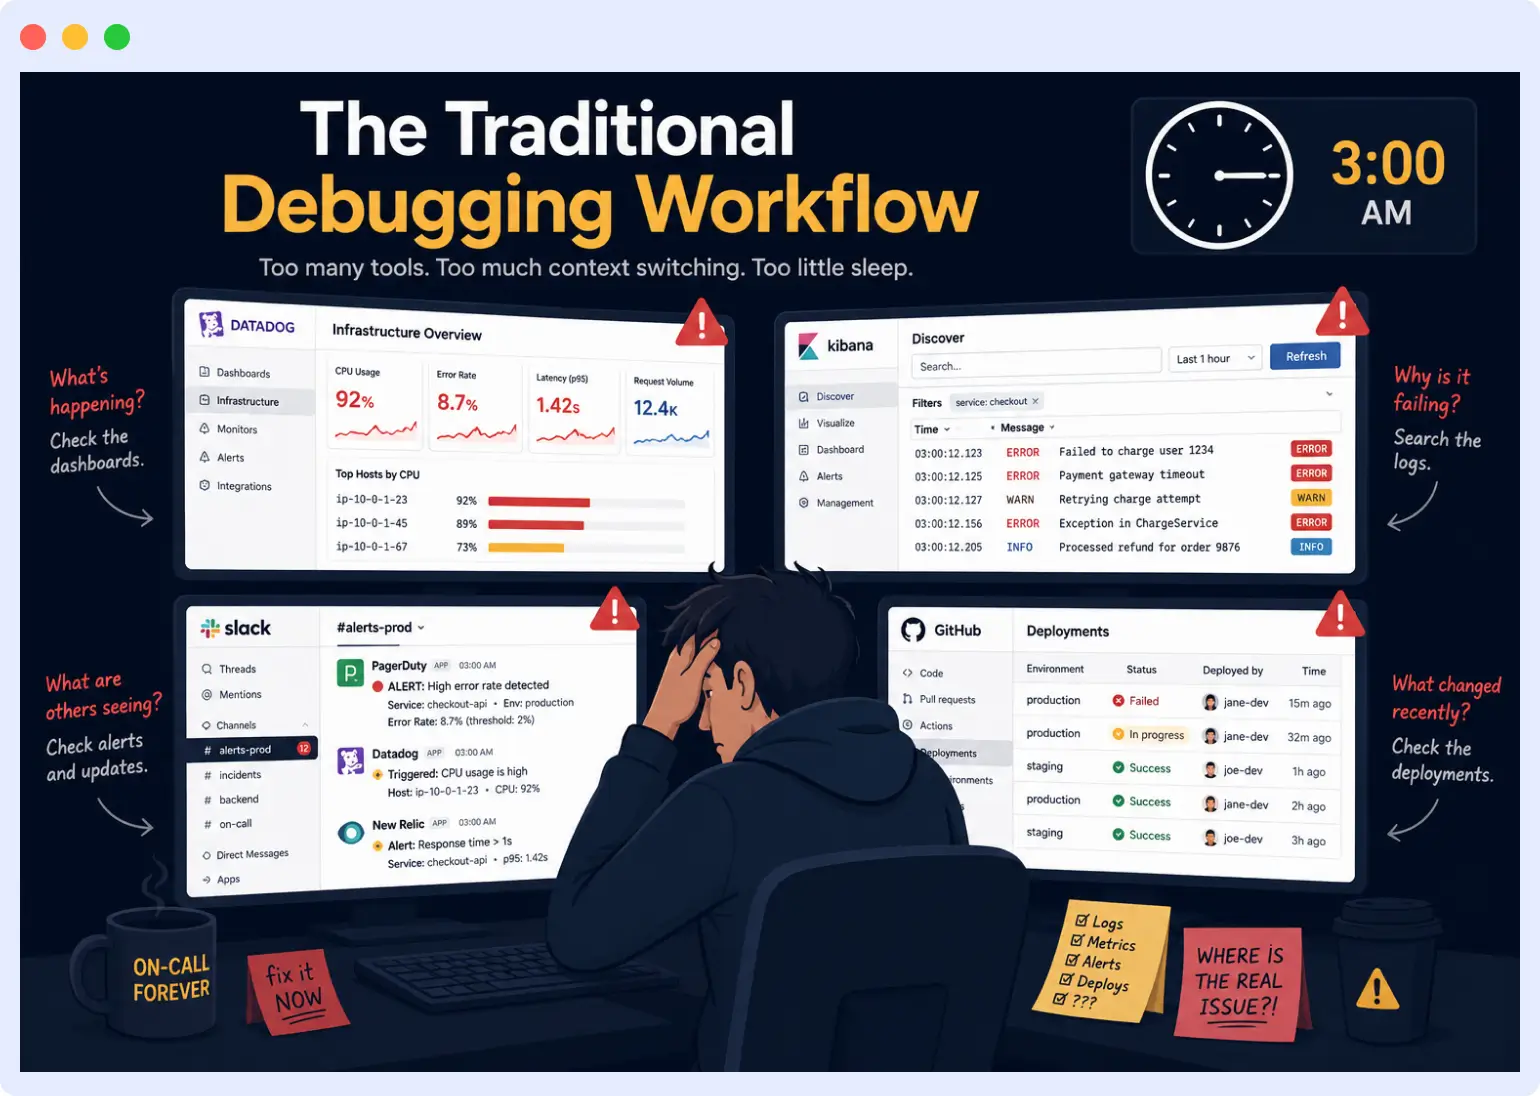
A typical production incident at a mid-size engineering team plays out like this:
- Alert fires — usually on a symptom: elevated error rate, latency spike, or a failed health check
- Metrics dashboard — engineer confirms scope and impact
- Log search — find the specific errors in a flood of data
- Deployment review — check if anything changed recently
- Dependency check — rule out upstream service failures
Each step involves context switching between tools, mental model building, and educated guessing about where to look next.
According to a Splunk study on the state of observability, organizations lose an average of $4,400 per minute during unplanned downtime (Splunk: The Hidden Costs of Downtime). The biggest driver of that cost is not the incident itself. It is the time it takes to find the cause.
The two metrics that define incident response efficiency are:
| Metric | What It Measures | Where AI Helps |
|---|---|---|
| MTTD (Mean Time to Detect) | How fast you know something is wrong | Anomaly detection, smarter alerting |
| MTTR (Mean Time to Resolve) | How fast you fix it | Root cause analysis, log clustering |
Most teams have invested heavily in reducing MTTD. MTTR is the harder problem it requires understanding, not just detection. And understanding has historically been a human job. That is the gap AI is now targeting.
Anomaly detection: finding the signal before the alert
Traditional alerting is threshold-based: if error rate exceeds 5%, page the on-call engineer. That works for known failure modes. It fails for the ones you didn’t think to write a rule for.
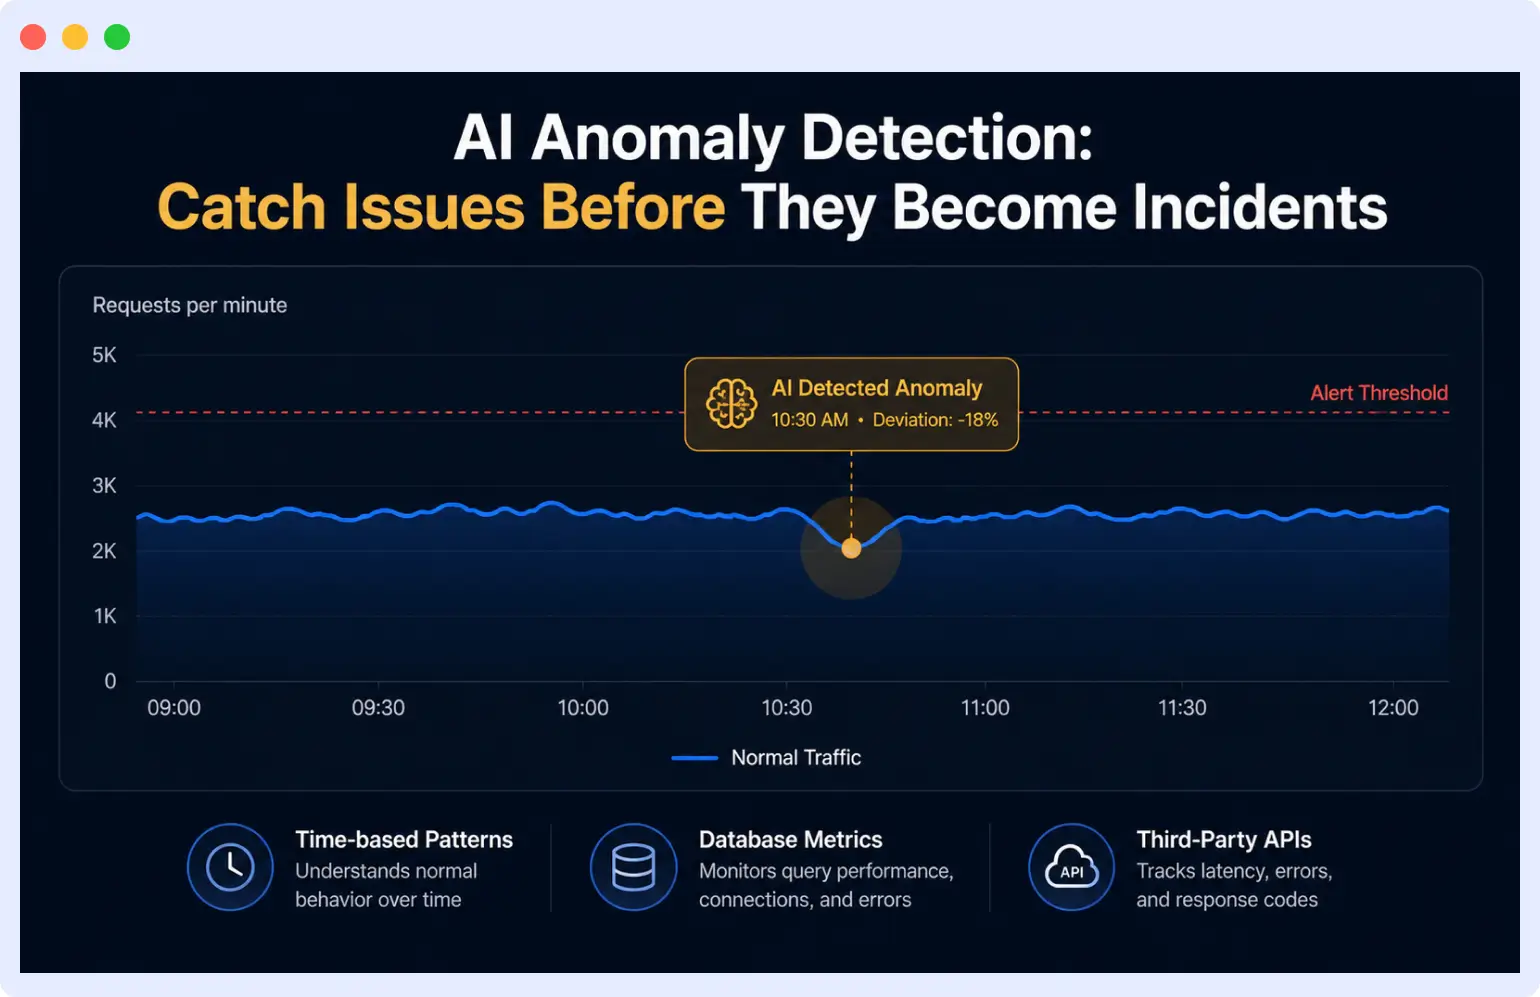
AI-powered anomaly detection takes a different approach. Instead of static thresholds, it builds a model of what normal looks like for your system, accounting for time of day, day of week, recent traffic patterns, and seasonal variation. When something deviates from that model in a statistically meaningful way, it flags it, even if it has never been flagged before.
Why This Matters in Practice
The most damaging production issues are often the ones that don’t trigger obvious alerts:
- A slow memory leak causing gradual performance degradation over six hours
- A database query running 30% slower than usual but still within threshold
- A third-party API responding correctly but taking twice as long
None of these cross a static threshold. All of them affect users.
AI anomaly detection surfaces these patterns early before they become incidents giving teams the chance to investigate on their own schedule rather than at 3 AM. Middleware OpsAI adaptive baselining engine monitors your entire stack application code, database, and infrastructure and flags deviations before they become incidents.
Middleware’s infrastructure monitoring applies adaptive baselining across your entire stack application code, database, and underlying infrastructure so anomalies get caught regardless of where they originate.
AI log analysis: from searching to understanding
Logs are the most detailed record of what your application is doing. They’re also, in large systems, completely overwhelming to read manually.
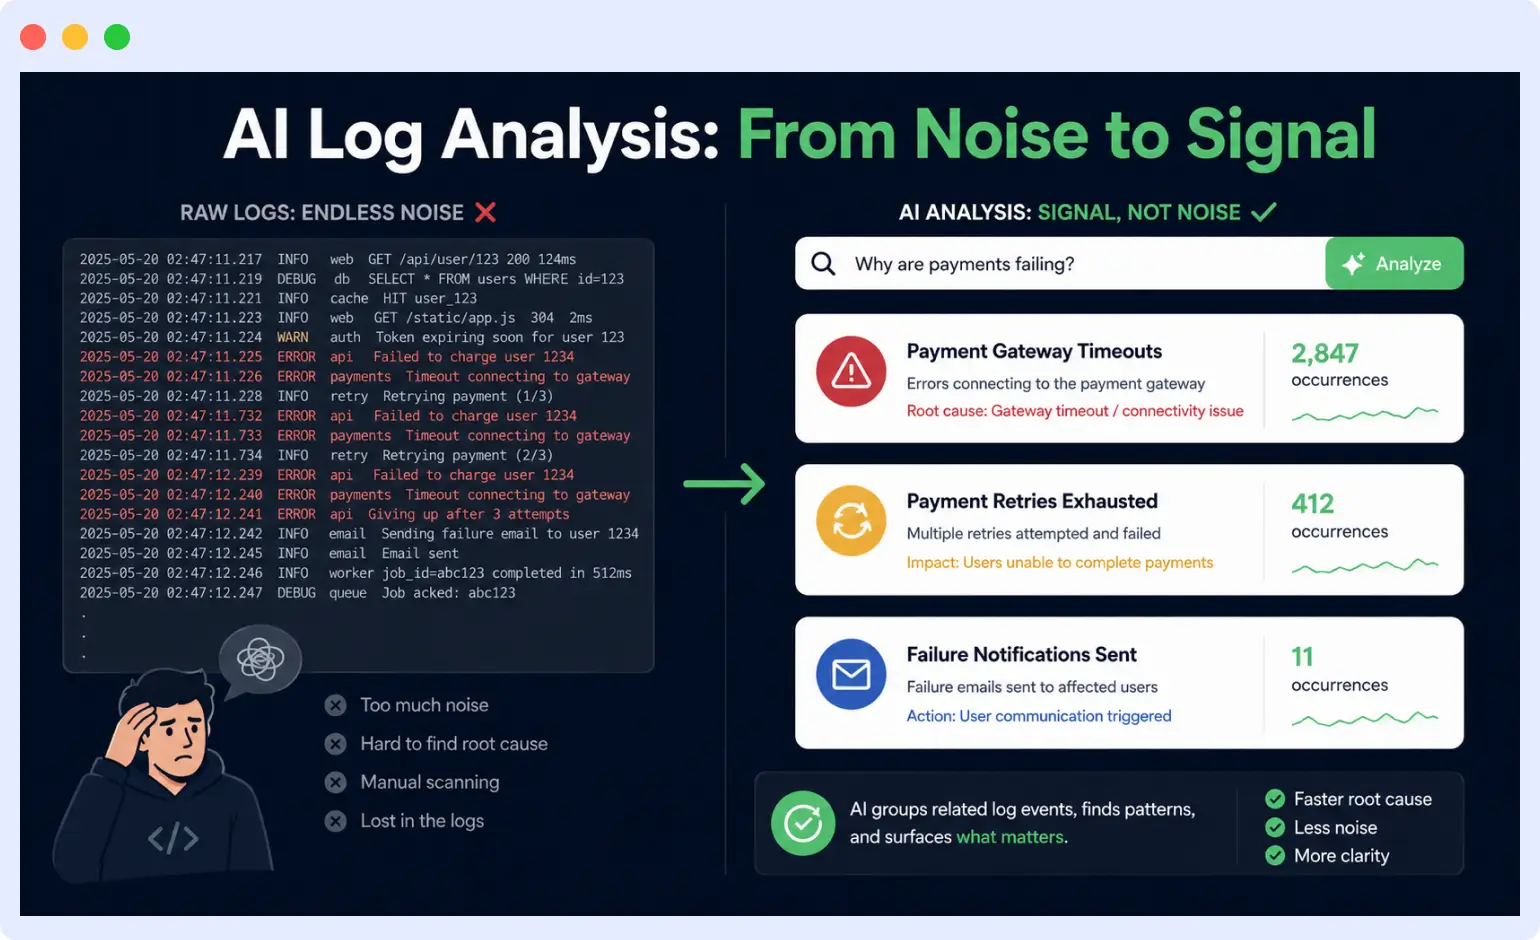
A high-traffic production service can generate millions of log lines per hour. When something goes wrong, finding the relevant lines in that volume requires either knowing exactly what to search for, which you often do not, or reading through a filtered subset and hoping the signal is in there.
Two Ways AI Transforms Log Analysis
1. Pattern Clustering
Instead of returning thousands of individual log lines, AI groups them by pattern. You see:
“2,847 occurrences of this error pattern between 14:23 and 14:31”
…rather than 2,847 individual lines. That single compression makes triage dramatically faster you immediately see which error patterns are dominant and which are noise.
2. Natural Language Querying
Instead of writing complex queries in a proprietary log query language, you describe what you’re looking for in plain English:
“Show me all errors related to the payment service in the last hour.”
The AI translates that intent into a precise query and returns relevant results.
For junior engineers and on-call rotations covering parts of the system they didn’t build, this removes a significant barrier. You no longer need deep familiarity with the log format and query syntax of every service you might need to debug at 2 AM.
Middleware’s AI-powered log monitoring applies pattern clustering and natural language querying and feeds these insights directly into OpsAI, so the agent already has the relevant log context before your engineer even opens the incident.
Automated root cause analysis in distributed systems
Detecting that something is wrong and finding the root cause are two very different problems.
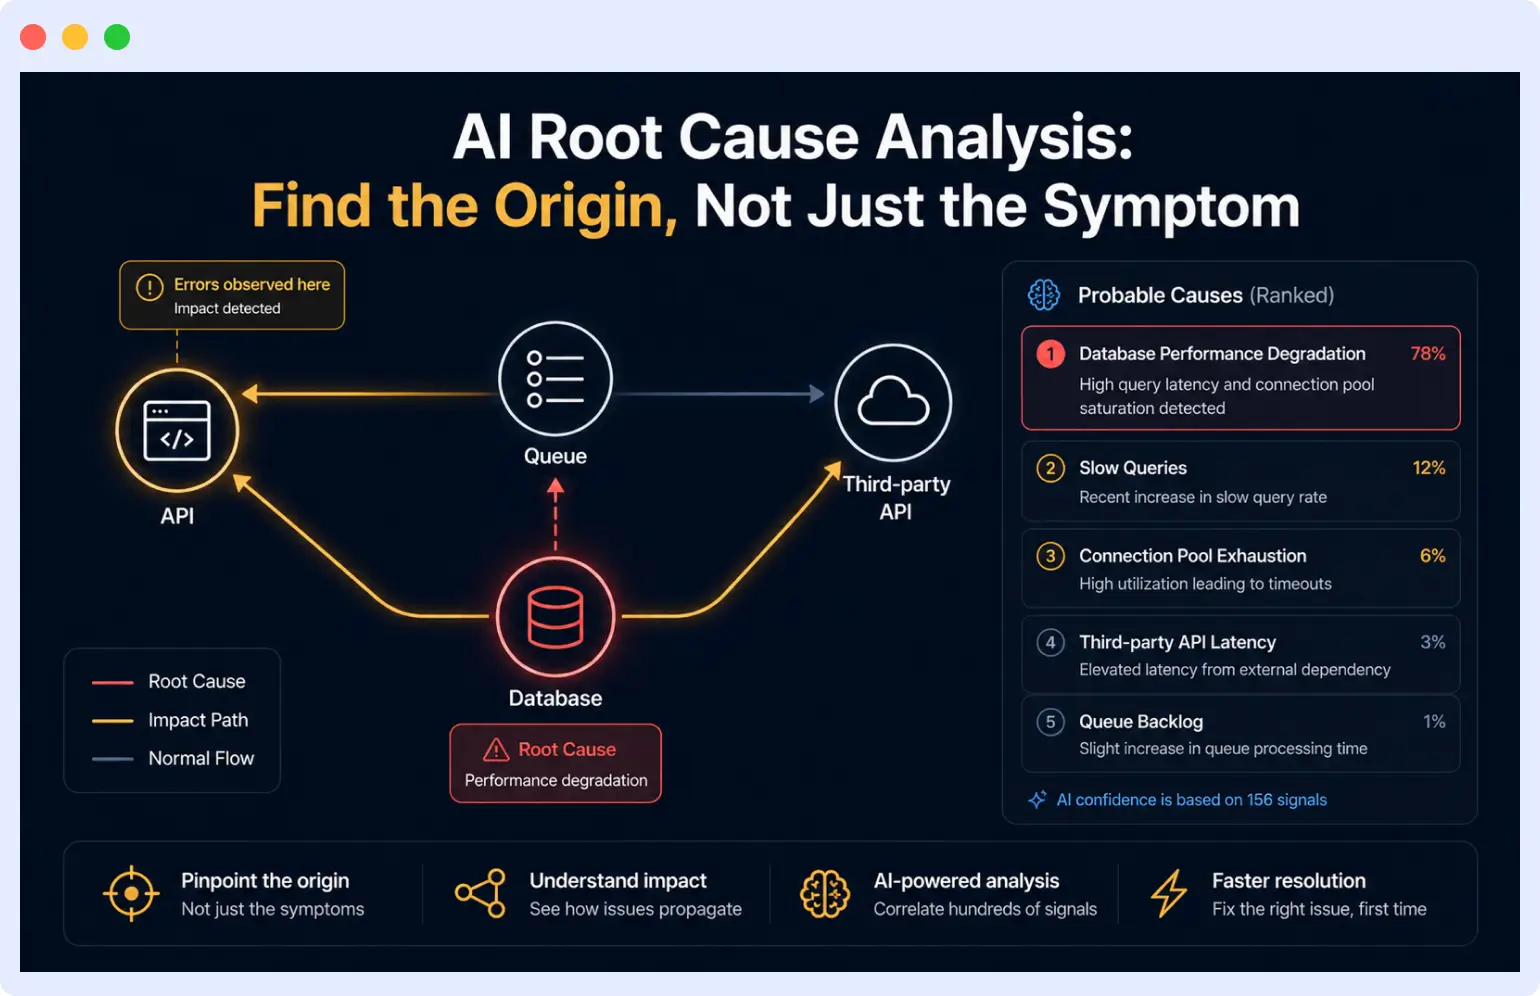
In a distributed system, a single user-facing symptom can have causes several layers deep:
Elevated API error rate
  └─ Slow database query
       └─ Missing index from recent migration
            └─ Only manifests under specific traffic pattern (absent in staging)
Manually correlating across those layers takes time and expertise. You need to know which services depend on which, what changed recently, and which metrics to look at in what order.
How AI Root Cause Analysis Works
AI root cause analysis builds a dependency graph of your system and, when an incident occurs, automatically traverses that graph to find the most likely origin point. It:
- Correlates the timing of anomalies with recent deployments
- Checks whether dependent services show related signals
- Surfaces a ranked list of probable causes candidates for the engineer to validate, not decisions made for them
This is especially relevant for teams using AI-assisted development, where changes happen faster and the gap between what was deployed and what is breaking is harder to trace manually.
For a closer look at why AI-built apps often surface unexpected production issues, this breakdown is worth reading: Why AI-Built Apps Break in Production. It correlates the timing of the anomaly with recent changes, checks whether dependent services show related signals, and surfaces a ranked list of probable causes.
This does not eliminate the engineer’s judgment. The AI is identifying candidates, not making decisions. But it compresses what used to be a 30-minute investigation into a starting point you can validate in five minutes.
According to the Middleware State of Observability 2026 report, 59.5% of teams now rank AI-powered anomaly detection as their most-wanted observability capability, ahead of automated incident summaries (51.4%) and predictive alerts (44.5%). The message is clear: teams don’t just want faster detection, they want AI that gets to the root cause faster.
📖 See it in practice: Once AI surfaces the probable root cause, the next step is tracing and fixing it live. From Alerts to Action: Debugging Live Production Problems
Intelligent alerting: cutting through alert fatigue
Alert fatigue is one of the most well-documented problems in DevOps. When engineers receive too many alerts, especially ones that are noisy, duplicated, or irrelevant to their service, they start ignoring them. And when alert fatigue sets in, real incidents get missed.
How AI Improves Alerting
- Deduplication and Grouping
When an incident triggers 40 separate alerts across different services and checks, AI groups them into a single incident record with a summary. The engineer sees one incident not 40 notifications.
2. Intelligent Routing
AI learns which alerts are typically handled by which team members, at what times, and with what outcomes. Over time, it routes alerts to the right person faster and with better context about what similar incidents required in the past.
The result: fewer alerts that matter more, handled by the right people faster.
Set smarter alerts: Configure AI-powered alerting in Middleware to reduce noise and let OpsAI handle the first 5 minutes of every incident automatically.
How AI is reshaping DevOps team structure
The shift toward AI-assisted debugging isn’t just a tooling change. It’s changing what skills matter and how incident response teams are structured.
The Traditional Model vs. The AI-Assisted Model
| Traditional Model | AI-Assisted Model | |
|---|---|---|
| Most valuable skill | Deep system-specific knowledge | Ability to validate and act on AI-surfaced insights |
| On-call breadth | Narrow (only experts on-call) | Broader rotation without degraded response quality |
| Time allocation | Reactive firefighting | Proactive reliability engineering |
| Knowledge transfer | Concentrated, hard to share | Distributed through AI tooling |
When a tool like OpsAI automatically surfaces the root cause candidate, the dependency graph, and the relevant log patterns, an engineer with less system-specific knowledge can still respond effectively. Teams can broaden their on-call rotation without degrading incident response quality.
It also changes the nature of the work. Less reactive firefighting means more time for:
- Improving test coverage
- Hardening failure paths
- Reducing technical debt in areas the AI keeps flagging as incident-prone
The best DevOps teams in 2026 aren’t the ones who debug fastest under pressure. They’re the ones who’ve used AI to reduce how often they need to debug at all.
Start debugging smarter with Middleware
The debugging workflow that DevOps teams have relied on for the last decade is being compressed by AI at every stage. Anomalies get detected earlier. Logs get clustered and summarized instead of manually searched. Root cause analysis starts automatically instead of after 30 minutes of triage. Alerts arrive deduplicated and routed to the right person, with OpsAI already mid-investigation.
None of this eliminates the need for skilled engineers. It eliminates the parts of the job that were never about skill in the first place, the searching, the correlating, the waiting to find the signal in the noise.
Ready to cut your MTTR and move from reactive firefighting to proactive reliability?
👉 Try Middleware OpsAI Free — Full-stack observability with an AI SRE agent that starts investigating before your engineer even opens the alert. No credit card required.
👉 Book a Demo — See how Middleware’s AI observability platform works with your stack.
FAQs
What is AI-powered root cause analysis in DevOps?
AI root cause analysis automatically maps service dependencies and correlates metrics, logs, and deployment events to identify the most probable origin of a production incident reducing manual investigation time from 30+ minutes to under 5 minutes.
How does AI reduce MTTR in incident response?
AI reduces MTTR by automating the three most time-consuming parts of incident response: detecting anomalies early, clustering and surfacing relevant logs, and correlating signals across services to identify root causes without manual investigation.
What is the difference between threshold-based alerting and AI anomaly detection?
Threshold-based alerting fires when a metric crosses a fixed value (e.g., error rate > 5%). AI anomaly detection builds a dynamic baseline of normal behavior and flags statistically significant deviations — catching issues that would never trigger a static threshold, like gradual memory leaks or slow query degradation.
Can AI observability tools replace on-call engineers?
No. AI observability tools surface candidates and compress investigation time, but they don’t make decisions or apply fixes. They eliminate the low-skill parts of debugging searching, correlating, waiting so engineers can focus on judgment, validation, and remediation.
How does Middleware use AI for observability?
Middleware applies AI across its full observability stack: adaptive anomaly detection in infrastructure monitoring, pattern clustering and natural language querying in log monitoring, and AI-assisted root cause analysis in APM all unified in a single platform.

