Think of a busy online shop with holiday sales and thousands of people waiting to make a purchase. Then, out of nowhere, the site is as slow as molasses; it takes forever for pages to load, and visitors abandon their shopping carts in disgust. Every business’s worst fear is this scenario — but Application Performance Monitoring (APM) offers a vital safety net, ensuring optimal performance and minimizing downtime.
APM tracks key software performance metrics using monitoring software and telemetry data. These tools help enterprises identify and resolve performance bottlenecks, ensuring smoother and faster application interactions. APM is used in many scenarios, but most enterprises use it to make the customer experience a breeze.
As shown in Gartner’s survey, 83% of enterprises prioritize improving troubleshooting, while 81% focus on enhancing customer experience through APM. The report found that end-user experience monitoring was the most critical APM dimension, with 49% of respondents citing “enhancing CX quality” as their top reason for investing in APM.
This article explores the role of APM in driving customer satisfaction, measuring its business value, and implementing it on Middleware, featuring real-world applications and case studies.
How APM drives customer satisfaction
Application Performance Monitoring is the practice of using real-time data to monitor application performance and the digital experiences of end users. It does this by tracking different metrics (which we will discuss later) in real-time and showing performance bottlenecks.
Here’s what APM does to the application to drive customer satisfaction:
- Improved application performance: APM plays a major part in improving application performance through real-time monitoring, including response time and errors. When these metrics decrease to a certain level, the team is aware of possible issues.
- Reduced downtime: Issues in a software system are inevitable, but the time required to fix them can be reduced. APM helps lower the mean time to detect (MTTD) and the mean time to resolve (MTTR). MTTD measures the duration a problem persists in an IT deployment before it’s noticed, while MTTR is the average time taken to restore a system to operational condition after a failure or cyberattack notification. Once the issue is detected early, the negative impact on the customer can be greatly reduced.
Interested to know more about MTTR and MTTD? Click here.
- Enhanced user experience: Smoother application performance greatly improves user experience by ensuring applications run efficiently and responsively. Research by Cisco AppDynamics shows that 60% of customers blame performance issues on the application or brand. An application is made up of different elements which are interrelated in some way. However, in a problem-solving process, trying to handle these aspects on your own can be quite challenging. APM are a great helping hand in figuring out such aspects.
APM excels at managing these aspects, but how can you be sure it’s performing effectively? The answer is in defining the right metrics, which we will see in the next section.
Quantifying the impact of APM
When hard-earned money and time are invested in Application Performance Monitoring (APM), it’s crucial to ensure that it’s hitting the mark for stakeholders.
The impact of APM on customer experience can be quantified using several key metrics. Keeping an eye on these will help us make informed decisions and steer us in the right direction:
- CPU & Memory Utilization: CPU and memory utilization show system resource usage. APM tracks these metrics in real-time to prevent server overloads and potential slowdowns.
- Customer Support Tickets: This feature is responsible for managing the quantity and the kind of support tickets that pertain to application performance. If the number is high, it means that there are some problems with the poor performance of different operations.
- Page Load Times: It quantifies the amount of time a web page or an application takes to load. Generally, higher speeds of loading the webpage increase usability and decrease the level of frustration.
- Garbage Collection: It improves performance by automatically reclaiming memory from unused objects. It deletes redundant data and moves active objects to a new memory pool. Optimal GC frequency is crucial—too often can cause overhead, too infrequent can lead to memory shortages.
- Error Rates: Records the number of errors or failures the users go through. Lowering error rates imply that APM is able to detect and solve problems with performance effectively.
- User Satisfaction Scores: This measure is a way of getting immediate feedback from the users with the help of questionnaires or ratings. Higher satisfaction scores tend to embody such positive experiences connected to the issue of enhanced application performance.
APM on Middleware
Middleware’s APM solution can help correlate application performance improvements with positive customer behavior changes by:
- Real-time monitoring: Middleware continuously monitors application performance. This allows you to find and resolve issues before they impact users. Improved performance metrics, like reduced page load times, are directly linked to increased user engagement and satisfaction.
- User experience tracking: By analyzing metrics like response times and error rates, Middleware helps correlate better application performance with improved user experiences, such as fewer drop-offs and increased session durations.
- Data-driven insights: The APM solution offers detailed reports that show how performance improvements, like faster transaction processing, result in positive customer behaviors, such as higher conversion rates or lower abandonment rates.
Furthermore, the development process is simplified without requiring extensive learning, as will be explained in the next section.
Implementing Middleware’s APM for a Python application
This section will create a Python application in FastAPI and use APM to monitor metrics, logs, and traces. Let’s see it step-by-step.
Prerequisites
To get started with setting up, follow these general steps:
- Access the Installation Documentation: Visit the installation documentation for detailed instructions specific to your operating system (OS).
- Run the Installation Command: Copy and execute the command provided on the documentation page.
- Verify Installation: After running the command, ensure the installation is completed.
For more detailed and up-to-date instructions, refer to the official installation guide.
Create FastAPI application
To create a FastAPI application, we will need to create a virtual environment to isolate the dependencies and add our code. Follow these steps:
- Create a Virtual Environment
- Activate the Virtual Environment
- Install FastAPI and Uvicorn
- Create Endpoints
- Enable Middleware APM
Running the application
Upon successfully running the application using the Middleware installation manual’s commands, you can monitor metrics and performance through the APM.
The dashboard presented below shows all the APIs’ metrics and performance.
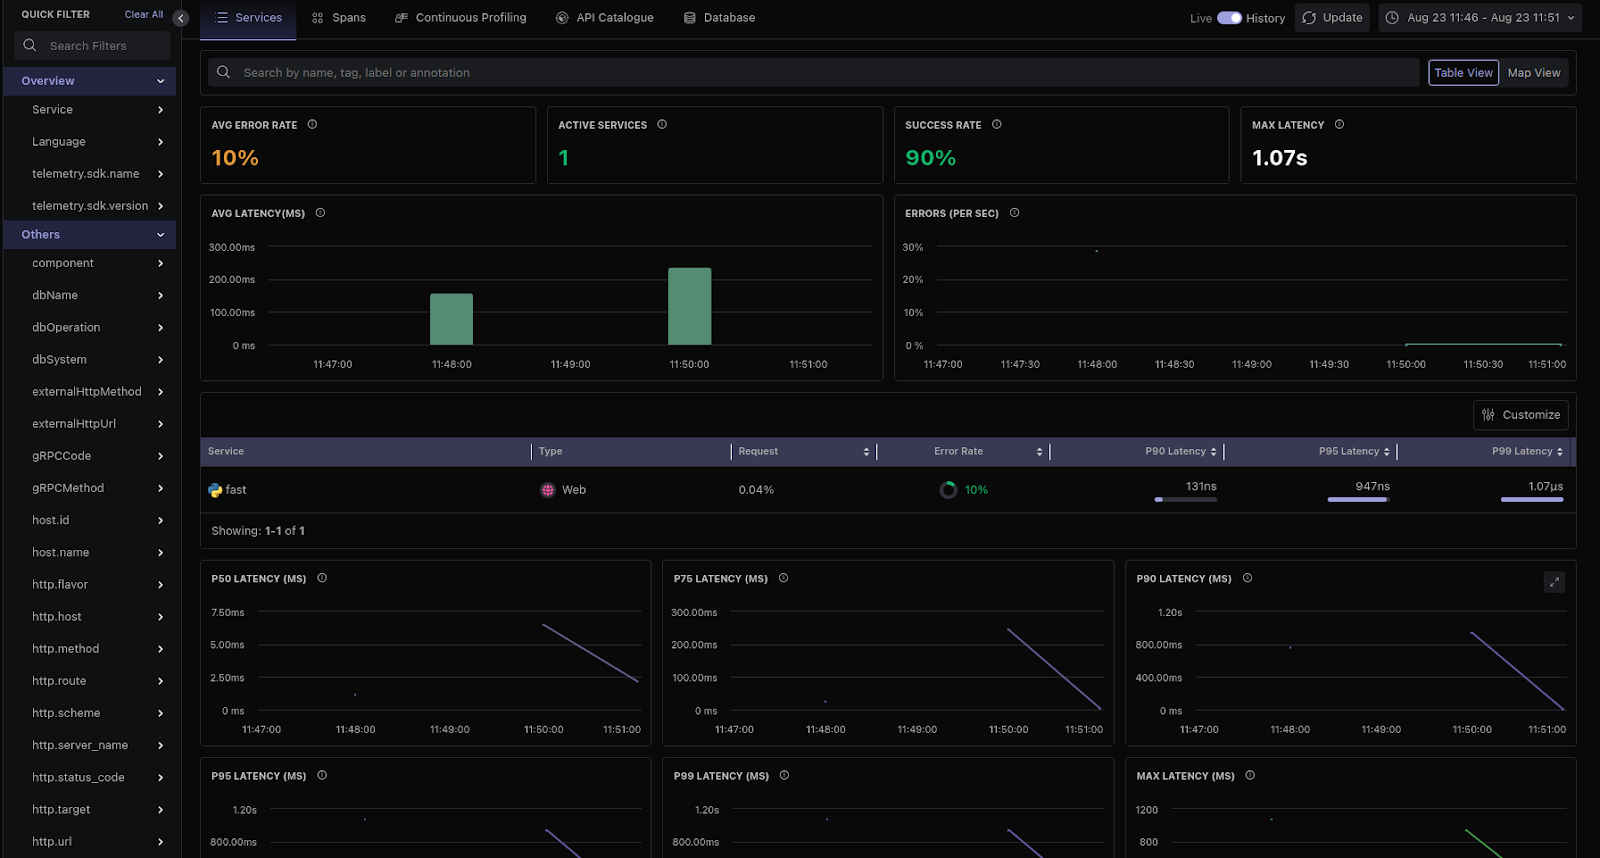
From the above, we can observe our Application Performance Monitoring (APM) in action. It is tracking both success and error rates, indicating that the API currently has a success rate of 95.5%. If we further want to dig up the problematic request that the API didn’t handle, go to Spans.
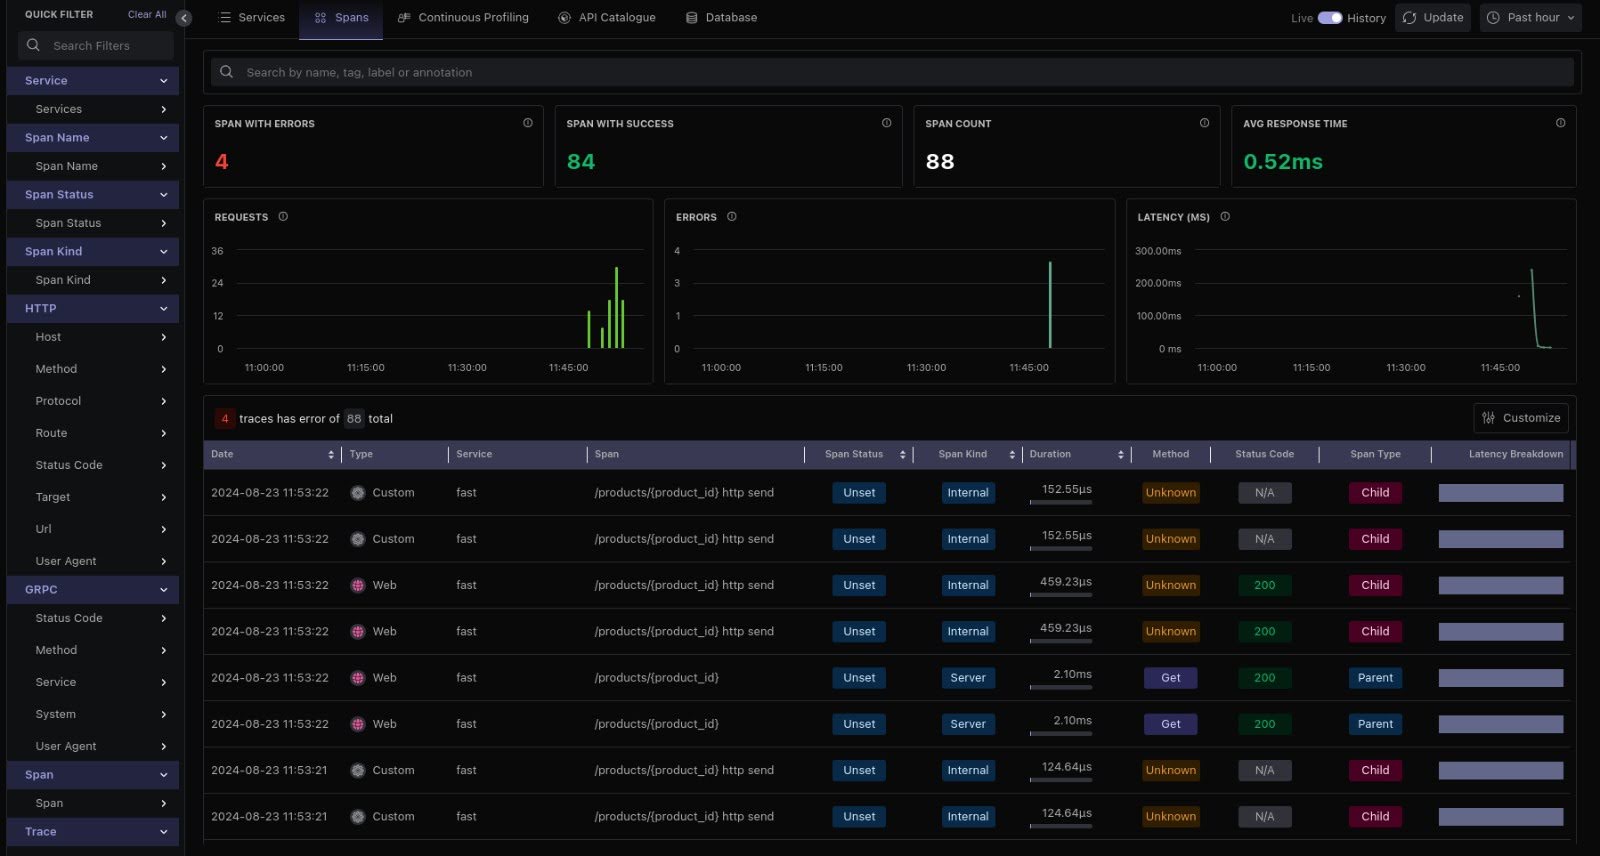
From the above, we can see all the requests that were made, including both successful ones and those that resulted in errors.
Case studies
Application monitoring is an important part of customer satisfaction. The following case studies from different companies testify to the improvement of customer experience through APM.
Kurt-Geiger
A fashion retailer operating five websites and retail stores across the UK and Ireland faced challenges with low Core Web Vitals (CWV) scores. It affected their e-commerce performance and customer satisfaction. The lack of detailed insights made it difficult to address issues. Kurt Geiger monitored CWV in real-time, identified performance bottlenecks, and improved their score from 45-50 to 85-90 within six months by implementing an APM solution. This APM-driven approach led to 99% of customers enjoying a positive online shopping experience.
Hotplate
Middleware’s APM helped Hotplate achieve cost savings, approximately 10 times more than other observability solutions. The detailed traces and session replays allowed Hotplate to pinpoint and address performance bottlenecks efficiently, enhancing overall customer interactions. As a result, Middleware’s Real-User Monitoring (RUM) now manages over 1.5 million sessions per month for Hotplate. This ensures a smooth user experience during high-traffic events.
Trademarkia
One of the largest visual search engines for trademarked logos, names, and slogans faced challenges with its outdated tech stack. This affected efficiency and scalability. Trademarkia adopted Middleware’s full-stack cloud observability platform to modernize its infrastructure. Middleware’s user-friendly interface and Slack integration boosted collaboration, productivity, and response times. These, in turn, positively impacted the CX.
Mercado Libre
The largest e-commerce platform in Latin-America, faced challenges in scaling, performance, and downtime as its business grew. With APM solution, they gained real-time insights into application performance, which enabled their teams to identify and resolve issues quickly. This led to a significant reduction in errors, improved response times to under 50 milliseconds, and enhanced the overall user experience.
Attaching an APM provides a clear view of existing bottlenecks, making it easier to address them. These case studies prove the importance of APM in improving customer experience.
Conclusion
The 21st century is striving for automation. So, why manually monitor the application’s performance? It is important that the APM handles the heavy lifting of continuous monitoring and informs the team why customers are not returning. When customers feel their needs are prioritized, businesses see an increase in return rates and customer loyalty.
With Middleware’s APM, businesses can enhance application performance, boosting customer satisfaction and loyalty by providing real-time insights directly correlating with positive customer behavior. Middleware can extend its capabilities to RUM (Real User Monitoring) and Synthetic Monitoring to 10x the customer experience.
The full suite of Middleware provides monitoring tools to deliver superior customer experiences and drive business success. So, why wait? Sign up for Middleware now.