The promise of modern observability was simple: “Collect everything, and you’ll know everything.” But for most teams, that promise has turned into a nightmare of skyrocketing storage costs and “needle-in-a-haystack” troubleshooting. When you’re drowning in data, you aren’t observing, you’re just hoarding.
As teams grow, they collect more logs, traces, metrics, and frontend telemetry. The problem is not just volume. The bigger problem is relevance. When everything is stored, teams spend more money, search through more noise, and still take longer to find what matters.
Today, we’re handing you the remote control. The Middleware Observability Pipeline is officially here to help you filter the noise, protect your budget, and ensure that only the most actionable telemetry makes it to your platform.
Modern observability isn’t just about collecting data; it’s about making that data actionable. Our goal with the Observability Pipeline is to bridge the gap between IT and business goals by ensuring every byte stored serves a purpose.
Laduram Vishnoi, Founder and CEO at Middleware
The Problem: Why You Need an Observability Pipeline
As environments scale with more clusters, serverless, and microservices, the volume of logs and traces grows exponentially. Without a dedicated observability pipeline, the relevance of that data declines as costs rise.
- The Economic Drain: You’re paying to store thousands of “200 OK” health checks that no one will ever read. Most companies allocate 20–30% of their infrastructure budget to observability.
- The Cognitive Fatigue: Engineers wade through 50 pages of logs to find a critical error because the observability pipeline isn’t yet filtering out noise.
- The Security Risk: PII and secrets accidentally leak into storage, creating a compliance ticking time bomb under GDPR, HIPAA, or SOC 2.
⚡ Stop paying for data you don’t use. [Start your free 14-day trial] and see how much noise you can cut from your clusters in the next 10 minutes.
See the Pipeline in Action
Before we dive into the technical layers, see the Middleware Observability Pipeline in action:
How Middleware Observability Pipeline Works
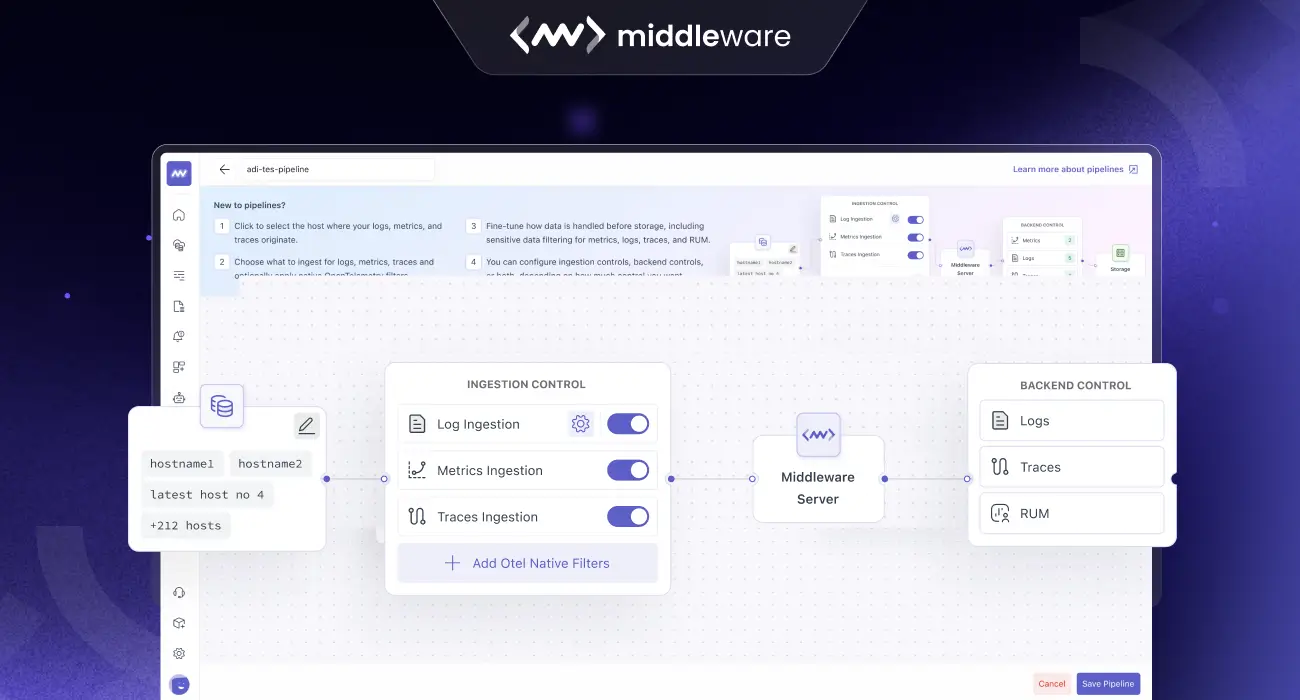
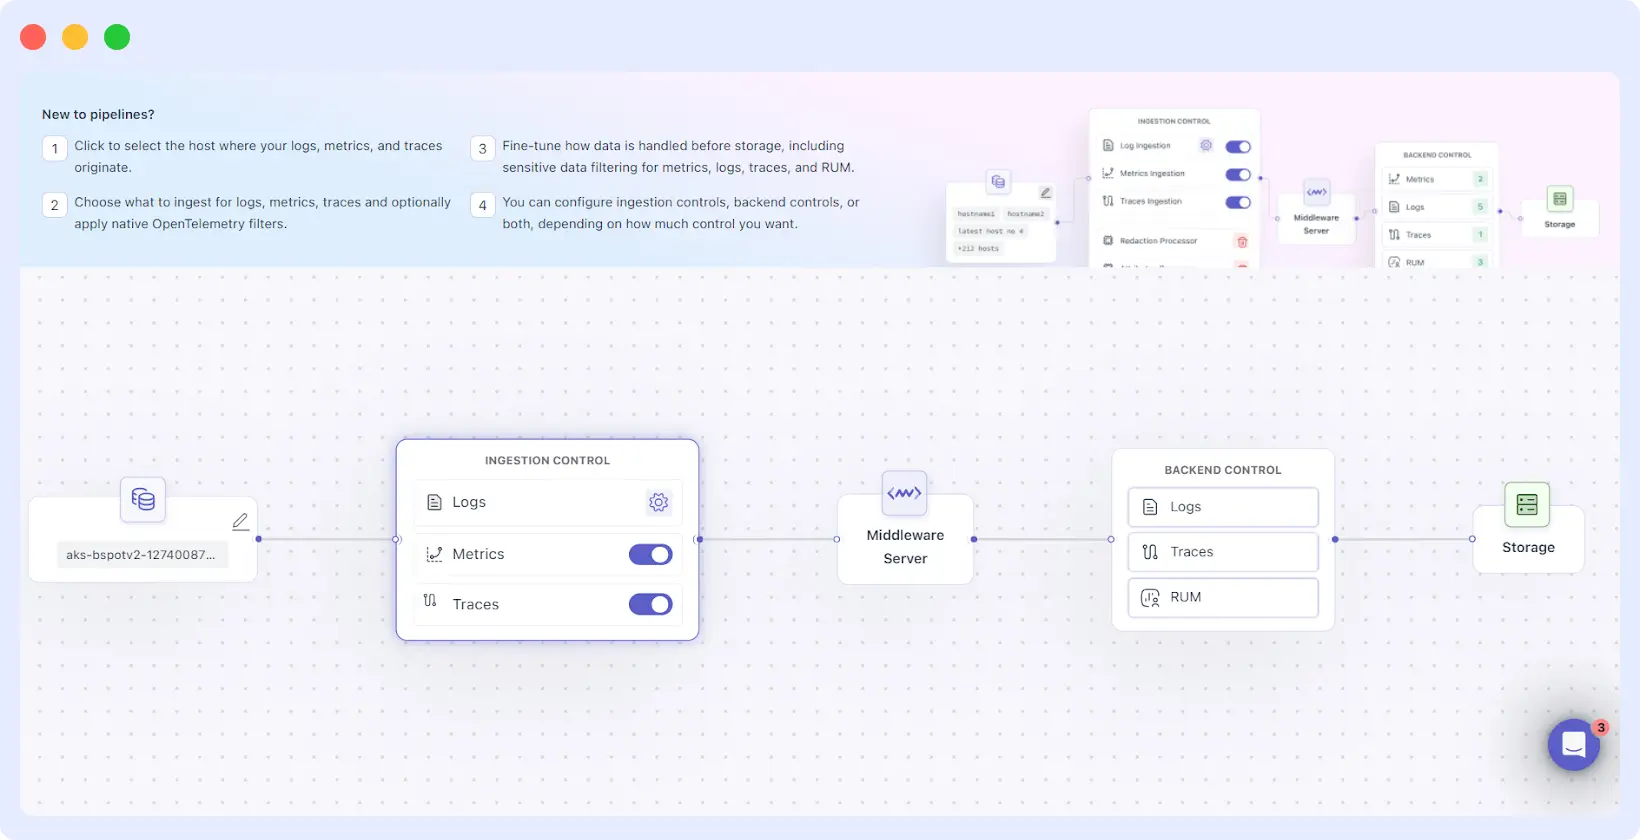
The Middleware observability pipeline is designed as a multi-stage journey. Instead of treating all data as a single stream, we provide four distinct layers of control. This allows you to act on data at the most efficient moment possible.
1. Source-Aware Selection
A great observability pipeline starts at the source. Middleware allows you to create specific pipelines based on your environment: Host, Cluster, or Serverless. This distinction is vital because a Kubernetes cluster requires different handling than a standalone Linux host.
By selecting the source first, the observability pipeline tailors the available tools to that specific architecture, ensuring you have the right “hooks” to grab the data you need.
2. Ingestion Control
Once the data begins to move, it hits the Ingestion Control layer. Think of this as the “sorting hat” of your observability pipeline. Here, you can:
- Parse and Format: Transform messy, unstructured logs into clean, JSON-ready attributes.
- Enrichment: Automatically add metadata (like geographic location or department IDs) to your traces so they are easier to query later.
- Toggle Control: Turn metrics and traces on or off with a single click. If you’re undergoing a heavy migration and don’t need traces for a specific service for 24 hours, you can kill the flow instantly without touching a line of code.
3. OTEL-Native Filtering
This is the “secret sauce” for advanced users. For cluster-based sources, Middleware utilizes OpenTelemetry (OTEL) collectors. Our observability pipeline allows you to run filtering rules inside your own cluster.
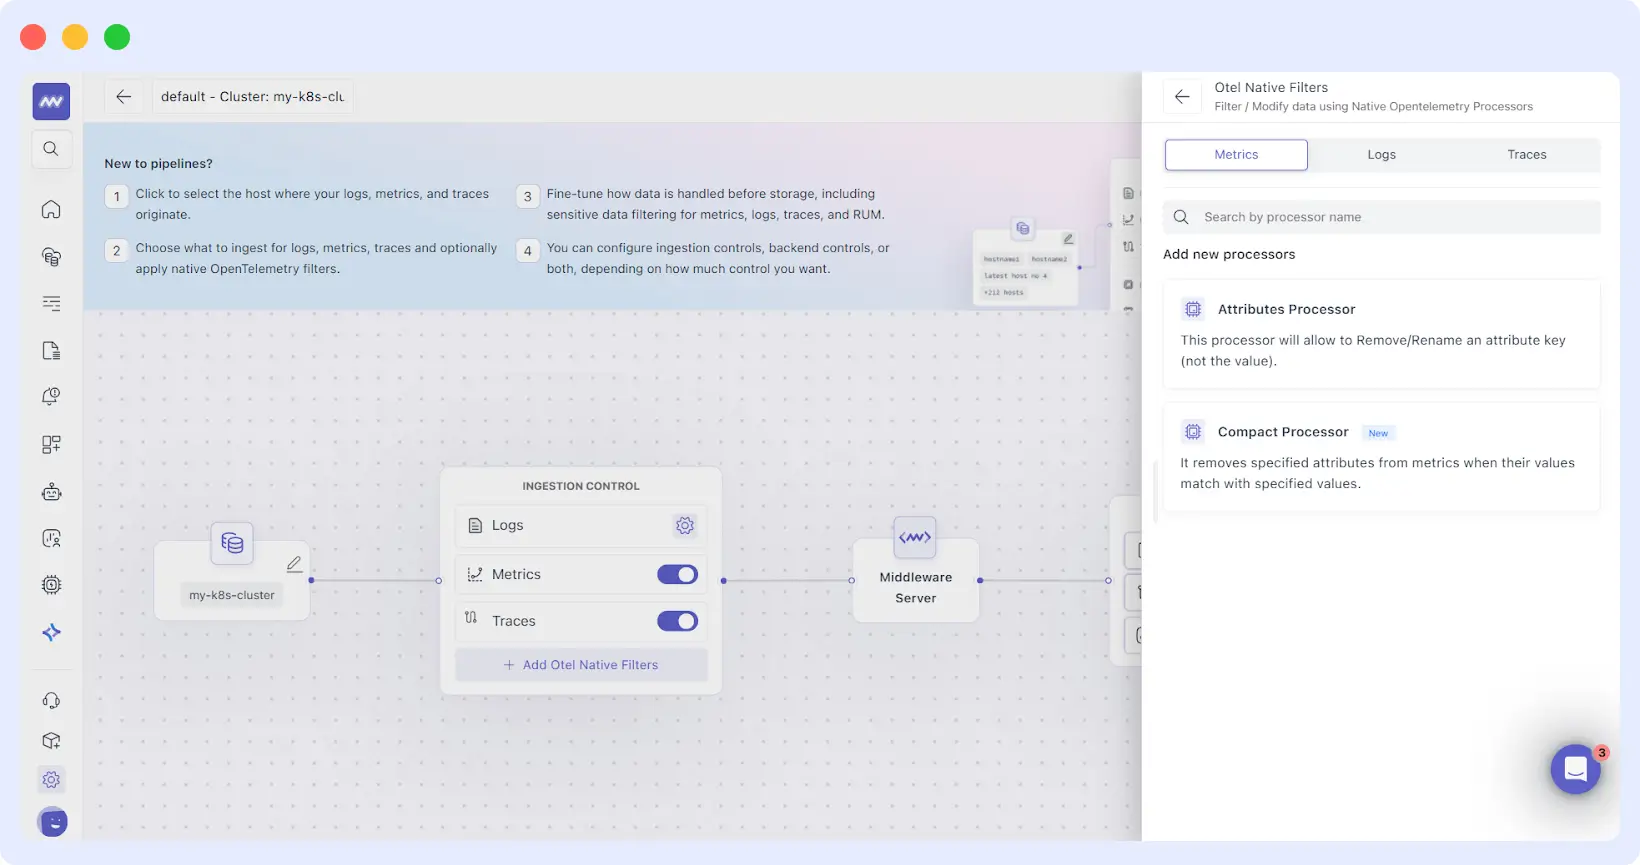
Why does this matter? Because sending data over the internet costs money (egress fees) and uses CPU power. By dropping “Health Check” logs and noisy namespaces at the source, your observability pipeline saves you money on your cloud provider bill and your observability bill simultaneously.
4. Backend Control
The final stage of the observability pipeline happens just before data is committed to long-term storage and billing. This is where you set your “Policy Rules.”
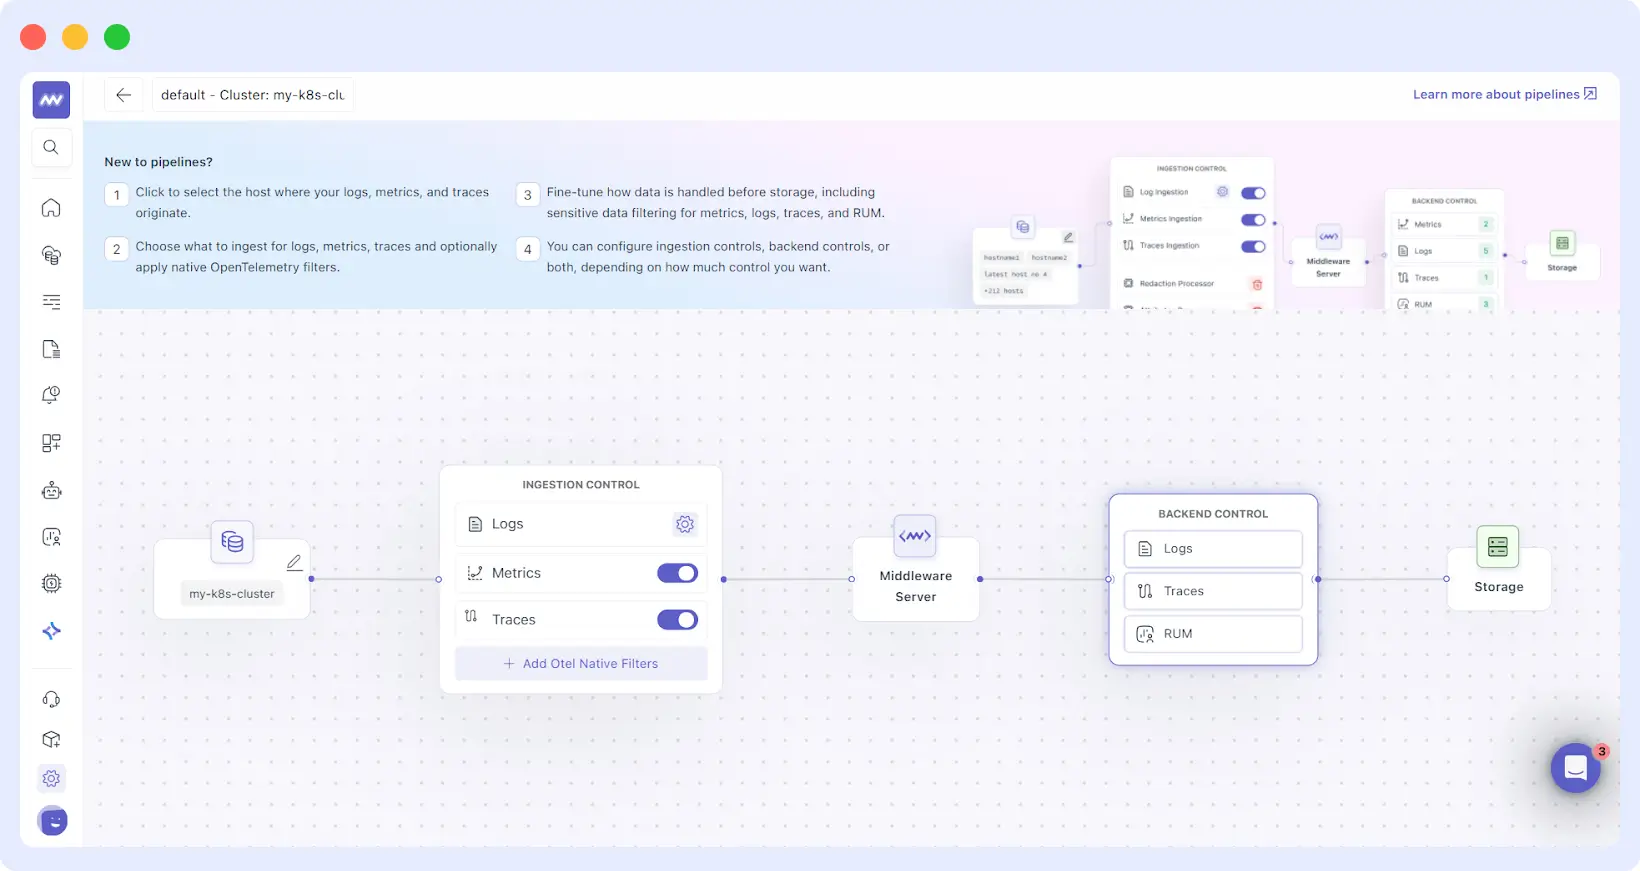
Backend Control is designed for cost and compliance. If a log matches a specific “drop rule” (e.g., level=”debug” AND environment=”staging”), it is permanently discarded. To give you total confidence, we’ve included a Preview Expression feature.
You can write a rule and immediately see how many logs it would have caught over the last hour, ensuring you don’t accidentally silence critical production alerts.
Why Teams Are Switching to the Middleware Observability Pipeline
Cost Optimization Without Risk
Every team has “noisy” services, perhaps a legacy app that logs every mouse movement. Without an observability pipeline, you pay for that. With Middleware, you can create a rule to sample these logs at 5% or drop them entirely, while keeping 100% of your “Error” logs. You get the visibility you need at a fraction of the price.
“Compared to other observability solutions, Middleware offered similar or even superior capabilities at a much lower cost, eliminating the need for expensive tiered pricing or additional charges for advanced features. This made Middleware a more accessible and scalable solution for a business like ours. In fact, we were able to reduce our costs by 75%.”
Krishna Charan BS, Information Security Head, MindOrigin
Automated Data Redaction & Compliance
Manual redaction is impossible at scale. Our observability pipeline can be configured to recognize patterns (such as 16-digit numbers or email formats) and mask them in real time. This ensures that even if a developer accidentally logs a customer’s password, it is scrubbed before it ever leaves your secure environment.
Standardizing Global Telemetry
In large organizations, Team A might call a user ID user_id, while Team B calls it u_id. This makes cross-service troubleshooting a nightmare. You can use the observability pipeline to “normalize” these keys, ensuring that your entire platform speaks the same language.
Setting Up Your First Observability Pipeline
Ready to take control? Follow this blueprint to get your observability pipeline running in minutes:
- Open Settings → Pipelines and create a pipeline for your environment.
- Select the appropriate source type first (Host, Cluster, or Serverless), as the available controls depend on the selected source type.
- Enable Ingestion Controls to parse, shape, and enrich telemetry early in the flow.
- For cluster sources, add OTEL-native filters when you want source-side filtering before data leaves the cluster.
- Apply Backend Control rules to drop non-actionable telemetry before storage.
The era of “blindly sending data” is over. To stay competitive, fast, and secure, you need an observability pipeline that works as hard as your developers do. By implementing Middleware Observability Pipelines, you aren’t just saving money; you’re freeing your engineers to focus on what they do best: building great software.
“I don’t want my developers staying up all night digging through logs to fix issues; that’s a waste of everyone’s time. Middleware saves at least an hour of my time every day, allowing us to focus on building rather than searching.”
Akshat Gupta, Manager of Engineering Operations at Trademarkia
The Middleware observability pipeline is now available for all users. It’s time to stop hoarding data and start mastering it.