Kubernetes pod crash auto-remediation is the ability to automatically detect why a pod crashed and apply a permanent fix without human intervention. Middleware OpsAI does this by monitoring Kubernetes events, pod metrics, and container logs in real time, diagnosing the root cause of each failure, and patching the cluster directly, for example, raising a memory limit after an OOMKill or correcting a broken ConfigMap mount that causes CrashLoopBackOff. The result is fewer repeat incidents, shorter recovery times, and no 3 AM pages for problems that the system can resolve itself.
TL;DR
- Kubernetes restarts crashed pods automatically but never fixes why they crashed
- OOMKilled pods will keep dying on every restart until the memory limit is manually raised; OpsAI does this automatically using real P99 usage data
- CrashLoopBackOff has many causes (broken ConfigMap, bad volume mount, startup error); OpsAI reads exit codes and logs to find the exact one and patches it
- HPA misconfiguration never triggers a crash alert; OpsAI detects it by watching the gap between autoscaler behavior and actual service latency
- You control how much OpsAI acts on its own: Auto Fix for staging, human-reviewed Auto RCA for production
- No custom scripts, no 3 AM pages for problems the system can resolve itself
Quick Summary
| Problem | What Kubernetes Does | What OpsAI Does |
|---|---|---|
| Pod OOMKilled repeatedly | Restarts pod with same memory limit | Patches memory limit using P99 usage + 30% buffer |
| CrashLoopBackOff from broken ConfigMap | Keeps restarting the crashing container | Detects the broken volume mount reference and corrects it |
| HPA stuck at maxReplicas | No action (no crash event to react to) | Detects the scaling ceiling, reviews load history, updates maxReplicas |
| Ambiguous app error | Restarts pod indefinitely | Runs full RCA, opens a PR with proposed fix for human review |
| Single OOMKill, first time | Restarts pod | Logs, watches for recurrence, no immediate action |
What is Kubernetes self-healing and what are its limits?
Kubernetes self-healing refers to the platform’s built-in ability to detect and recover from container and node failures, automatically and without operator intervention. It is one of Kubernetes’ most cited advantages, and it genuinely works up to a point. For a full view of what Kubernetes exposes for monitoring and alerting, see the Kubernetes monitoring guide.
What Kubernetes self-healing actually covers
| Feature | How It Works |
|---|---|
| Container restarts | If a container exits, Kubernetes restarts it based on the pod’s restartPolicy |
| Liveness probes | If a container stops responding, Kubernetes kills and replaces it |
| ReplicaSets | If a pod is deleted, Kubernetes creates a replacement to maintain the desired count |
| Node failure recovery | If a node goes offline, Kubernetes reschedules its pods onto healthy nodes |
These features handle availability. They keep pods running. What they do not do is understand why a pod failed or prevent the same failure from happening again.
The hard limit of Kubernetes self-healing
This is the core gap. Every restart happens with the same configuration that caused the crash. There is no mechanism in native Kubernetes to:
- Raise a memory limit after repeated OOMKills
- Detect a broken ConfigMap reference causing CrashLoopBackOff
- Identify that an HPA’s
maxReplicasis too low for actual traffic demand - Distinguish between a transient failure and a systemic misconfiguration
Teams relying solely on Kubernetes self-healing still face repeat incidents, on-call burnout, and slow MTTR because every restart is a bandage over the same wound. For a deeper look at how to reason from Kubernetes symptoms to root causes, see diagnosing abnormal Kubernetes workload behavior.
Middleware OpsAI is built to close exactly this gap, adding a root-cause reasoning layer on top of the same Kubernetes monitoring data your cluster already produces.
Stop getting paged for the same pod crashes every week. OpsAI detects and fixes OOMKills, CrashLoopBackOff, and HPA issues automatically before they wake up your on-call team. Start free · Book a demo · See pricing
Why does my Kubernetes pod keep crashing with OOMKilled, and how do I stop it from happening again?
An OOMKilled pod means the Linux kernel’s Out-of-Memory manager terminated the container because its memory usage reached or exceeded the limit defined in the pod spec. Kubernetes flags this with exit code 137, which corresponds to SIGKILL (signal 9) sent by the kernel. Middleware log monitoring captures these exit codes and log tails in real time so OpsAI has everything it needs to act immediately.
Common causes of repeated OOMKills
- Memory limit set too low at deploy time. The original limit was an estimate and never revisited as traffic grew.
- New code introduces memory growth. A feature release adds buffering, caching, or large payload processing that was not present when the limit was set.
- Memory leak. The application accumulates memory over time; the pod eventually hits its ceiling on every restart cycle.
- Traffic spike. A sudden increase in concurrent requests pushes per-request memory allocation above the steady-state limit.
Why Kubernetes will not stop it on its own
Kubernetes sees exit code 137 records an OOMKill event and restarts the container with the same memory limit. If the same workload conditions persist, the pod will be killed again. This cycle repeats indefinitely until a human manually edits the deployment spec. For the manual side of pod restarts and when to use them, see the kubectl restart pod guide. That is precisely what Middleware OpsAI automates.
How to auto-fix Kubernetes OOMKill errors with OpsAI
The scenario
A Node.js API service in the production namespace has a memory limit of 512Mi. Normal usage sits around 320Mi. A new feature released on Tuesday starts buffering large response payloads in memory. By Saturday morning, the pod has been OOMKilled four times in six hours.
What kubectl shows before OpsAI acts
$ kubectl get pods -n production

NAME                           READY   STATUS      RESTARTS   AGE
api-server-7d9f6b8c4-x2pqr     0/1     OOMKilled   4          2h
api-server-7d9f6b8c4-nklt9     1/1     Running     0          45m

$ kubectl describe pod api-server-7d9f6b8c4-x2pqr -n production

Last State:  Terminated
  Reason:    OOMKilled
  Exit Code: 137
  Finished:  Sat, 25 May 2026 04:18:44 +0000

Limits:    memory: 512Mi
Requests:  memory: 256Mi
OpsAI five-step auto-fix flow: no human needed
Step 1: Detect and classify the failure. OpsAI receives the OOMKilled event within seconds of the kernel kill. Exit code 137 confirms a memory limit breach. Four kills in six hours crosses the anomaly threshold, triggering a full root-cause investigation rather than a simple log entry.
Step 2: Pull memory usage history. OpsAI retrieves seven days of memory working-set data for this container. It identifies the upward trend starting Tuesday, correlates it with that deployment’s rollout, and confirms the 512Mi limit now has less than 5% headroom before kill.
Step 3: Calculate the correct new limit. OpsAI checks for an existing VPA recommendation. If none exists, it computes one from first principles: P99 memory usage over seven days plus a 30% safety buffer. Result: 768Mi limit, 384Mi request.
Step 4: Apply the patch. In Auto Fix mode, OpsAI generates a strategic merge patch and applies it through the Kubernetes API. The deployment performs a rolling update with zero downtime. Full patch details are in the OpsAI documentation.
Step 5: Confirm and notify. Once the new pods are stable and memory usage is confirmed to be below the new limit, OpsAI sends a Slack summary. No page is generated. The on-call engineer sees a digest in the morning.
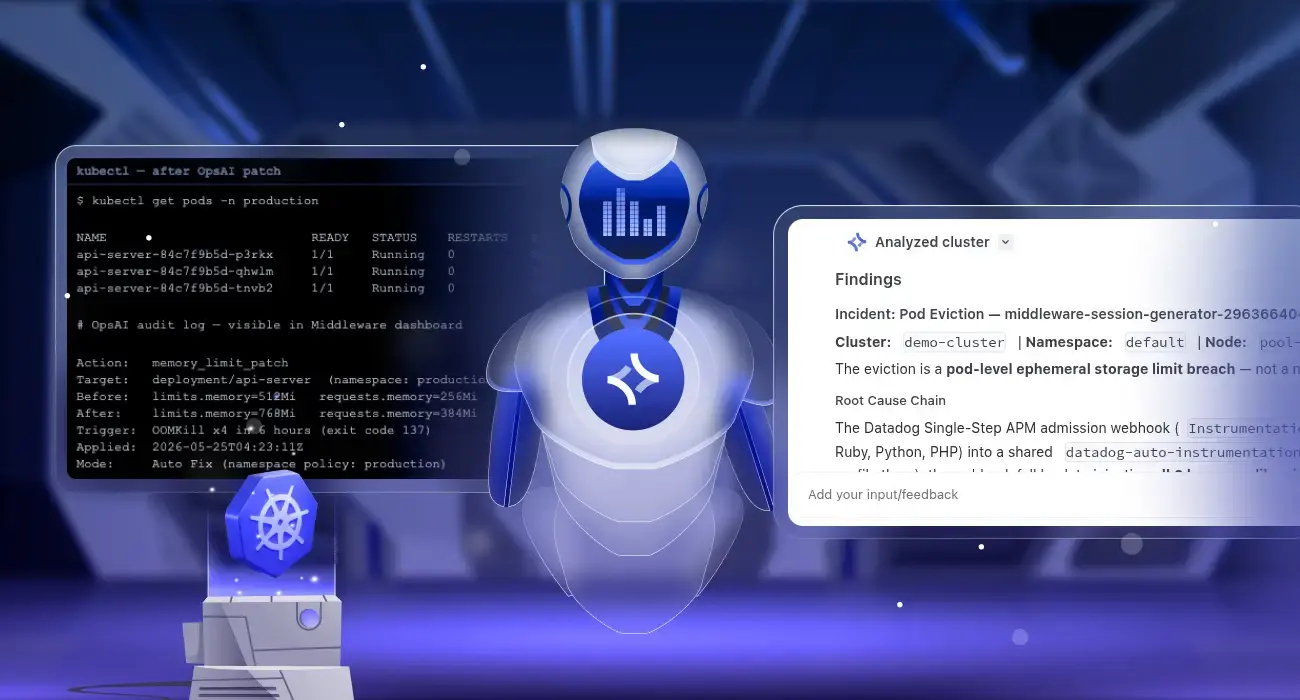
What kubectl shows after OpsAI fixes the pod
$ kubectl get pods -n production

NAME                           READY   STATUS    RESTARTS   AGE
api-server-84c7f9b5d-p3rkx     1/1     Running   0          8m
api-server-84c7f9b5d-qhwlm     1/1     Running   0          7m
api-server-84c7f9b5d-tnvb2     1/1     Running   0          6m

# OpsAI audit log — visible in Middleware dashboard

Action:   memory_limit_patch
Target:   deployment/api-server  (namespace: production)
Before:   limits.memory=512Mi   requests.memory=256Mi
After:    limits.memory=768Mi   requests.memory=384Mi
Trigger:  OOMKill x4 in 6 hours (exit code 137)
Applied:  2026-05-25T04:23:11Z
Mode:     Auto Fix (namespace policy: production)
Tired of OOMKill alerts waking you up? OpsAI fixes memory limit issues automatically using real usage data not guesswork. Connect your cluster in under 5 minutes. Start free — no credit card · Book a demo
What causes a pod to keep restarting in Kubernetes and how can AI fix CrashLoopBackOff automatically?
CrashLoopBackOff is not a specific error. It is a Kubernetes status meaning “this container has restarted repeatedly and keeps failing.” For a complete reference of all common Kubernetes errors and fixes, see Kubernetes common errors and how to fix them. The actual root cause can be any of the following:
- A missing or incorrectly named environment variable
- A broken ConfigMap or Secret reference (bad volume mount)
- A failed database connection at startup
- An application-level exception before the process is ready
- A liveness probe that fires before the app has fully initialized
Native Kubernetes cannot distinguish between these causes. It restarts the container regardless. OpsAI identifies the real cause by reading the exit code and the log tail from each crash cycle, then cross-referencing with live cluster state. This is powered by Middleware log monitoring, which ingests and pattern-matches container logs in real time.
CrashLoopBackOff: How OpsAI Finds the Real Cause
CrashLoopBackOff means Kubernetes has tried restarting a container multiple times and keeps failing. It is not a specific error, it is a symptom. The actual cause could be a missing environment variable, a broken ConfigMap reference, a failed database connection, a startup exception in the app code, or a liveness probe that fires before the app is ready.
OpsAI identifies the real cause by reading the exit code and the log tail from each crash cycle, then checking that against the cluster state. Here is how each exit code maps to a root cause:
| Exit code | Meaning | OpsAI action |
|---|---|---|
1 with stack trace | Application error or missing config | Log analysis + config patch |
137 | OOMKill (kernel SIGKILL, signal 9) | Memory limit patch (see above) |
143 | Process terminated via SIGTERM (signal 15) | Liveness probe timeout investigation |
Note on exit code 143: This equals 128 + 15 (SIGTERM). It typically means a liveness or readiness probe forcibly terminated the process, often because the application takes longer to start than the probe’s initialDelaySeconds allows. This is a probe misconfiguration, not an application crash.
Example: broken ConfigMap reference
$ kubectl get pod worker-6d8b9f4c7-zmpvt -n staging

NAME                         READY   STATUS              RESTARTS   AGE
worker-6d8b9f4c7-zmpvt       0/1     CrashLoopBackOff    9          31m

$ kubectl logs worker-6d8b9f4c7-zmpvt -n staging --previous

Error: Cannot find module '/app/config/settings.json'
    at Function.Module._resolveFilename (node:internal/modules:1039:15)
npm ERR! code 1
OpsAI reads exit code 1 and the log message, then audits the cluster state. It finds that a recent deployment renamed the ConfigMap from worker-settings to worker-config but did not update the volume mount reference in the deployment spec. OpsAI identifies this mismatch as the root cause, patches the volume reference to point to the correct ConfigMap name, and triggers a rolling restart.
For cases where log analysis points to an ambiguous application error (something that may require a code change rather than a config patch), OpsAI switches to Auto RCA mode and presents the full diagnosis with a proposed fix for human review, even in namespaces where Auto Fix is enabled.
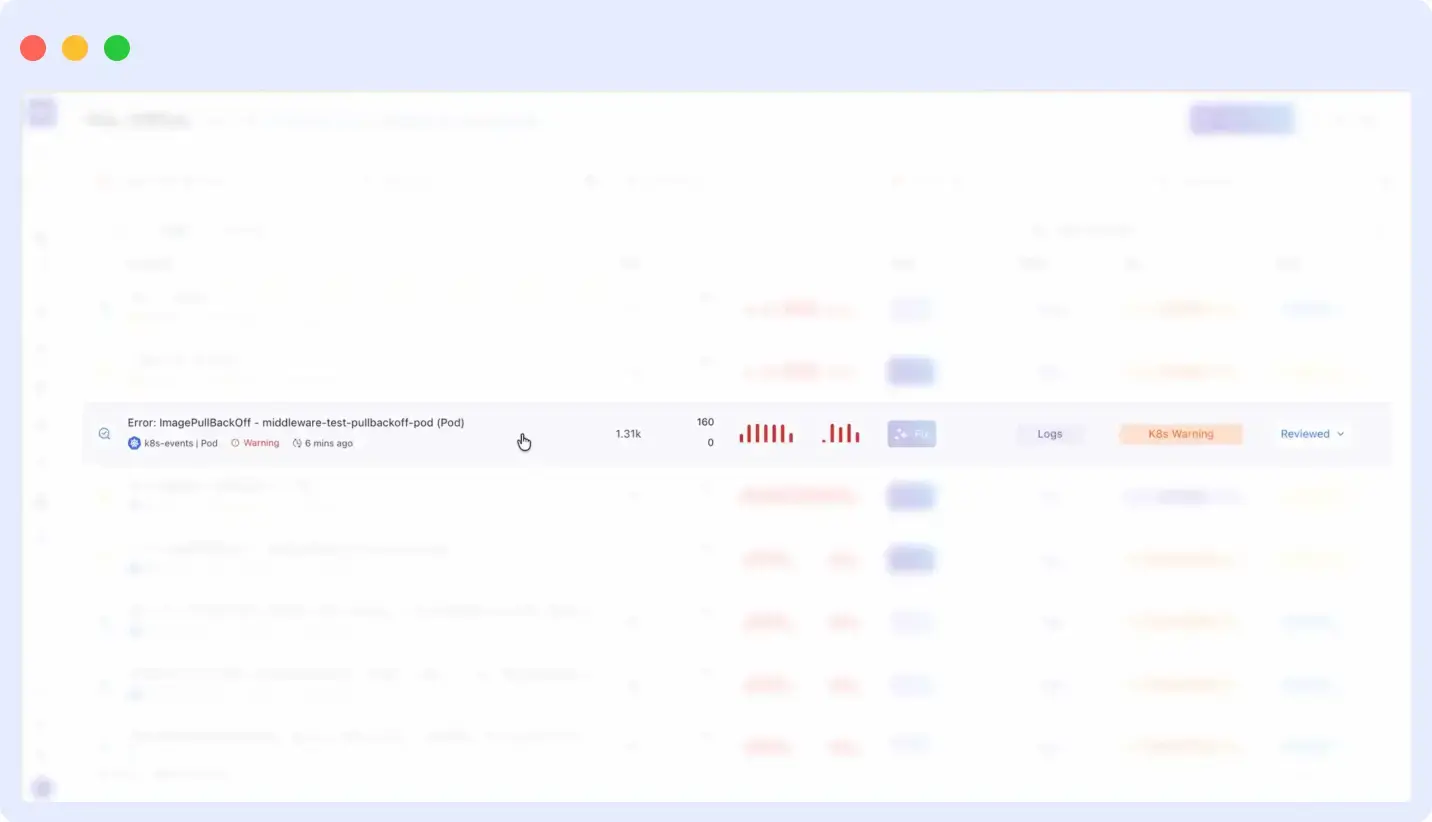
Example: ImagePullBackOff auto-fix with OpsAI
OpsAI also handles ImagePullBackOff errors another common cause of CrashLoopBackOff that native Kubernetes cannot self-resolve. When a pod fails because the container image reference is broken or points to a nonexistent tag, Kubernetes keeps restarting it with the same bad image spec indefinitely. OpsAI detects the failure, searches the connected repository for the broken image reference, identifies the exact line in the pod spec causing the issue, patches k8s/pod.yaml, and opens a pull request automatically with no manual investigation required.
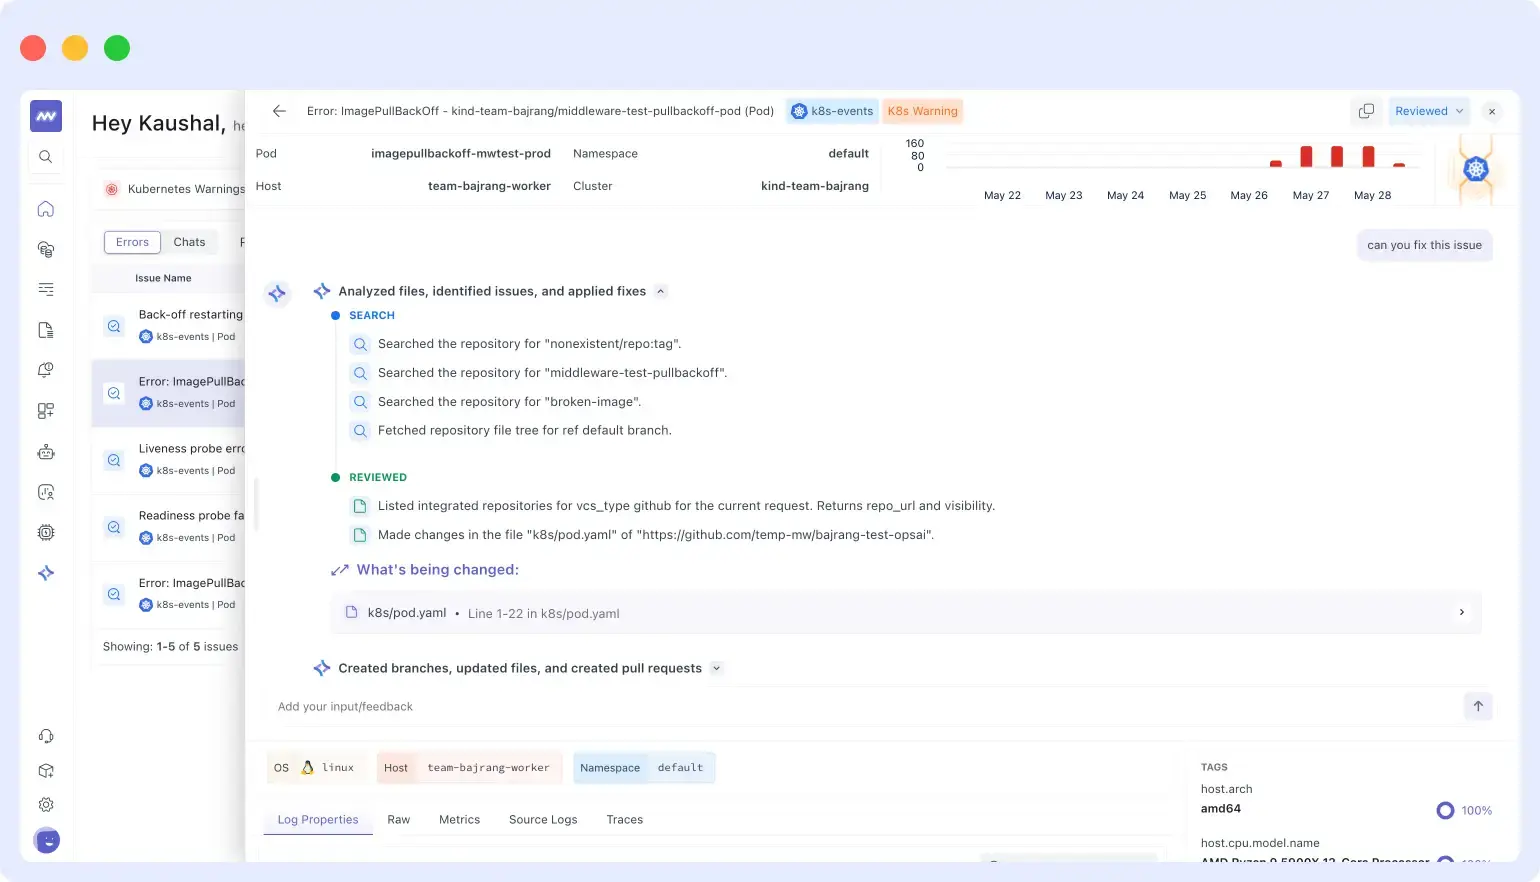
OpsAI Auto Fix in action on an ImagePullBackOff error it searched the repo for the broken image tag, identified the exact file and line, made the change in k8s/pod.yaml, and opened a pull request. The full fix trail is visible in the dashboard.
Can an AI agent automatically adjust HPA settings when it detects misconfiguration?
Yes, and this is one of the most valuable things OpsAI does because HPA misconfiguration rarely generates an alert. Pods are running. The cluster looks healthy. But traffic is being throttled, latency is climbing, and the autoscaler is silently hitting its ceiling. Standard alerting misses this entirely because there is no crash event to fire on, just slow and quiet degradation.
OpsAI detects HPA misconfiguration by watching the gap between what the HPA is configured to do and what is actually happening in the cluster. For a broader comparison of how OpsAI fits against other AI-driven SRE tools, see the 10 best AI SRE tools for 2026. It monitors three patterns:
Pattern 1: Latency rising but no scale-out triggered
The HPA’s scaling metric (usually CPU) stays below its threshold while user-facing latency climbs. This happens when the real bottleneck is memory, I/O, or connection pool exhaustion (metrics the HPA is not configured to watch). Understanding which Kubernetes metrics to track is key to setting up HPA scaling rules that reflect actual service health. OpsAI spots the disconnect between the scaling signal and actual service health.
Pattern 2: Rapid scale-up followed immediately by scale-down (thrashing)
The HPA oscillates between replica counts within a short window. This wastes resources and causes instability. Common causes: stabilizationWindowSeconds is too short, metric variance is too high, or targetAverageUtilization is set too aggressively.
Pattern 3: HPA pinned at maxReplicas for an extended period
$ kubectl get hpa checkout-service -n production

NAME               REFERENCE                TARGETS        MIN  MAX  REPLICAS  AGE
checkout-service   Deployment/checkout      cpu: 92%/70%   3    8    8         2d

$ kubectl describe hpa checkout-service -n production

Conditions:
  ScalingLimited  True  TooManyReplicas
    'the desired replica count is more than the maximum replica count'

Events:
  15m   SuccessfulRescale   New size: 8; reason: cpu utilization above target
  38m   SuccessfulRescale   New size: 8; reason: cpu utilization above target
  61m   SuccessfulRescale   New size: 8; reason: cpu utilization above target
OpsAI detects the HPA has been capped at maxReplicas for over two hours while service latency is 40% above its SLO baseline. It reviews historical peak load data, calculates that maxReplicas should be 14 instead of 8, and either patches the HPA directly (Auto Fix mode) or presents the change for one-click approval in the Middleware dashboard (Auto RCA mode). See the OpsAI documentation for full configuration options.
Kubernetes liveness probes vs AI-based auto-remediation
This distinction is frequently misunderstood. Liveness probes and OpsAI operate at completely different layers of the stack and solve different problems. Both are needed in production.
| Kubernetes liveness probes | OpsAI auto-remediation | |
|---|---|---|
| Layer | Availability | Root cause |
| Question answered | “Is this container currently healthy?” | “Why did this container fail, and how do I prevent recurrence?” |
| Action taken | Kills and replaces an unhealthy container | Changes the configuration, resource limits, or autoscaler settings causing the failure |
| Memory of past failures | None (each probe check is stateless) | Full historical context: usage trends, deployment history, prior incidents |
| Fixes the underlying problem | No | Yes |
| Scope | Single container health check | Full-stack: Kubernetes events, metrics, logs, APM, infrastructure |
Liveness probes are about availability: they keep bad pods out of the load balancer and bring replacements in. OpsAI is about prevention: it changes the underlying configuration so the same failure does not recur. Running OpsAI does not replace liveness probes. It builds on top of them. You can see how the full observability stack connects in Middleware’s Kubernetes monitoring guide.
Auto RCA mode vs Auto Fix mode
OpsAI has two operating modes, configurable at the namespace level. The core difference is whether OpsAI applies a fix autonomously or waits for a human to approve it. You can read how this compares to other approaches in the AI SRE tools roundup.
Auto RCA mode: diagnose and propose, human approves
OpsAI runs a complete root-cause investigation in seconds (reading events, metrics, logs, and cluster state), then presents a ready-to-apply fix in the Middleware dashboard. Nothing changes in your cluster until you click Approve.
- Full investigation completes in under 30 seconds
- Fix is written out clearly with before/after diff
- One-click apply from the dashboard
Best for: Production namespaces with change approval policies
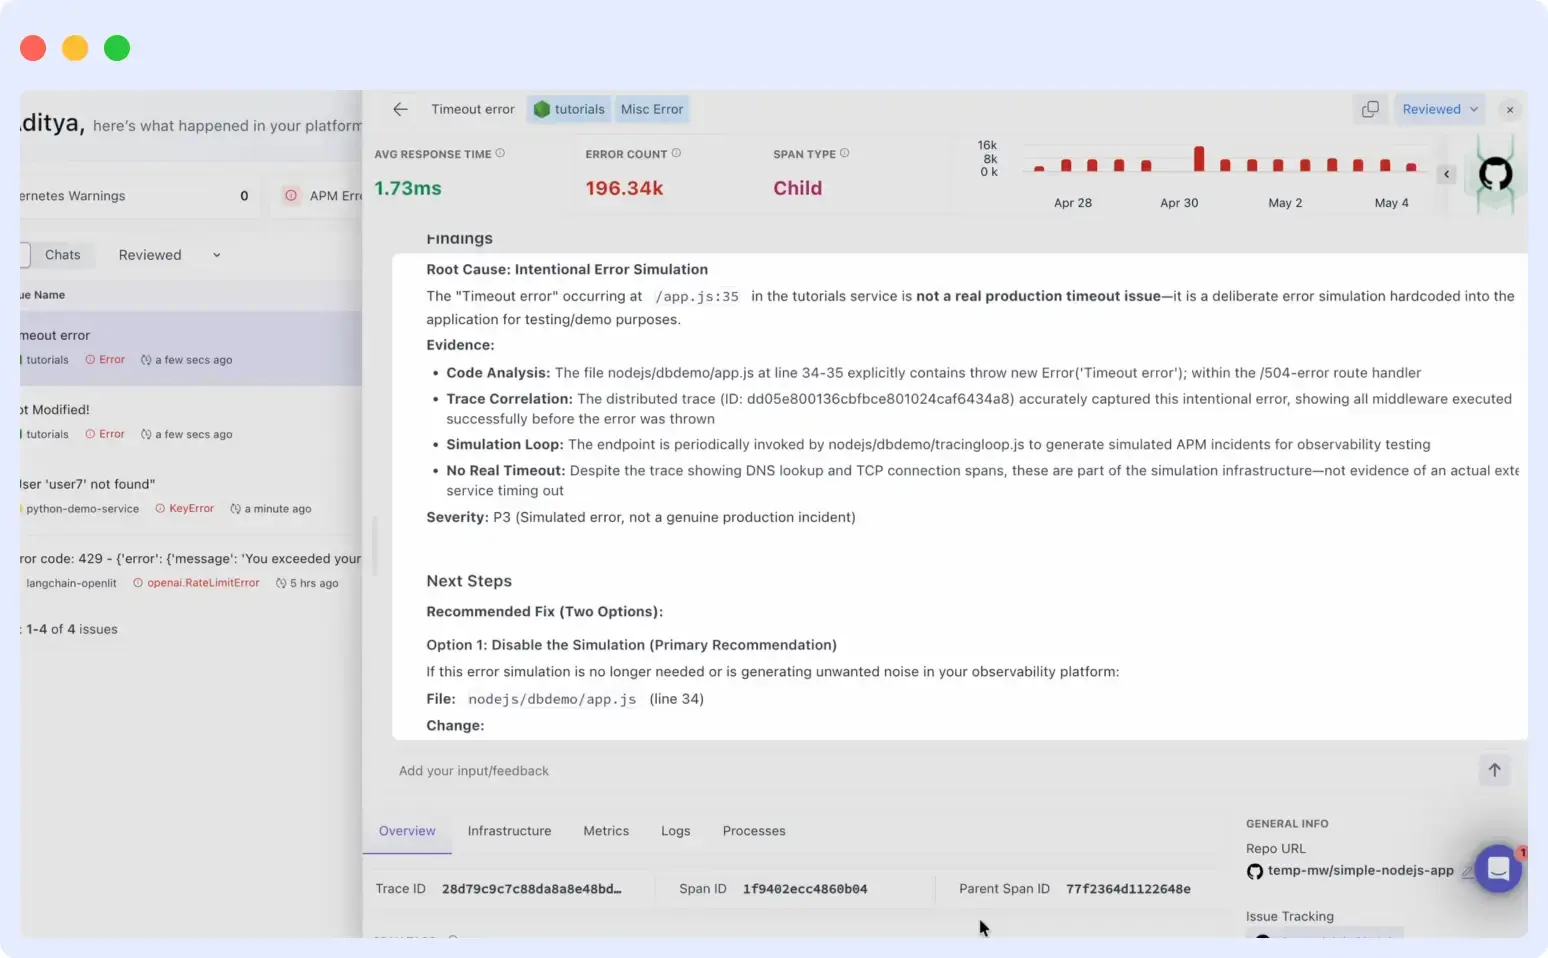
OpsAI Auto RCA panel showing a complete root cause investigation findings, evidence (code analysis, trace correlation), severity rating, and two ready-to-apply fix options, all prepared and waiting for one-click human approval.
Auto Fix mode: detect, diagnose, and fix automatically
OpsAI runs the same investigation and then applies the fix directly to the cluster, or opens a pull request for code-level issues. No human step is needed.
- Detect-to-fix latency measured in seconds, not minutes
- Memory limit patches applied immediately after OOMKill pattern is confirmed
- HPA and resource limits updated automatically
- Confidence threshold is configurable per namespace
Best for: Staging and development namespaces where speed matters and rollback is trivial
Recommended configuration for most teams
| Namespace | Recommended mode | Reason |
|---|---|---|
production | Auto RCA | Every cluster change reviewed before apply; review takes around 30 seconds with OpsAI’s prepared analysis |
staging | Auto Fix | Speed matters; wrong fixes are easy to revert |
dev | Auto Fix | Frictionless remediation for developer environments |
How to automate Kubernetes pod crash recovery without writing custom scripts
Custom remediation scripts are a common first approach: write a script that watches for OOMKilled events and bumps memory limits. They work within limits. For the manual troubleshooting techniques teams use before adopting automation, see top 10 Kubernetes troubleshooting techniques. Here is why Middleware OpsAI is a better long-term approach:
| Custom scripts | Middleware OpsAI | |
|---|---|---|
| Failure patterns covered | Only patterns you have already seen and coded for | Dynamic analysis across any failure pattern, including novel ones |
| Context used | Usually a single signal (the event type) | Cross-references events, metrics, logs, APM, and deployment history simultaneously |
| Audit trail | Manual logging if you built it | Immutable audit log built in with every action, signal, confidence score, and before/after state |
| Change approval integration | Manual | Native integration with standard change management workflows |
| Maintenance overhead | High (scripts need updates as your stack evolves) | Zero (OpsAI learns workload baselines continuously) |
| HPA and VPA awareness | Typically none | First-class (monitors autoscaler state as a primary signal) |
What OpsAI fixes automatically vs what needs human approval
The table below shows default behavior. Everything is configurable through namespace-level policies in OpsAI settings. Check Middleware pricing to see which plan includes auto-remediation.
| Scenario | What OpsAI does | Approval required? |
|---|---|---|
| Pod OOMKilled 3+ times in 6 hours | Patches memory limits using P99 usage + 30% buffer. Rolls out via rolling update. | Auto Fix |
| CrashLoopBackOff from broken ConfigMap or volume mount | Fixes the volume mount reference. Triggers rolling restart. | Auto Fix |
| HPA stuck at maxReplicas while latency is rising | Reviews historical load data and updates maxReplicas. Patches HPA spec. | Human Review (prod) |
| CrashLoopBackOff with ambiguous application error | Full RCA. Opens GitHub PR with proposed code fix. | Human Review |
| Node pressure causing pod evictions | Reschedules affected pods. Alerts on node capacity shortfall. | Auto Fix / Human Review |
| Memory limit increase would double the current value | Always escalates regardless of namespace policy. | Human Review |
| Single OOMKill, first occurrence | Logs event, runs lightweight check, monitors for recurrence. | Monitor Only |
Every action OpsAI takes is recorded in an immutable audit log in the Middleware dashboard, including the exact patch applied, signals that triggered it, confidence score, and before/after pod state. The log is exportable and integrates with standard change management workflows.
See Auto Fix and Auto RCA in action. Middleware OpsAI works across your entire stack Kubernetes, APM, logs, and infrastructure in one platform. Start free · View pricing
How OpsAI watches your Kubernetes cluster
OpsAI connects through the Middleware agent and streams the following signals simultaneously, cross-referencing all of them within 30 seconds of a failure event. For a broader look at how Middleware surfaces workload failures visually, see troubleshooting Kubernetes workloads with Middleware:
- Kubernetes Events API: OOMKilled, CrashLoopBackOff, BackOff, FailedMount, Evicted, and all Warning-level events
- Pod phase transitions: Every Pending to Running to Failed transition with timestamps
- Resource metrics: CPU throttling, memory working set vs limit, restart counts, node pressure
- Container logs: Ingested and matched against failure patterns in real time
- HPA and VPA state: Autoscaler conditions, current vs desired replica counts, metric source health
- Deployment history: Recent rollouts, ConfigMap changes, and spec diffs correlated with failure timing
How to connect OpsAI to your Kubernetes cluster
Install the Middleware agent once as a DaemonSet. OpsAI starts streaming data immediately. Full steps are in the Kubernetes agent installation docs. For a walkthrough of the full monitoring setup, see Kubernetes application monitoring with Middleware.
# Step 1: Add the Middleware Helm repo
helm repo add middleware https://helm.middleware.io
helm repo update

# Step 2: Install the agent with OpsAI enabled
helm install mw-agent middleware/mw-agent \
  --namespace middleware \
  --create-namespace \
  --set mw.apiKey=YOUR_API_KEY \
  --set opsai.enabled=true \
  --set opsai.autoFix.namespaces="staging,dev"

# Step 3: Verify the agent is running
kubectl get pods -n middleware

NAME                     READY   STATUS    RESTARTS   AGE
mw-agent-ds-node-01      1/1     Running   0          2m
mw-agent-ds-node-02      1/1     Running   0          2m
What happens after installation:
- With real-time, OpsAI can detect anomalous patterns against early baselines
- Ongoing: OpsAI continuously refines baselines as workloads evolve
See Middleware pricing for plan details, including OpsAI auto-remediation.
Connect your cluster and let OpsAI fix its first incident usually within minutes of installation. No credit card required. Works with any Kubernetes distribution. Get started free · Book a live demo
FAQs
Does Kubernetes fix OOMKilled pods automatically?
Kubernetes restarts an OOMKilled pod automatically but does not fix the root cause. The pod restarts with the same memory limit and will be OOMKilled again under the same workload conditions. Middleware OpsAI patches the memory limit based on actual usage history so the crash does not repeat.
What causes a pod to keep restarting in Kubernetes?
The most common causes are: memory limit too low (OOMKill, exit code 137), broken ConfigMap or Secret reference (exit code 1 with a missing-file error in logs), liveness probe firing too early (exit code 143), application startup exception, or a failed dependency like a database connection. Each has a distinct signature in exit codes and logs, which is how OpsAI identifies and fixes them.
How does Kubernetes self-healing work and what are its limits?
Kubernetes self-healing keeps pods running through container restarts, liveness probes, ReplicaSet enforcement, and node failure recovery. The limit is that it only reacts to failures. It never diagnoses them or prevents recurrence. It restarts a pod with the same broken configuration every time. See the Kubernetes monitoring guide for a full overview of what Kubernetes exposes for observability.
Can an AI agent automatically adjust HPA settings when it detects misconfiguration?
Yes. Middleware OpsAI monitors HPA behavior (not just pod health) and detects patterns like thrashing, scale-up lag, and maxReplicas being hit repeatedly. In Auto Fix mode it patches the HPA spec directly. In Auto RCA mode it prepares the change for one-click human approval.
How can I automate Kubernetes pod crash recovery without writing custom scripts?
Middleware OpsAI installs via a single Helm command and immediately begins watching for failure patterns across OOMKills, CrashLoopBackOff, and HPA issues. Unlike custom scripts, it handles novel failure patterns dynamically, maintains a full audit trail, and integrates with change approval workflows with no script maintenance required.
Does Kubernetes self-healing fix OOMKilled pods automatically?
No. Kubernetes restarts an OOMKilled pod automatically, but it restarts it with the same memory limit that caused the kill in the first place. The pod will be OOMKilled again under the same workload conditions. Kubernetes keeps your pods running. It does not fix the underlying configuration that is causing them to fail.