
Kubernetes workloads often fail due to configuration errors, resource limits, or dependency problems. Troubleshooting these issues manually takes time, requires kubectl commands, and provides no clear visibility into the root cause.
This guide explains the most common Kubernetes workload failures and shows how Middleware’s automated observability speeds up detection, diagnosis, and resolution.
Kubernetes workload troubleshooting becomes even harder as applications scale, making it essential to have complete visibility into pod health, resource usage, and system events.
👉For a deeper dive into cluster monitoring, check out Kubernetes Monitoring.
What are Kubernetes Workloads?
Any app running in your Kubernetes cluster is considered a workload. It might be a DaemonSet, StatefulSet, or Deployment. These are the objects that run your APIs or web servers.
Misconfigured workloads, bad deployments, memory leaks, or dependency failures are the most common causes of pod crashes.
Workloads handle:
- Container execution
- Replica scaling
- Updates and rollouts
- Failure recovery
Proper Kubernetes workload troubleshooting helps teams detect failures early, reduce outages, and maintain stable application performance across clusters.
How Do You Identify and Fix Kubernetes Workload Health Issues?
Performance, stability, and availability are issues for Kubernetes workloads. Problems come from resource limits, configuration flaws, and dependency failures.
Manually running kubectl describe and logs to fix these issues is difficult. Middleware solves this by automating detection and providing root-cause insights.
👉 Want to know more Kubernetes common errors and how to fix them?
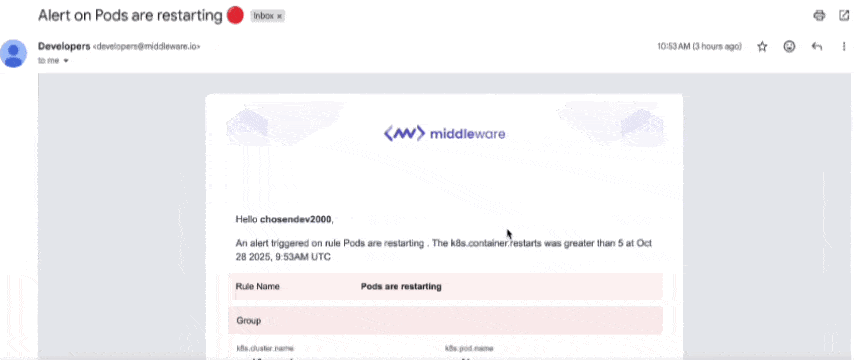
How to Troubleshoot CrashLoopBackOff in Kubernetes
Manually, when you start a deep inquiry and a pod enters CrashLoopBackOff, you have to switch between YAML files, monitoring dashboards, and kubectl commands to identify the issue. This strategy involves multiple tools and is time-consuming. This slows Kubernetes workload troubleshooting because engineers must review logs, YAML configurations, and cluster events separately.
💡 Learn how to monitor applications inside Kubernetes effectively: Monitoring Kubernetes Applications with Middleware.
How Middleware Helps
Middleware makes diagnosing and fixing CrashLoopBackOff errors dramatically easier by giving you complete visibility into why the pod is crashing and what happened before each restart.
Instead of switching between kubectl, logs, and metrics dashboards, Middleware brings everything into one correlated view.
1. Shows the Exact Reason for the Crash
Middleware identifies whether the CrashLoopBackOff was caused by:
- Failed environment variables
- Bad config changes
- Application exceptions
- Probe failures
- Resource limits
- Dependency failures
You see the root cause instantly, without manually digging through events.
2. Correlates Logs, Metrics & Events Automatically
- Pod logs (before the crash)
- CPU/memory spikes
- Deployment changes
- Network failures
- Probe failures
So you can see what happened right before the pod crashed.
This is something kubectl logs alone can’t do, mainly because logs often disappear after the restart.
3. Provides Instant Alerts With Root-Cause Context
When a pod enters CrashLoopBackOff, you get:
- The workload name
- The failing container
- Restart count
- The root cause
- Impacted services
You can receive alerts via Slack, Email, PagerDuty, etc.
No more guessing or waiting to discover failures manually.
4. Detects Misconfigurations Automatically
Middleware flags common causes such as:
- Wrong image tag
- Invalid env vars
- Incorrect command/args
- Broken liveness/readiness probes
- Missing secrets/configmaps
You get recommendations for fixing the issue.
5. Shows Timeline of Crashes for Faster Debugging
Middleware keeps a restart timeline, helping you understand:
- When pods started crashing
- Whether it began after a deployment
- Whether the issue is intermittent
- Whether a traffic spike triggered it
This is extremely useful for postmortem analysis.
6. Tracks Related Services via Dependency Map
CrashLoopBackOff often happens because:
- A dependent service failed
- A database is unreachable
- A downstream API timed out
Middleware visualizes service dependencies to show which upstream or downstream service might be causing the crash.
7. Enables Auto-Remediation
Using OpsAI, Middleware can even auto-trigger fixes like:
- Restarting stuck pods
- Reverting bad deployments
- Rescheduling pods to healthy nodes
This helps reduce MTTR from minutes to seconds.
Let’s say your payment-service pod keeps restarting right after a config update. Middleware can trace that back to a missing environment variable; it’ll show the deployment change, surface the error logs, and point out which variable caused the crash.
Middleware fixes CrashLoopBackOff faster by correlating logs, metrics, events, and config changes into a single view, so you know precisely why the pod is crashing and how to fix it.
🔁 Want to learn how to safely restart pods? Check out our full guide on restarting Kubernetes pods using kubectl.
Without Middleware, you will run many kubectl commands, read logs, and estimate the problem. Middleware lets you open one alert, find the problem, and fix it immediately.
How to Find and Fix OOMKilled Errors in Kubernetes
OOM-killed errors cause a pod to be killed for exceeding its memory limit; however, diagnosing them after the pod and its logs are gone is difficult. A pod for exceeding its memory limit, but the real challenge is diagnosing it after the pod and its logs are gone.
The manual process is not time-friendly. OOM-killed errors are one of the most common problems teams face during Kubernetes workload troubleshooting, especially when logs disappear after restarts.
💡 Facing unexpected pod shutdowns? Discover what exit code 137 means and how to fix it in Kubernetes.
To put together what happened, you’re forced to switch between multiple tools to get a clear context. You have to:
- Confirm the Kill:
kubectl describe pod <pod-name> | grep OOMKilled- Find the Spike: Navigate Prometheus or Grafana dashboards to find high memory usage.
- Correlate the Cause: Manually link the surge to a recent deployment, code update, or traffic increase.
The back-and-forth is slow, and if the pod were restarting, critical data is often lost.
How Middleware Helps You Detect and Prevent OOMKilled Errors
Diagnosing OOMKilled errors manually is painful because logs disappear after the container dies, and memory metrics are scattered across multiple tools. Middleware solves these challenges by providing a complete, correlated view of why a pod was killed and how to prevent it from happening again.
⚡ Ready to try this in your own cluster? Install the Middleware Kubernetes Agent in minutes.
1. Detects OOM Risks Before a Pod is Killed
Middleware continuously analyzes memory usage and sends proactive alerts when a container approaches its memory limit.
You get early warnings like:
“Container is at 92% of memory limit — likely to be OOMKilled.”
This allows you to fix issues before Kubernetes terminates the pod.
2. Correlates Memory Spikes With Deployment Changes
Most OOMKilled errors happen after:
- A new build
- A config change
- A traffic spike
- A mis-set memory limit
Middleware correlates:
- Memory metrics
- Deployment events
- Logs
- Pod lifecycle events
So you immediately see what changed before the OOMKill happened.
3. Preserves Logs Even After the Pod Dies
When a pod is OOMKilled, kubectl logs often returns nothing.
Middleware stores and enriches logs before the crash so that you can see:
- The exact exception
- The memory spike pattern
- What the application was doing before its death
This is crucial for accurate debugging.
4. Shows the Exact Reason Kubernetes Killed the Pod
Instead of running:
kubectl describe pod | grep OOMKilledMiddleware highlights:
- Which container was killed
- The memory limit
- Peak usage at the time of crash
- The namespace and deployment that triggered it
You get instant clarity without having to search through events.
5. Identifies Memory-Leaking Workloads
Middleware surfaces workloads that:
- Frequently hit memory limits
- Show abnormal allocation patterns
- Leak memory over time
- Restart repeatedly due to OOMKills
This helps teams plan resource budgets and fix leaks early.
6. Provides Fix Recommendations
Based on historical data, Middleware suggests actions such as:
- Increasing or adjusting memory limits
- Fixing memory leaks in the application
- Optimizing JVM/Node.js/Python memory configs
- Scaling replicas based on traffic
- Reviewing heavy background tasks
These insights reduce trial-and-error debugging.
7. Supports Auto-Remediation With OpsAI
For critical workloads, Middleware’s OpsAI can:
- Automatically restart OOMKilled pods
- Reschedule them to healthier nodes
- Trigger scaling policies
- Prevent cascading failures
This dramatically reduces MTTR.
Middleware fixes OOMKilled errors faster by correlating memory metrics, logs, deployment changes, and events, giving you the exact root cause and preventing future crashes.
Pro Tip: With traditional methods, you find out about OOMKilled after a failure. With Middleware, you get a real-time alert showing the memory trend and the exact timestamp, saving you time to dig deep into logs.
How to Resolve Pending and ImagePullBackOff Pod Errors
Deployment can go smoothly, but the pod won’t start. It remains in Pending or ImagePullBackOff without errors. This is one of Kubernetes’ most annoying workload problems because the pod isn’t failing; it just won’t start.
Manual diagnosis includes searching scheduler events and registry logs. This can take hours.
The Manual Process
To determine the root cause, you need to execute these commands:
- For a Pending Pod:
kubectl describe pod <pod-name>   # Check 'Events' for scheduling failures
kubectl get nodes   # Check node capacity and readiness
kubectl describe node <node-name> # Inspect taints and resource pressure- For an ImagePullBackOff:
kubectl describe pod <pod-name>  # Locate image pull error
kubectl get secrets              # Check registry credentials
This procedure requires switching between pod events, node status, and secret settings, making it hard to grasp the big picture.
How Middleware Helps Fix ImagePullBackOff Errors
Middleware simplifies troubleshooting ImagePullBackOff errors by giving you full visibility into image-related issues and automating detection. Instead of manually checking image names, registry access, or secret configurations, Middleware highlights the exact cause instantly.
What makes it different:
1. Detects Image Pull Failures in Real Time
Middleware continuously monitors Kubernetes events, so when an image fails to pull due to a wrong tag, missing image, or private registry issues, you get an alert immediately. No more guessing what went wrong.
2. Shows Exact Error Messages & Pod Events
Middleware aggregates:
ErrImagePullImagePullBackOff- Authentication failures
- DNS/resolution errors
…all in one place.
You don’t need to run kubectl describe pod Repeatedly. Middleware displays it visually under your pod’s events.
3. Highlights Incorrect Image Tags or Missing Images
If your deployment references an incorrect image tag or the image doesn’t exist in the registry, Middleware clearly points out the failing container and its image path. This saves hours of manual debugging.
4. Detects Authentication Issues With Private Registries
Middleware alerts you when:
- ImagePullSecrets are missing
- Credentials are invalid
- Token has expired
- Registry is unreachable
This helps fix registry authentication issues quickly.
5. Centralized Dashboard for All Problematic Pods
On the Kubernetes Monitoring → Workloads page, the Middleware group shows all pods experiencing image failures.
You instantly know:
- Which deployments are affected
- Error frequency
- Timeline of failures
💡Pro Tip: Instead of running kubectl describe and guessing, Middleware delivers the root cause directly to your dashboard. You go from wondering, “Why is this pod stuck?” to knowing “why.”
The faster you diagnose an ImagePullBackOff, the quicker your workloads recover. Middleware removes the guesswork, reduces debugging time, and simplifies the fix of image-related errors across clusters.
Troubleshooting Liveness and Readiness Probe Failures
When Kubernetes fails a liveness or readiness probe, it signals a trust issue with your application. A liveness probe failure causes pods to restart constantly, while a readiness probe failure silently removes pods from service, leading to errors.
Your pod might appear to be running, but it might not pass its health checks. To find out, use kubectl describe pod <pod-name> and read the message.
You should also check the YAML file to see if the probe was misconfigured.
If the probe path or port is wrong, the container restarts repeatedly, even if the app runs fine.
How Middleware Helps Fix Liveness and Readiness Probe Failures
Liveness and readiness probe failures can silently disrupt your Kubernetes workloads. A liveness probe failure causes constant pod restarts, while a readiness probe failure removes pods from service without visible errors. Middleware simplifies troubleshooting by providing real-time insights and root cause analysis.
1. Centralized Probe Monitoring
Middleware tracks all liveness and readiness probe results across pods, deployments, and namespaces. You can immediately see:
- Failing probes
- Restarting pods
- Unavailable services
No more running kubectl describe pod on each pod manually.
2. Correlates Probe Failures With Metrics and Logs
Middleware links probe failures to:
- Node CPU, memory, and disk metrics
- Application logs
- Deployment changes
- Container events
This correlation helps you understand whether the failure is resource-related, config-related, or application-level.
3. Pinpoints Misconfigurations
If a probe path, port, or timeout is misconfigured, Middleware automatically flags it. You can see:
- Wrong HTTP endpoint
- Incorrect port number
- Too short
initialDelaySecondsorperiodSeconds
This eliminates guesswork in YAML files.
4. Tracks Historical Probe Failures
Middleware provides historical trends:
- How often does a pod fail probes
- Which deployments are affected most
- When failures started
This is critical for identifying intermittent issues or patterns.
5. Alerts Before Failures Affect Service
Middleware sends real-time alerts via Slack, PagerDuty, or email when a probe fails repeatedly. You can take action before downtime affects users, rather than react after a service degrades.
6. OpsAI Auto-Remediation
Middleware’s OpsAI can automatically:
- Restart pods failing probes
- Reschedule them to healthy nodes
- Roll back problematic deployments
This reduces downtime and eliminates repetitive manual intervention.
Probe failures are subtle but can cause cascading issues. Middleware turns silent probe errors into visible, actionable insights, helping teams maintain healthy Kubernetes workloads with minimal manual effort.
Fixing Kubernetes Network Connectivity Issues
A minor network issue can damage your Kubernetes cluster. One incorrect DNS setting, CNI misconfiguration, or a malfunctioning service endpoint can cause delayed requests, API failures, or service outages.
When you suspect a network issue, the normal process involves:
- Testing Basic Connectivity:
kubectl exec -it <pod-a> -- ping <pod-b-ip>
kubectl exec -it <pod-a> -- nslookup <service-name>- Checking Service Endpoints:
kubectl get endpoints <service-name>  # Verify pods are registered
kubectl describe service <service-name>- Inspecting Network Policies:
kubectl get networkpolicies --all-namespaces
kubectl describe networkpolicy <policy-name>- Examining CNI Pod Logs:
kubectl logs -n kube-system -l k8s-app=cilium # Example for CiliumAs usual, this approach requires navigating various sources without a clear picture.
🛠️ Troubleshooting not enough? Learn how to implement effective cluster-wide logging with Kubernetes Logging.
How Middleware Helps Fix Kubernetes Network Connectivity Issues
Middleware gives you a complete view of network health across clusters, services, and namespaces, so you will be able to spot and fix issues fast.
It helps you:
- Detect connection failures in real time to identify broken service links.
- Maps service dependencies to reveal which ones cause downstream timeouts.
- Correlates network issues with pod performance to show whether lag comes from the app or the network layer.
- Shows root cause insights, whether it’s DNS timeouts, blocked network policies, or CNI plugin issues.
How to Troubleshoot FailedMount Errors in Kubernetes
When Kubernetes cannot attach pod volumes, FailedMount errors arise. Sometimes, persistent volumes (PVs), persistent volume claims (PVCs), or storage class issues prevent pods from starting.
Common causes:
- PVC name mismatch or missing storage class
- Volume is still attached to another node
- IAM or access permission errors
- Network or CSI driver delays
The Manual Process
To determine why a volume failed to mount, you’d run:
kubectl describe pod <pod-name>
# Check the Events section for "FailedMount" messages
You can then inspect the claim or volume directly:
kubectl get pvc
kubectl describe pvc <claim-name>
# Check if it's bound to a PersistentVolume
If the volume isn’t bound, inspect PVs:
kubectl get pv
kubectl describe pv <volume-name>
# Look for status (Available, Bound, Released, or Failed)
You may also monitor the storage logs in the kube-system namespace or CSI driver pods (e.g., EBS, Ceph, or NFS) for mount issues.
How Middleware Helps
Middleware consolidates all this context into a single place, so you can quickly understand why your pod can’t access storage.
It provides:
- Clear Visibility: Detects FailedMount events and shows which PVCs or PVs are affected
- Link Insights: Correlates storage events with node and pod logs to determine whether the issue is configuration, permissions, or the storage backend.
- Historical Analysis: Lets you see recurring mount issues and track which workloads are most often affected.
How Do You Find and Resolve Node Resource Pressure?
When your Kubernetes node lacks CPU, memory, or storage space, everything fails. Evicting pods delays work and affects the cluster. Teams managing diverse production workloads often encounter this problem.
Unlike a single pod crash, node pressure affects multiple applications at once. You might notice symptoms like:
- Pod stuck in evicted or pending states.
- Nodes showing conditions like MemoryPressure, DiskPressure, or PIDPressure.
- Random performance declines without deployment changes.
These are signals that your node is overloaded, but determining the cause is difficult.
The Manual Way
You’ll start by describing the node to confirm issues:
kubectl describe node <node-name> | grep -i pressureYou might see:
MemoryPressure   True
DiskPressure     True
PIDPressure True
That indicates a problem, but not why.
You must analyze metrics, logs, and workloads that consume excessive resources. You may not receive all you want after doing all this.
How Middleware Makes this Easier
Middleware tracks node-level metrics across the cluster to show resource pressure. This will show what’s happening and why.
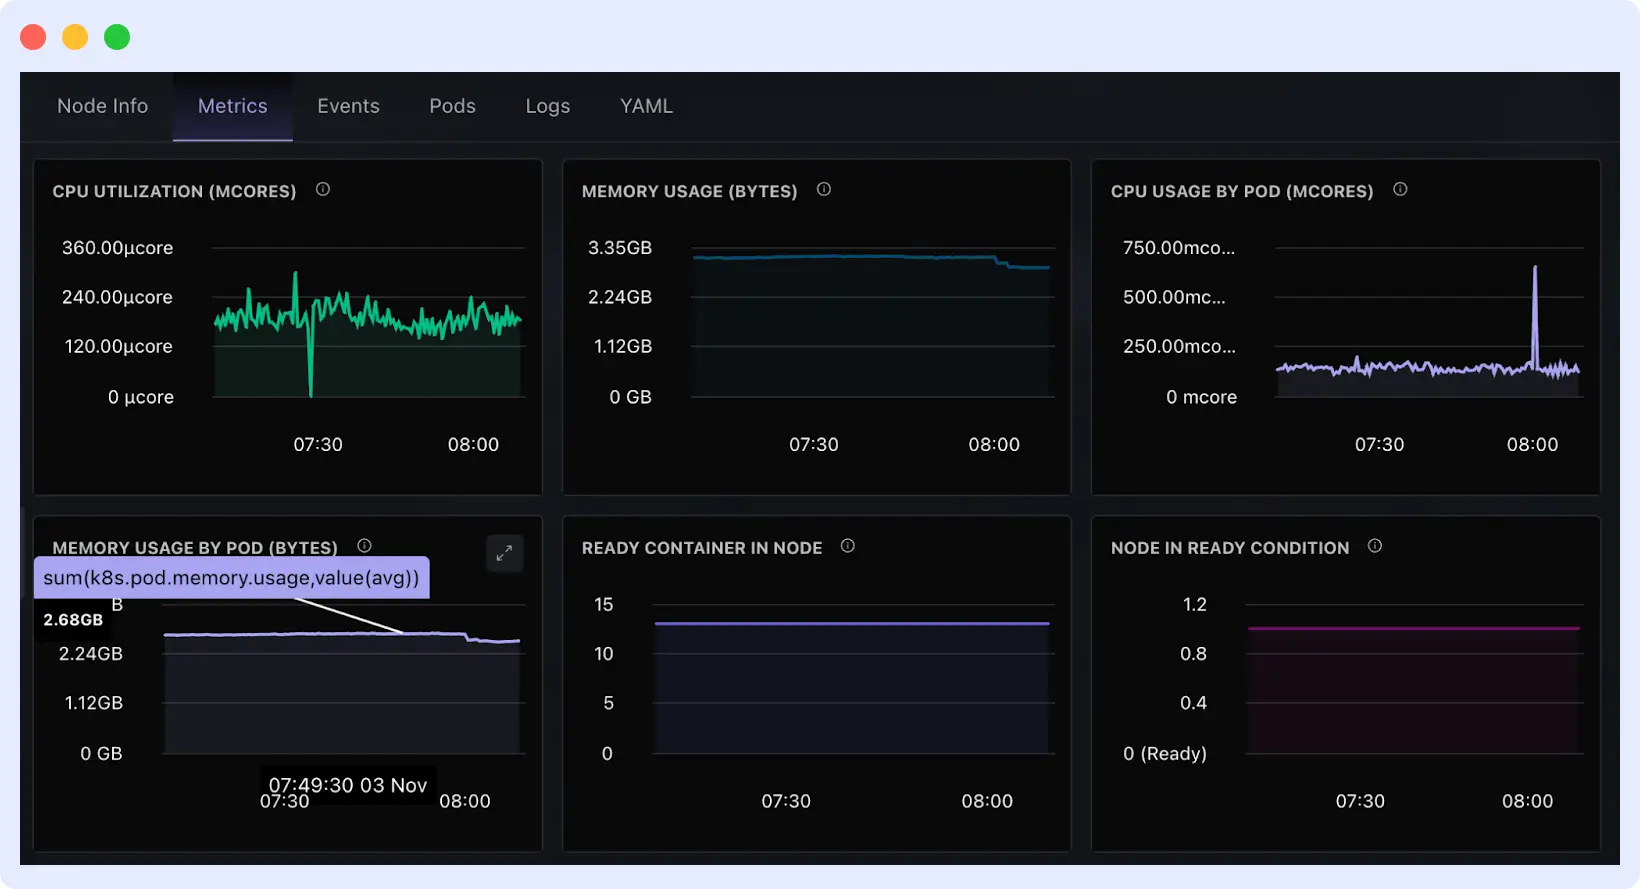
It provides:
- Unified Node Overview: Displays CPU, memory, and disk utilization for each node in one dashboard to rapidly identify pressured nodes.
- Auto-detection & Alerts: Middleware notifies when nodes or workload exhaust limits.
- Linked Insights: Correlates resource spikes with the deployments or namespaces responsible, helping you identify the root cause faster.
- Historical View: You will see when pressure started, what changed before it, and which updates or rollouts triggered the issue.
This detailed article on Kubernetes Troubleshooting Techniques covers more methods.
📈 Learn the key Kubernetes metrics you should track to prevent failures.
How Does Middleware Help You Troubleshoot Kubernetes Workload Issues?
Middleware provides visibility, automation, and speed to your Kubernetes system, making troubleshooting easier and allowing your team to act before downtime.
Kubernetes Troubleshooting: Manual vs Middleware
| Issue | Manual Approach | Middleware Approach |
| CrashLoopBackOff | Multiple kubectl, logs | Instant RCA + alerts |
| OOMKilled | Lost logs, manual graphs | Correlated metrics + predictions |
| Probe failures | YAML guessing | Config validation + logs |
| Pending pods | Node-level checks | Automated reason detection |
| FailedMount | Check PV/PVC manually | Mapped insights + alerts |
| Node pressure | Slow diagnosis | Live node heatmap |
Real-Time Workload Health Monitoring
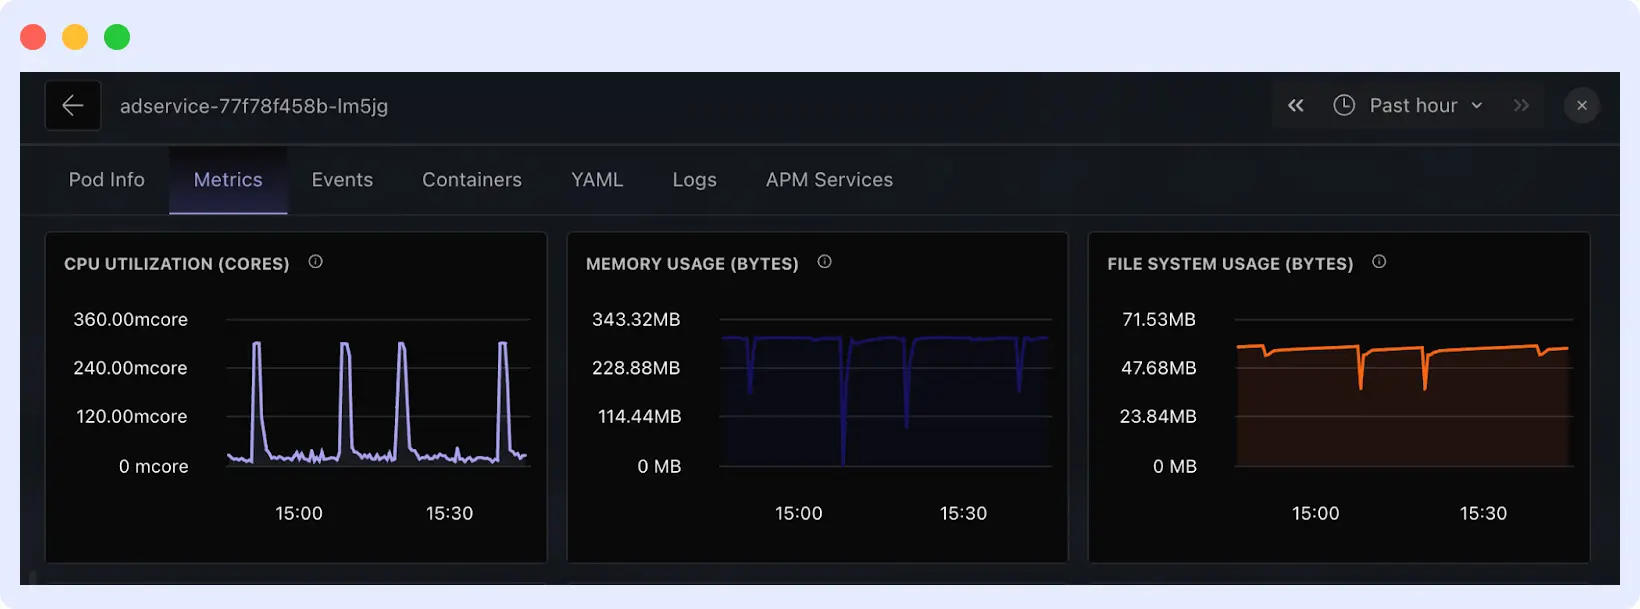
Middleware provides real-time pod status, performance, resource utilization, and health trends across clusters for Kubernetes applications. Workloads that overuse CPU, fail probes, or restart repeatedly are visible immediately.
Middleware also provides a single live dashboard for all workloads, rather than using kubectl or Grafana/Prometheus. This leads to earlier diagnosis, fewer surprises, and a greater understanding of what is good and what is unhealthy.
💡 Need a unified view of your workloads, nodes, and metrics? Explore our Kubernetes Observability guide now.
Alerts with Auto-Detection
Middleware alerts go beyond basic criteria. It notifies you via email, Slack, PagerDuty, or other tools when there are restart spikes, probe failures, or latency increases.
Your team is contacted when an issue arises, not after it becomes critical. Engineers can respond confidently without spending time piecing together logs, since alerts provide context and root causes.
Fast Root Cause Analysis
Usually, troubleshooting takes forever, jumping between commands, logs, and dashboards to piece things together. Middleware handles complex tasks. It links logs, metrics, and traces to show what happened, when it started, and what parts of your system were affected.
Instead of switching between k8 monitoring tools or running kubectl repeatedly, you get a clear view of the root cause right away.
OpsAI Auto-Remediation
Middleware’s OpsAI automatically fixes errors. This prevents failed states from affecting uptime, reschedules workloads to healthy nodes, and restarts unhealthy pods. So, workloads remain consistent and human error is reduced.
Engineers may focus on strategy, while OpsAI provides consistent, proven solutions grounded in your team’s history.
Historical and Trend Analysis
Middleware prevents and fixes problems. Historical performance data might identify workload issues, unhealthy patterns, and pre-production modifications.
Teams can then plan their resources, stabilize systems, and reduce Mean Time to Resolution (MTTR).
Middleware detects CrashLoopBackOff, FailedMount, and evicted pods in real time, simplifying Kubernetes troubleshooting. It finds the root cause by correlating logs, events, and metrics. OpsAI auto-remediation can restart unhealthy pods or reschedule workloads, which reduces downtime.
With Middleware, Kubernetes workload troubleshooting becomes faster, more accurate, and far more automated, reducing MTTR and improving cluster reliability.
Start a free trial or schedule a demo to make troubleshooting easier.
FAQs
How do I reduce MTTR in Kubernetes?
Middleware provides real-time insights, automated root cause, and historical data, which you can use to reduce MTTR.
How does Middleware help keep Kubernetes workloads healthy?
Middleware tracks pod and node health, detects failures early, and connects performance data with logs and events. It turns cluster data into clear, actionable insights.
Can Middleware monitor multiple Kubernetes clusters?
Yes. Middleware connects and monitors numerous clusters from a single dashboard, providing insight across dev, staging, and production environments.
What causes Kubernetes pods to restart frequently?
Pods restart due to app crashes, failed probes, OOMKilled errors, wrong configs, or resource limits. Middleware helps quickly identify the exact root cause.
How do I monitor Kubernetes workloads automatically?
Use an observability tool like Middleware that auto-discovers workloads and tracks logs, metrics, events, and performance without manual setup.
How do I get alerts for Kubernetes failures?
Set alert rules in Middleware to get instant notifications for pod crashes, restarts, failed deployments, or abnormal resource spikes.


