Organizations often struggle with the massive influx of data flooding their systems daily. This deluge presents a significant hurdle in efficiently processing, managing, and analyzing information in real-time.
Kafka emerges as a solution to this predicament, offering a robust platform designed to handle the continuous flow of data. Its architecture facilitates the smooth transmission of data across systems, enabling organizations to ingest, process, and distribute data at scale with fault tolerance and low latency.
In this article, we will dive into the world of Kafka, exploring its architecture and essential metrics for monitoring performance using Middleware.
What is Kafka?
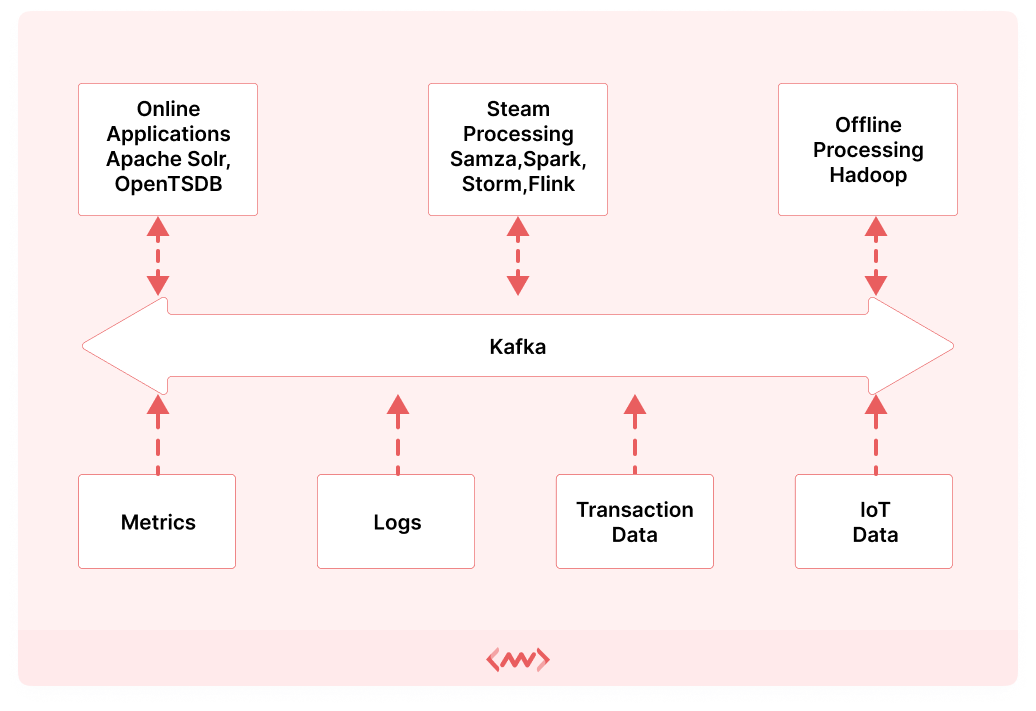
Kafka is an open-source distributed streaming platform designed for building real-time data pipelines and streaming applications. It provides a unified, high-throughput, fault-tolerant architecture for handling streams of data.
Users use Kafka for its ability to efficiently process, store, and transmit large volumes of data in real-time, making it ideal for use cases such as event-driven architectures, real-time analytics, log aggregation, and messaging systems.
Understanding the Kafka architecture
Kafka’s architecture comprises several key components that work together to provide a scalable, fault-tolerant, and high-throughput distributed streaming platform. At its core, Kafka architecture includes brokers, topics, partitions, producers, consumers, and ZooKeeper.
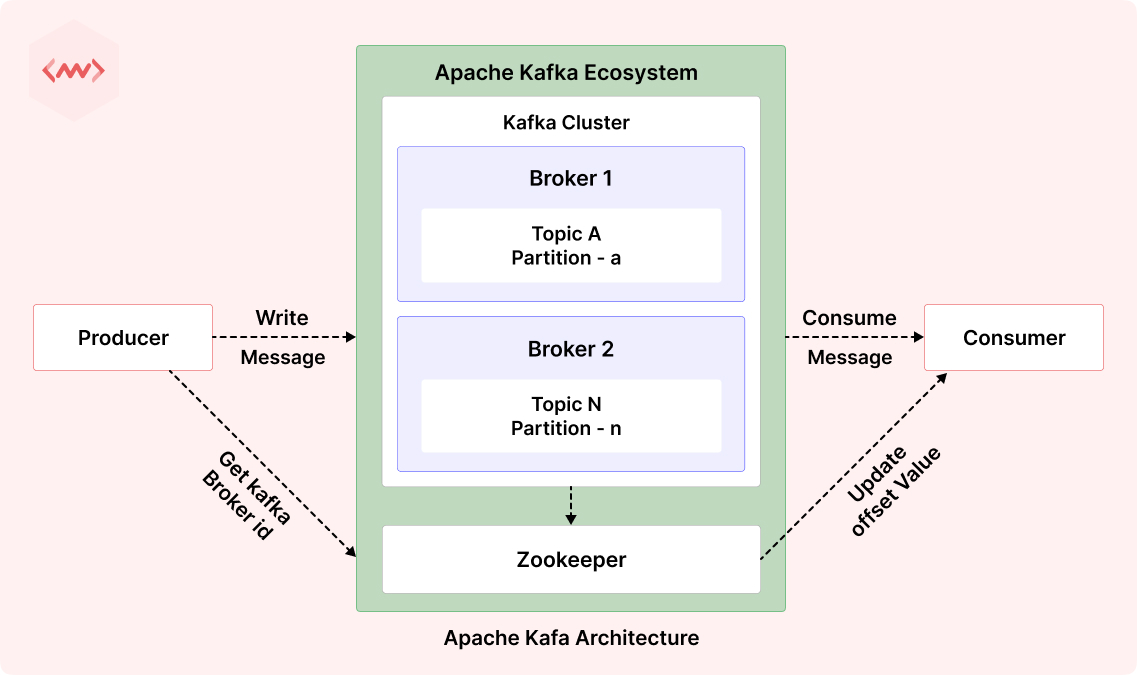
- Brokers: Manage data storage and exchange.
- Topics: Categorize data streams logically.
- Partitions: Distribute data for scalability, replicated for fault tolerance.
- Producers: Publish records to topics.
- Consumers: Subscribe to consume records.
- ZooKeeper: Coordinates cluster management tasks.
This setup enables Kafka to handle high-throughput, fault-tolerant data streams efficiently, supporting real-time analytics, event-driven architectures, and messaging systems.
Why should we monitor Kafka?
Organizations struggle to find reliable, scalable solutions capable of efficiently managing large amounts of data. Traditional systems often falter under such demands, leading to bottlenecks, latency issues, and scalability constraints.
Kafka addresses these challenges by providing a distributed streaming platform capable of processing and managing large-scale data streams in real-time.
- Performance optimization: Monitoring Kafka allows for the timely identification of bottlenecks, latency issues, and scalability constraints, enabling organizations to optimize performance and ensure smooth data processing.
- Fault detection: Proactive monitoring helps in the early detection of issues such as broker failures or replication lag, minimizing the risk of data loss and service disruptions.
- Scalability planning: By analyzing Kafka metrics related to resource utilization and throughput, organizations can assess scalability requirements and plan for capacity upgrades as needed.
- Resource efficiency: Monitoring helps in optimizing resource allocation within Kafka clusters, reducing operational costs and improving ROI.
- Security and compliance: Monitoring security-related metrics ensures the integrity and confidentiality of data processed by Kafka, helping organizations meet compliance requirements and prevent security breaches.
- Operational insights: Analyzing historical metrics provides valuable insights into Kafka cluster behavior, enabling informed decision-making and long-term optimization strategies.
Learn more about Kafka Monitoring by clicking here.
Top 4 Kafka metrics to monitor
With Kafka, numerous metrics can impact performance, but focusing on key indicators is essential. Here, we highlight the top Kafka metrics critical for monitoring and optimizing your deployment’s health and efficiency.
1. Kafka broker metrics
Kafka broker metrics refer to performance indicators of individual Kafka brokers within a cluster. These metrics provide insights into the health, resource utilization, and operational efficiency of each broker.
Reasons to monitor
- Monitoring broker metrics helps ensure that Kafka brokers are available and responsive, minimizing downtime and service disruptions.
- By monitoring resource utilization metrics, organizations can optimize resource allocation and prevent overloading or underutilization of Kafka brokers.
- Monitoring Kafka broker metrics allows organizations to identify and address performance bottlenecks, such as high CPU usage or disk latency, ensuring smooth data processing.
Key metrics to monitor
CPU usage
Name: kafka.server:type=KafkaServer,name=BrokerTopicMetrics.BrokerTopicMetrics:AllTopicsBytesInPerSecCPU usage reflects the percentage of CPU resources utilized by a Kafka broker for processing requests and executing tasks. Monitoring CPU usage helps identify processing bottlenecks, enabling optimization of Kafka configurations and resource scaling.
Disk utilization
Name: kafka.server:type=Log,name=SizeWhat it is: Disk utilization indicates the amount of disk space used by Kafka for storing message logs and index files. Monitoring disk utilization prevents disk space exhaustion, ensuring uninterrupted data ingestion and retention.
Network metrics
Name: kafka.network:type=SocketServer,name=NetworkProcessorAvgIdlePercentNetwork metrics include indicators like throughput and traffic, reflecting network performance. Monitoring network metrics detects anomalies, congestion, and ensures smooth communication between Kafka brokers and clients.
Partition metrics
Name: kafka.server:type=ReplicaManager,name=PartitionCountPartition metrics provide insights into the health of Kafka partitions, including ISR and lag. Monitoring partition metrics ensures data replication, distribution, and high availability, minimizing data loss for consumers.
2. Producer metrics
Kafka producer metrics encompass performance indicators that track the behavior and efficiency of Kafka producers. These metrics provide insights into the rate of message production, latency in message delivery, and occurrences of errors during message transmission.
Reasons to monitor
- Monitoring producer metrics allows organizations to assess the efficiency and throughput of message production, ensuring optimal performance of Kafka producers.
- By tracking metrics related to message delivery latency, organizations can identify and address issues that may cause delays in message transmission, ensuring timely data processing.
- Monitoring producer metrics helps in detecting errors encountered during message transmission, enabling prompt resolution and minimizing data loss or disruption in data pipelines.
Key metrics to monitor
Message send rate
Name: kafka.producer:type=producer-metrics,client-id=*ProducerClientId*,topic=*TopicName*,metric-name=record-send-rateMessage send rate reflects the rate at which Kafka producers publish messages to Kafka topics. Monitoring message send rate provides insights into the efficiency of message production, enabling organizations to assess workload distribution and scale resources as needed to meet demand.
Latency
Name: kafka.producer:type=producer-metrics,client-id=*ProducerClientId*,topic=*TopicName*,metric-name=record-send-rateProducer latency measures the time taken for data generated by producers to be successfully transmitted and acknowledged by Kafka topics.
Monitoring producer latency helps in identifying delays in data transmission, ensuring timely processing and reducing latency in downstream data consumption, which is crucial for real-time applications.
3. Consumer metrics
Kafka Consumer metrics encompass performance indicators that track the behavior and efficiency of Kafka consumers. These metrics provide insights into how consumers are ingesting messages from Kafka topics, processing them, and managing partition assignments.
Reasons to monitor
- By tracking metrics related to message consumption latency and consumer lag, organizations can identify and address delays in message processing, ensuring timely data consumption and downstream processing.
- Tracking errors and retries encountered by consumers provides insights into the stability and reliability of consumer applications, enabling prompt detection and resolution of issues to prevent data loss or processing disruptions.
Key metrics to monitor
Consumer lag
Name: kafka.consumer:type=consumer-fetch-manager-metrics,client-id=*ConsumerClientId*,topic=*TopicName*,partition=*PartitionId*,metric-name=records-lag-maxIt measures the difference between the latest message offset in a partition and the consumer’s current offset. Monitoring consumer lag helps identify processing delays, bottlenecks, or issues in consumer performance.
Number of consumed messages
Name: kafka.consumer:type=consumer-fetch-manager-metrics,client-id=*ConsumerClientId*,topic=*TopicName*,partition=*PartitionId*,metric-name=records-consumed-rateTracks the volume of messages consumed by Kafka consumers over a specified period. Monitoring the number of consumed messages provides insights into consumption rates, helping assess consumer workload and ensuring efficient data processing.
4. ZooKeeper metrics
ZooKeeper metrics comprise performance indicators that track the health, activity, and resource utilization of ZooKeeper servers within a Kafka ecosystem. These metrics provide insights into the stability and efficiency of ZooKeeper, a critical component for coordinating and managing Kafka clusters.
Reasons to monitor
- ZooKeeper is responsible for maintaining metadata, coordinating leader election, and managing cluster membership in Kafka. Monitoring ZooKeeper metrics ensures the proper functioning of these critical tasks, facilitating the stability and reliability of Kafka clusters.
- Monitoring ZooKeeper metrics aids in early detection of issues, such as node failures, connectivity problems, or performance degradation, enabling proactive measures to prevent service disruptions and data loss.
- By analyzing ZooKeeper metrics, organizations can identify potential bottlenecks or inefficiencies in ZooKeeper operations and optimize configurations to enhance performance and scalability.
Key metrics to monitor
ZooKeeper quorum size
Name: kafka.server:type=controller-channel-metrics,name=LeaderCountZooKeeper quorum size refers to the number of nodes in a ZooKeeper ensemble required for achieving consensus. Monitoring ZooKeeper quorum size ensures the integrity and reliability of distributed coordination tasks.
ZooKeeper watcher counts
Name: kafka.server:type=socket-server-metrics,name=NetworkProcessorAvgIdlePercentTracks the number of watchers registered with ZooKeeper nodes for monitoring changes to znodes. Monitoring watcher counts helps in assessing the workload and usage patterns of ZooKeeper, facilitating capacity planning and resource allocation for optimal performance.
ZooKeeper pending requests
Name: kafka.server:type=request-channel-metrics,name=RequestQueueSizeMeasures the number of pending client requests awaiting processing by ZooKeeper servers. Monitoring pending requests helps in identifying overload or saturation of ZooKeeper services, enabling organizations to scale resources and optimize configurations for improved performance and responsiveness.
Monitor your Kafka deployment using Middleware
With Middleware’s Kafka Integration, you can actively monitor various aspects of your Kafka environment, including brokers, partitions, consumer groups, and JMX metrics.
- Setup Middleware host agent: Install Middleware Host Agent (MW Agent) v1.5.0+ on your local machine as a prerequisite.
- Access Kafka integration: Log in to your Middleware account and navigate to the Kafka Integration section.
- Connect Kafka: Configure the JMX Server and Broker Host settings to connect Middleware with your Kafka deployment. This allows Middleware to collect relevant metrics from Kafka brokers.
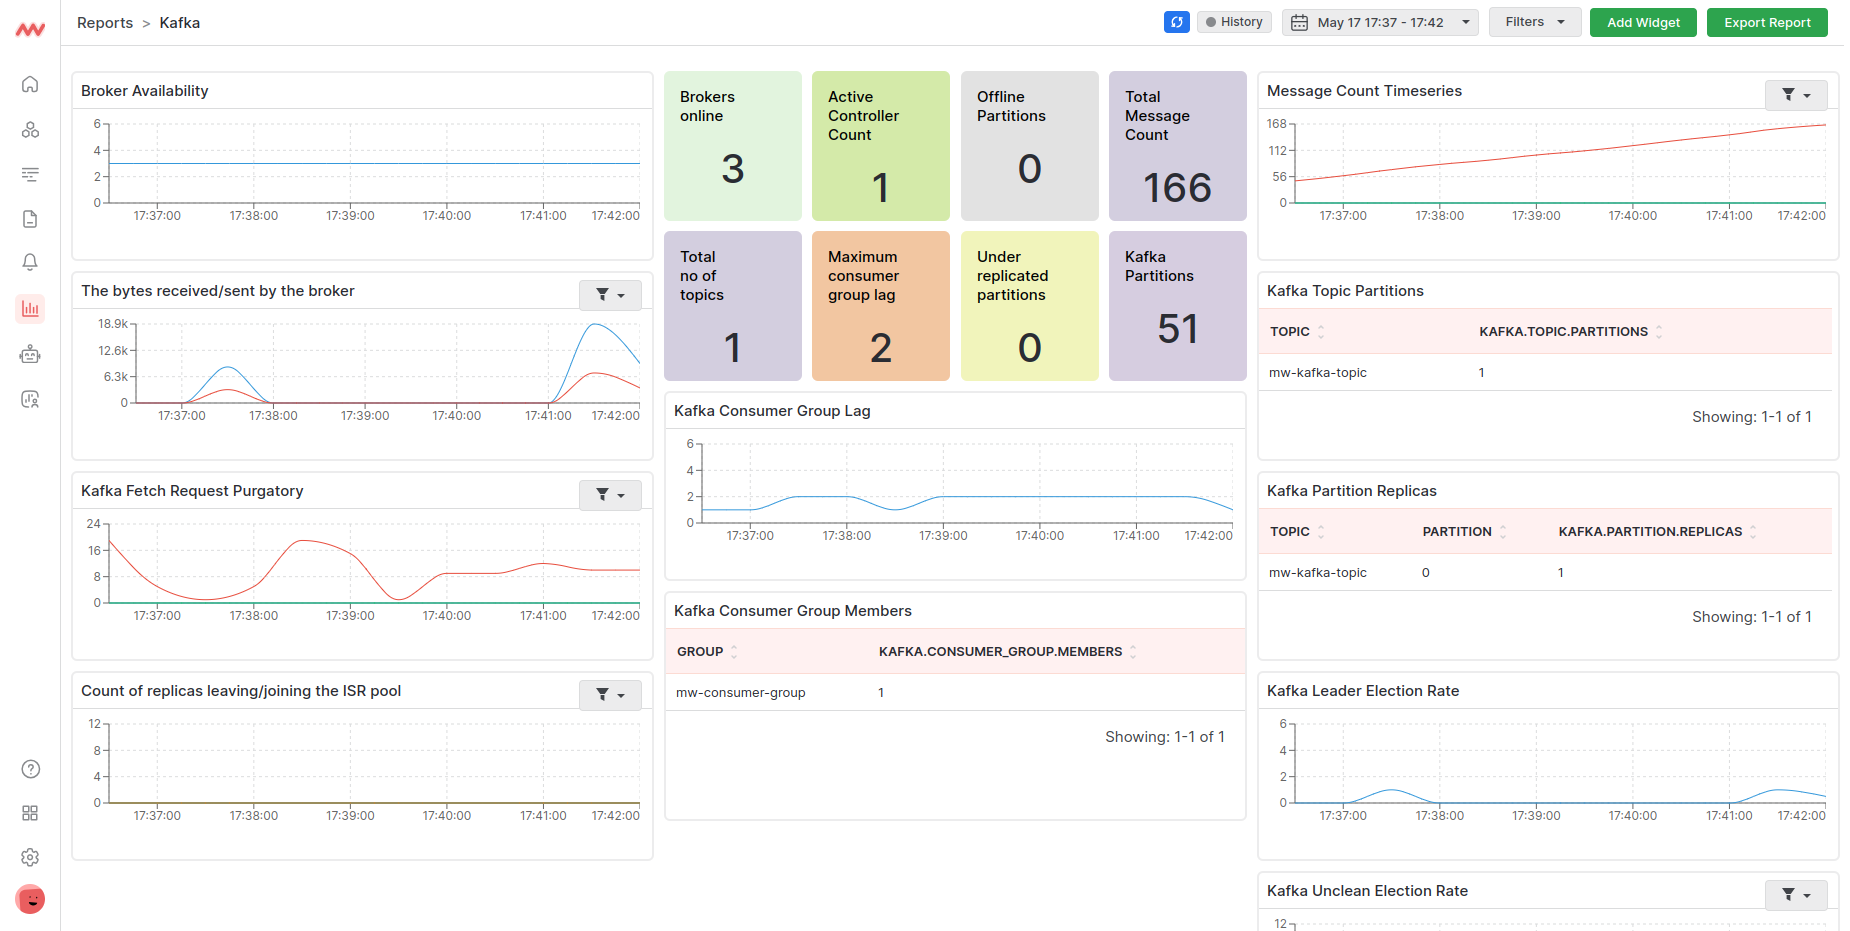
- Visualize data: Explore Middleware’s default Kafka dashboard to gain insights into key metrics such as broker health, partition status, and consumer lag. Customize the dashboard with widgets to focus on specific aspects of your Kafka environment.
- Create alerts: Set up alerts to receive notifications when certain Kafka metrics exceed predefined thresholds. This enables proactive monitoring and timely response to potential issues.
- Dashboard customization: Customize the Kafka dashboard to suit your specific monitoring needs. Add or remove widgets, adjust visualizations, and arrange metrics to optimize your monitoring experience.
- Explore additional metrics: Explore Middleware’s extensive list of Kafka metrics to monitor various aspects of your Kafka deployment comprehensively. Monitor metrics related to producers, consumers, topics, partitions, and more to ensure the smooth operation of your Kafka ecosystem.
- Analyze performance trends: Use Middleware’s analytical tools to analyze performance trends over time. Identify patterns, anomalies, and areas for optimization to continuously improve the performance and reliability of your Kafka deployment.
By following these steps and leveraging Middleware’s Kafka Integration, you can gain valuable insights into your Kafka deployment’s performance, health, and efficiency.
Monitoring our Kafka deployment is key to ensuring its smooth operation and performance. Middleware’s Kafka Integration provides real-time insights into various aspects of our Kafka environment, from brokers to partitions and consumer groups.
The next steps involve implementing Middleware’s Kafka integration, setting up monitoring dashboards, and configuring alerts to keep us informed of any issues. With Middleware’s help, we can proactively manage our Kafka deployment, optimize its performance, and ensure reliable data processing.