Organisations utilizing cloud-native technologies, including Kubernetes and microservices together with serverless computing systems struggle to monitor their complex distributed architectural implementations. These contemporary observation tools were built for static environments yet they provide inadequate support for dynamic architectural systems.
Current monitoring systems depend on broken telemetry data combined with set thresholds and manual comparisons which creates excessive difficulty in problem tracing and spans detection and problem-solving times.
Observability 2.0 addresses these gaps with unified telemetry, AI-driven anomaly detection, and proactive troubleshooting. The correlation of data between metrics and logs and traces allows real-time observability while it helps to identify the root cause of problems quickly and decreases system downtime. This implementation enables better system reliability together with efficient cost optimization and scalable performance.
Understanding observability 2.0
The new and improved Observability 2.0 solution exists specifically to suit modern cloud-native operational needs. This approach extends traditional observability through its ability to offer complete system behavior visibility across distributed networks that include microservices and serverless and containerized setups.
Observable 2.0 combines telemetry data elements, which include metrics logs together with traces and events under one integrated framework. The unified method enables constant system monitoring through deep performance analysis that links system conditions with the data output from the system.
Observability 2.0 provides extended visibility through interconnected data that helps teams track system states and recognize anomalies and verify system-performance alignment with business goals. Modern applications can scale without performance problems due to this infrastructure design which seamlessly supports dynamic systems.
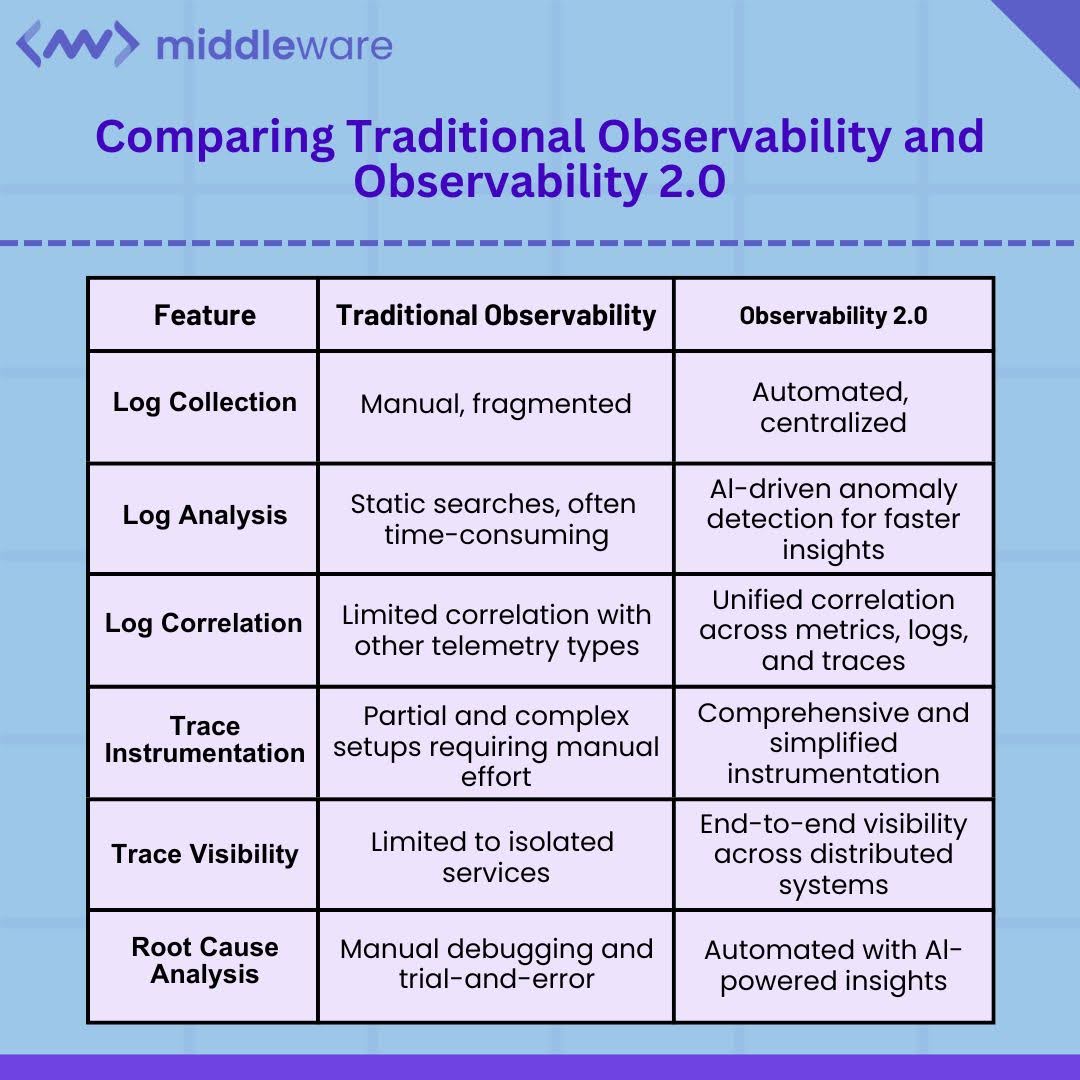
Comparing logs and traces in traditional observability vs. observability 2.0
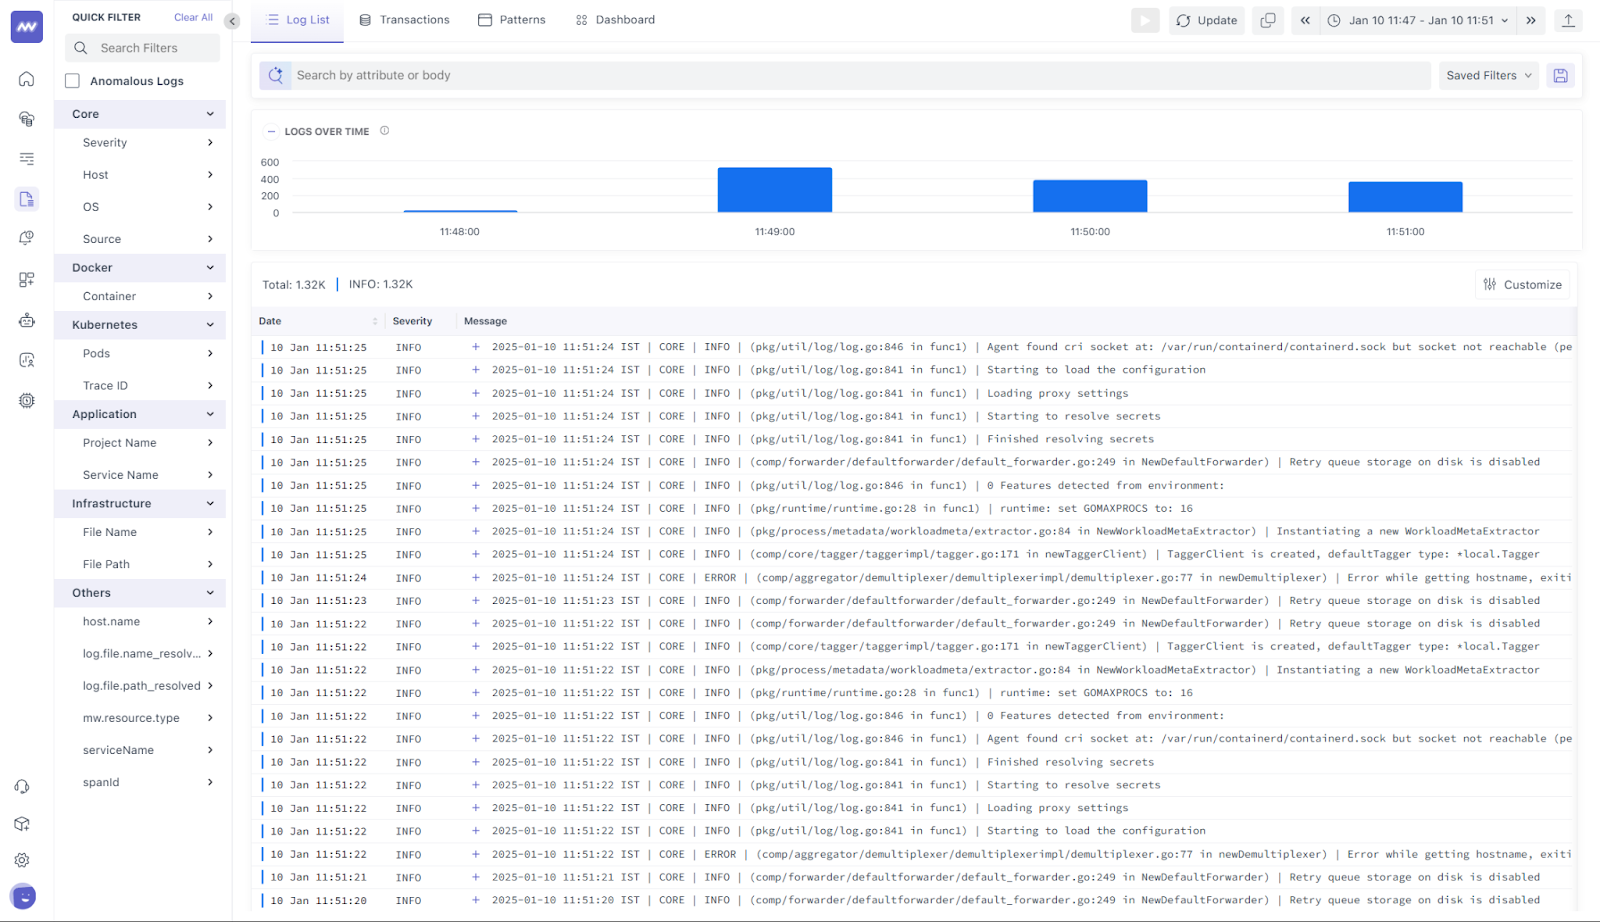
While traditional observability tools utilize logs and traces, their approach is fragmented and lacks real-time correlation. Observability 2.0, on the other hand:
- Centralizes telemetry data for easy access.
- Uses machine learning to detect patterns and anomalies.
- Provides actionable insights by linking telemetry data across services.
By bridging these gaps, Observability 2.0 gives teams more power to manage modern systems more effectively and improve their software development processes.
Diagnosing API latency with Observability 2.0
Imagine a scenario where an API experiences latency spikes during peak hours, affecting application performance. Traditional monitoring tools might flag high response times but fail to identify the underlying cause. With Observability 2.0:
- Metrics reveal a spike in latency.
- Logs indicate slow database queries during those times.
- Traces pinpoint the exact microservice responsible for the delay.
- Events highlight a recent deployment that impacted performance.
This holistic view enables teams to address issues quickly, minimizing user impact.
Top 5 Key Features of Observability 2.0 and the challenges they solve
Observability 2.0 offers a modern approach to system monitoring, addressing the limitations of traditional tools. Here’s how its core features solve the key challenges faced by modern software systems:
1. Unified telemetry streams
Challenge Solved: Managing Complex Distributed Systems
The deployment of Kubernetes along with microservices combined with serverless computing infrastructures creates complex relationships between system components. When one service fails, it creates multiple successive problems between components that obstruct the identification of the original defect.
How it Helps: Observability 2.0 merges metrics with logs as well as traces and events onto one integrated platform to eliminate data silos. Observability 2.0 presents a unified picture that enables teams to effortlessly track connections between data points and pinpoint service-related problems without manual correlational efforts.
2. AI-powered anomaly detection
Challenge Solved: Reducing Mean Time to Detect (MTTD)
The static threshold approach in conventional methods allows important problems to remain undetected until they develop into severe issues. The increased wait time diminishes both incident detection speed and response time.
How It Helps: The modern Observability 2.0 technology applies machine learning to monitor system behavior patterns and set-shifting baselines to detect anomalies as they happen. The proactive detection measures enabled by this method significantly decrease MTTD which allows teams to find operational issues before they impact end-users.
“AI-driven anomaly detection capabilities enable the identification of unknown unknowns, detecting unusual patterns of behavior not seen before, and allowing for timely investigation and remediation.”
Sam Suthar, Founding Director, Middleware
3. Telemetry data contextualization
Challenge Solved: Raw telemetry data without context can overwhelm teams, making it hard to determine which issues truly matter from a business perspective.
How It Helps: Observability 2.0 links technical data to business metrics like revenue impact and user satisfaction. This context enables teams to prioritize and resolve issues that have the most significant business consequences, avoiding unnecessary firefighting over low-priority technical anomalies.
4. Proactive root cause analysis
Challenge Solved: Minimizing Mean Time to Resolve (MTTR)
Finding the root cause in conventional systems resembles a haystack search, which extends system downtime to unnecessary periods.
How It Helps: Observability 2.0 uses automated methods to combine telemetry data while identifying service relationships and historical design patterns to determine problem sources. This speeds up MTTR to such a degree it enables incident resolution while maximizing uptime service.
For more on reducing MTTR, check out this guide.
5. Scalability and flexibility
Challenge Solved: Handling Dynamic Environments and Incident Management
Modern, distributed systems often experience unpredictable load spikes and evolving infrastructure, making it hard for traditional tools to keep pace.
How it Helps: Designed for dynamic environments like multi-cloud and Kubernetes, Observability 2.0 scales effortlessly with your infrastructure. It supports proactive monitoring, automatically adjusting to traffic spikes or changes in system architecture while maintaining performance visibility.
Observability 2.0 in action: Tools and frameworks
To implement Observability 2.0 effectively, organizations can use a range of tools designed to integrate with modern architectures and deliver actionable insights. These tools provide the foundation for unifying telemetry, automating incident management, and ensuring scalability.
Top observability 2.0 tools
- Middleware
- A cloud-agnostic observability platform offering AI-driven insights, unified telemetry, and proactive troubleshooting for modern distributed systems.
- Scaling Benefits: Middleware handles high volumes of telemetry data across microservices without performance degradation. Its AI-driven automation helps manage data overload, ensuring real-time monitoring even during traffic spikes.
- OpenTelemetry
- An open-source observability framework for collecting metrics, logs, and traces across diverse applications.
- Scaling Benefits: With sampling and filtering capabilities, OpenTelemetry reduces data overload by collecting representative data efficiently, optimizing storage, and ensuring smooth operations in large-scale systems.
- Prometheus and Grafana
- A powerful combination of metrics collection and dynamic visualization for distributed systems. Prometheus collects, stores, and aggregates metrics data, while Grafana transforms this data into interactive dashboards.
- Scaling Benefits: Their combination allows users to view aggregated metrics and dynamically adapted visualizations which creates efficient summarization of data and real-time dashboard adjustment for large-scale telemetry information. The system health monitoring solution enables teams to detect system anomalies as well as identify trends which helps teams respond to issues promptly.
- Jaeger
- A distributed tracing tool that provides visibility into service dependencies and performance bottlenecks.
- Scaling Benefits: Jaeger excels at correlating trace data across microservices, helping pinpoint performance issues in large, distributed systems without adding monitoring overhead.
- Datadog and Dynatrace
- A robust duo for full-stack observability, integrating metrics, logs, and traces with advanced analytics and AI-driven performance monitoring. Datadog excels at real-time infrastructure monitoring, while Dynatrace enhances automation and anomaly detection with AI capabilities. Explore the pricing of Datadog.
- Scaling Benefits: Together, they offer auto-scaling observability and AI-powered anomaly detection, ensuring proactive issue identification and maintaining performance visibility as systems evolve and grow.
- New Relic
- A cloud-based observability tool that aligns technical performance with business outcomes through AI-driven insights.
- Scaling Benefits: New Relic supports multi-cloud scalability, providing unified visibility across diverse infrastructures while optimizing data collection for efficiency.
By implementing Observability best practices, organizations can scale observability to handle high data volumes and maintain performance in distributed environments.
Measuring success with observability 2.0
Key Performance Indicators (KPIs)
Observability 2.0 goes beyond technical metrics, linking system health to business outcomes by understanding how to collect data from different endpoints and services. Here are the KPIs organizations should track:
- Application health:
- Uptime: Ensure systems are operational nearly 100% of the time, especially for mission-critical applications.
- Error rates: Monitor error rates across application and infrastructure levels to address systemic issues early, such as repeated HTTP 500 errors.
- Business metrics:
- Revenue impact: Identify technical issues affecting revenue, such as dropped transactions during critical events.
- User engagement: Correlate performance with customer behavior, such as session duration and tournament participation rates.
- User experience:
- Latency: Measure API and page load times, as even small delays can frustrate users.
- Response times: Focus on quick responses to critical user actions, ensuring smooth interaction and customer satisfaction.
Conclusion
Current systems require monitoring solutions that surpass traditional capabilities. Observability 2.0 solves the infrastructure complexity problem by combining telemetry and automated AI processing with improved observability capabilities. Organizations that implement Observability 2.0 reduce system interruptions and provide better user outcomes while connecting technical performance measures to business goals.
Observability 2.0 platforms will bring artificial intelligence and automation capabilities into closer integration during future development. System predictions will uncover problems before their onset followed by automatic repair functions that speed up incident resolution. Organizations that implement Observability 2.0 are now creating foundations for future systems that will automatically adjust and maintain high reliability.
What are the benefits of Observability 2.0
Observability 2.0 enhances observability by providing unified telemetry for metrics, logs, and traces, enabling real-time visibility into containerized workloads. It uses AI-driven anomaly detection to proactively identify performance issues, supports dynamic scaling, and simplifies root cause analysis across microservices, helping DevOps teams reduce Mean Time to Resolution (MTTR) and improve system reliability in complex Kubernetes clusters.
How does Observability 2.0 improve incident response times?
The improved incident response through Observability 2.0 achieves automation in distributed system data correlation. The system employs artificial intelligence and machine learning to identify current anomalies which enables automatic troubleshooting without requiring human intervention. The proactive root cause analysis and dynamic dashboard features help teams detect incidents easily which enables them to isolate and fix them quickly to reduce downtime and enhance system performance.
How is observability 2.0 different from traditional observability?
Observability 2.0 enhances traditional observability by integrating unified telemetry, AI-driven insights, and automation. Unlike traditional tools, which rely on fragmented data and manual analysis, Observability 2.0 provides real time analytics, anomaly detection, and contextualized insights for faster resolution and better scalability.
Can Observability 2.0 reduce operational costs for cloud-native applications?
Operational costs decrease due to Observability 2.0 which manages resources more efficiently and cuts down system unavailability. The consolidated telemetry solution of Observability 2.0 replaces redundant monitoring tools while its AI analytics system detects problems earlier to lower maintenance costs tied to incidents. Application growth benefits from the observability solution because it supports both microservices and serverless environments alongside scalable architecture.
What are the main components of observability 2.0?
The key components of observability 2.0 include:
- AI and Automation: For anomaly detection, proactive remediation, and contextual analysis.
- Metrics: Quantifiable data about system performance (e.g., CPU usage).
- Logs: Detailed records of system events and errors.
- Traces: End-to-end tracking of requests across distributed services.
How does observability 2.0 improve system reliability and performance?
Observability 2.0 enhances reliability and performance by:
- Providing unified telemetry for a complete view of system health.
- Detecting anomalies early through AI-driven insights.
- Automating root cause analysis for faster issue resolution.
- Scaling easily with modern architectures like microservices and Kubernetes


