
What is Python application monitoring?
Python application monitoring is the process of proactively observing and collecting data about your application’s health and performance to ensure it runs smoothly and efficiently. It’s like having a real-time dashboard into your app’s inner workings, letting you know if anything needs attention.
This involves tracking and analyzing various aspects, such as performance metrics (response times, resource usage (CPU, memory), throughput, and transaction), errors, individual functions, database queries, and API calls).
If done right, Python application monitoring can help developers proactively fix issues, improve code quality, and optimize application performance and health.
Why is Python application monitoring important?
Python is a powerful and versatile programming language used in a wide range of applications, from web development to data analysis and machine learning. As Python applications become increasingly complex, Python performance monitoring becomes crucial to ensure they are running optimally.
Python application monitoring helps identify bottlenecks, diagnose issues, and optimize the performance of your applications.
Why should you monitor Python applications?
Monitoring the performance of your Python applications offers several significant benefits. Let’s explore some key benefits:
Proactive issue detection
Python performance monitoring allows you to detect performance issues, such as slow response times or high error rates before they impact users. By identifying and addressing these issues early on, you can prevent potential downtime or degradation of your application’s performance.
Performance optimization
Monitoring provides insights into the performance of your Python applications, enabling you to optimize resource usage and improve overall efficiency. By identifying areas of high CPU or memory usage, you can fine-tune your code, enhance algorithms, and eliminate inefficiencies.
Enhanced user experience
Users have high expectations when it comes to application performance. Python application performance monitoring helps ensure that your Python applications deliver a seamless user experience by minimizing response times and eliminating potential bottlenecks that can frustrate users.
Scalability and capacity planning
Monitoring helps you understand the resource requirements of your Python applications. By monitoring metrics like CPU usage, memory consumption, and request throughput, you can make informed decisions about scaling your infrastructure and planning for future capacity needs.
Troubleshooting and debugging
Python performance monitoring provides valuable insights into application behavior and performance patterns. Monitoring data can help pinpoint the root causes when issues arise, making troubleshooting and debugging more efficient and effective.
What should you monitor in Python applications?
To effectively monitor the performance of your Python applications, it’s essential to focus on key metrics that provide insights into their behavior and resource utilization. By monitoring these Python application performance monitoring metrics, you can identify bottlenecks, detect anomalies, and optimize performance.
Here are the critical metrics you should monitor:
Response time
Response time refers to the duration a Python application takes to respond to a user request. It measures the time from when a request is initiated until the corresponding response is received. Monitoring response time is crucial as it provides valuable insights into your application’s performance and user experience.
Monitoring response time allows you to assess the efficiency and responsiveness of your Python application. By tracking response time, you can identify performance bottlenecks, slow database queries, network latency issues, or inefficient code that might be causing delays.
- Response time monitoring helps identify performance bottlenecks and delays in your Python application.
- It ensures a seamless user experience by optimizing response times.
- Monitoring response time allows you to address issues that may negatively impact user satisfaction proactively.
CPU usage
CPU usage monitoring involves tracking the utilization of the Central Processing Unit (CPU) by your Python application. It measures the percentage of time the CPU spends executing instructions for your application. Monitoring CPU usage is essential to understand the workload and resource utilization of your application’s computational tasks.
Monitoring CPU usage provides valuable insights into the performance and efficiency of your Python application. By tracking CPU usage, you can identify if your application is utilizing the CPU resources optimally or if it is experiencing high CPU usage, which can lead to performance degradation, slower response times, and potential scalability issues.
- CPU usage monitoring helps identify resource-intensive processes or code segments in your Python application.
- It enables performance optimization by optimizing CPU-intensive tasks and identifying inefficient algorithms.
- Monitoring CPU usage aids in scalability planning and determining the need for additional CPU resources.
Memory usage
Memory usage monitoring involves tracking the amount of memory consumed by your Python application. It measures the memory resources allocated and utilized by your application during its execution.
Monitoring memory usage is crucial for understanding the memory footprint of your application and ensuring efficient memory management.
Monitoring memory usage is important to ensure the optimal performance and stability of your Python application. By tracking memory usage, you can identify memory leaks, excessive memory consumption, or inefficient memory utilization that can lead to crashes, slowdowns, or out-of-memory errors.
It helps you proactively manage memory resources and ensure efficient memory usage.
- Monitoring memory usage helps optimize performance by identifying memory-intensive operations.
- It ensures stability and reliability by detecting and resolving memory-related issues.
- Efficient resource allocation is achieved by monitoring memory usage and optimizing memory allocation.
Request Throughput
Request throughput monitoring involves measuring the number of requests your Python application processes within a given time frame. It helps you understand the capacity and efficiency of your application in handling incoming requests. Monitoring request throughput is essential to ensure optimal performance, scalability, and responsiveness.
Monitoring request throughput provides valuable insights into the workload and performance of your Python application. By tracking the number of requests processed per unit of time, you can identify if your application is capable of handling the incoming traffic effectively or if it is reaching its capacity limits.
- Monitoring request throughput aids in scalability planning and determining resource needs.
- It helps optimize performance by identifying and addressing bottlenecks in request processing.
Error rate
Error rate monitoring involves tracking the frequency and types of errors occurring in your Python application. It helps you understand your application’s stability and reliability by measuring errors during its execution. Monitoring error rates is crucial for identifying and resolving issues that may affect the user experience and overall performance.
Monitoring error rates allows you to detect and address errors in your Python application proactively. By tracking the frequency and types of errors, you can identify patterns, pinpoint potential code defects or system issues, and take corrective actions to improve application stability and reliability. It helps you ensure a smooth and error-free user experience.
- It enhances the user experience by reducing the occurrence of errors.
- Error rate monitoring aids in performance optimization and identifying bottlenecks.
- It ensures compliance and security by identifying and resolving security-related errors.
How to monitor Python applications?
Let’s dive into the various methods and approaches available to monitor your Python applications effectively:
Using the default ‘logging’ module
The ‘logging’ module is a built-in Python module that provides a powerful mechanism for generating log messages from your application. It allows you to capture important events, errors, warnings, and informational messages during the execution of your code.
The ‘logging’ module offers various log levels, including DEBUG, INFO, WARNING, ERROR, and CRITICAL, allowing you to prioritize and filter log messages based on their severity.
To monitor your Python application using the default ‘logging’ module, follow these steps:
- Import the ‘logging’ module.
- Configure logging settings, such as the log level, format, and output destination.
- Place log statements in your code to capture relevant information.
- Include contextual details in log messages, such as timestamps or error details.
- Handle exceptions and log any occurring exceptions.
- Regularly analyze and review the generated logs to gain insights and identify potential issues.
Want a deep dive into this topic? Here’s a detailed guide about Python logging best practices.
Performance profiling
Performance profiling is a technique used to analyze the execution of a Python application and identify areas that can be optimized for better performance. It involves measuring the execution time of different functions, methods, or code blocks to identify performance bottlenecks and areas of improvement.
By profiling your code, you can gain insights into the time and resources consumed by different parts of your application, allowing you to focus your optimization efforts effectively.
- Choose a profiling tool that suits your needs.
- Instrument your code by adding profiling commands or decorators.
- Run the profiler during the execution of your application.
- Analyze the profiling results, including execution time and resource usage data.
- Identify performance bottlenecks based on the profiling data.
- Optimize the identified bottlenecks and measure the impact of the changes.
Using APM tools
APM tools are specialized software solutions designed to monitor the performance and behavior of applications in real time. They offer comprehensive insights into various aspects of application performance, including response times, resource utilization, error rates, and transaction tracing.
APM tools provide valuable visibility into the inner workings of your Python application, helping you identify bottlenecks, troubleshoot issues, and optimize performance.
- Choose and install an APM tool that suits your needs, like Middleware or other alternatives.
- Configure the APM agent within your Python application’s environment.
- Define the monitoring parameters and metrics you want to track.
- Launch your application with the APM agent to start monitoring.
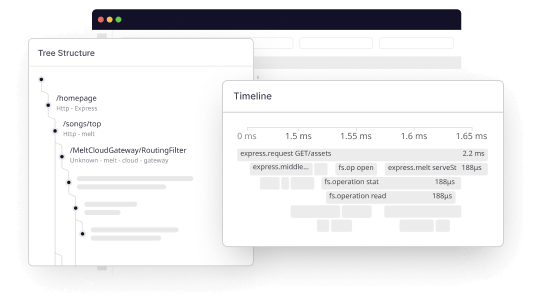
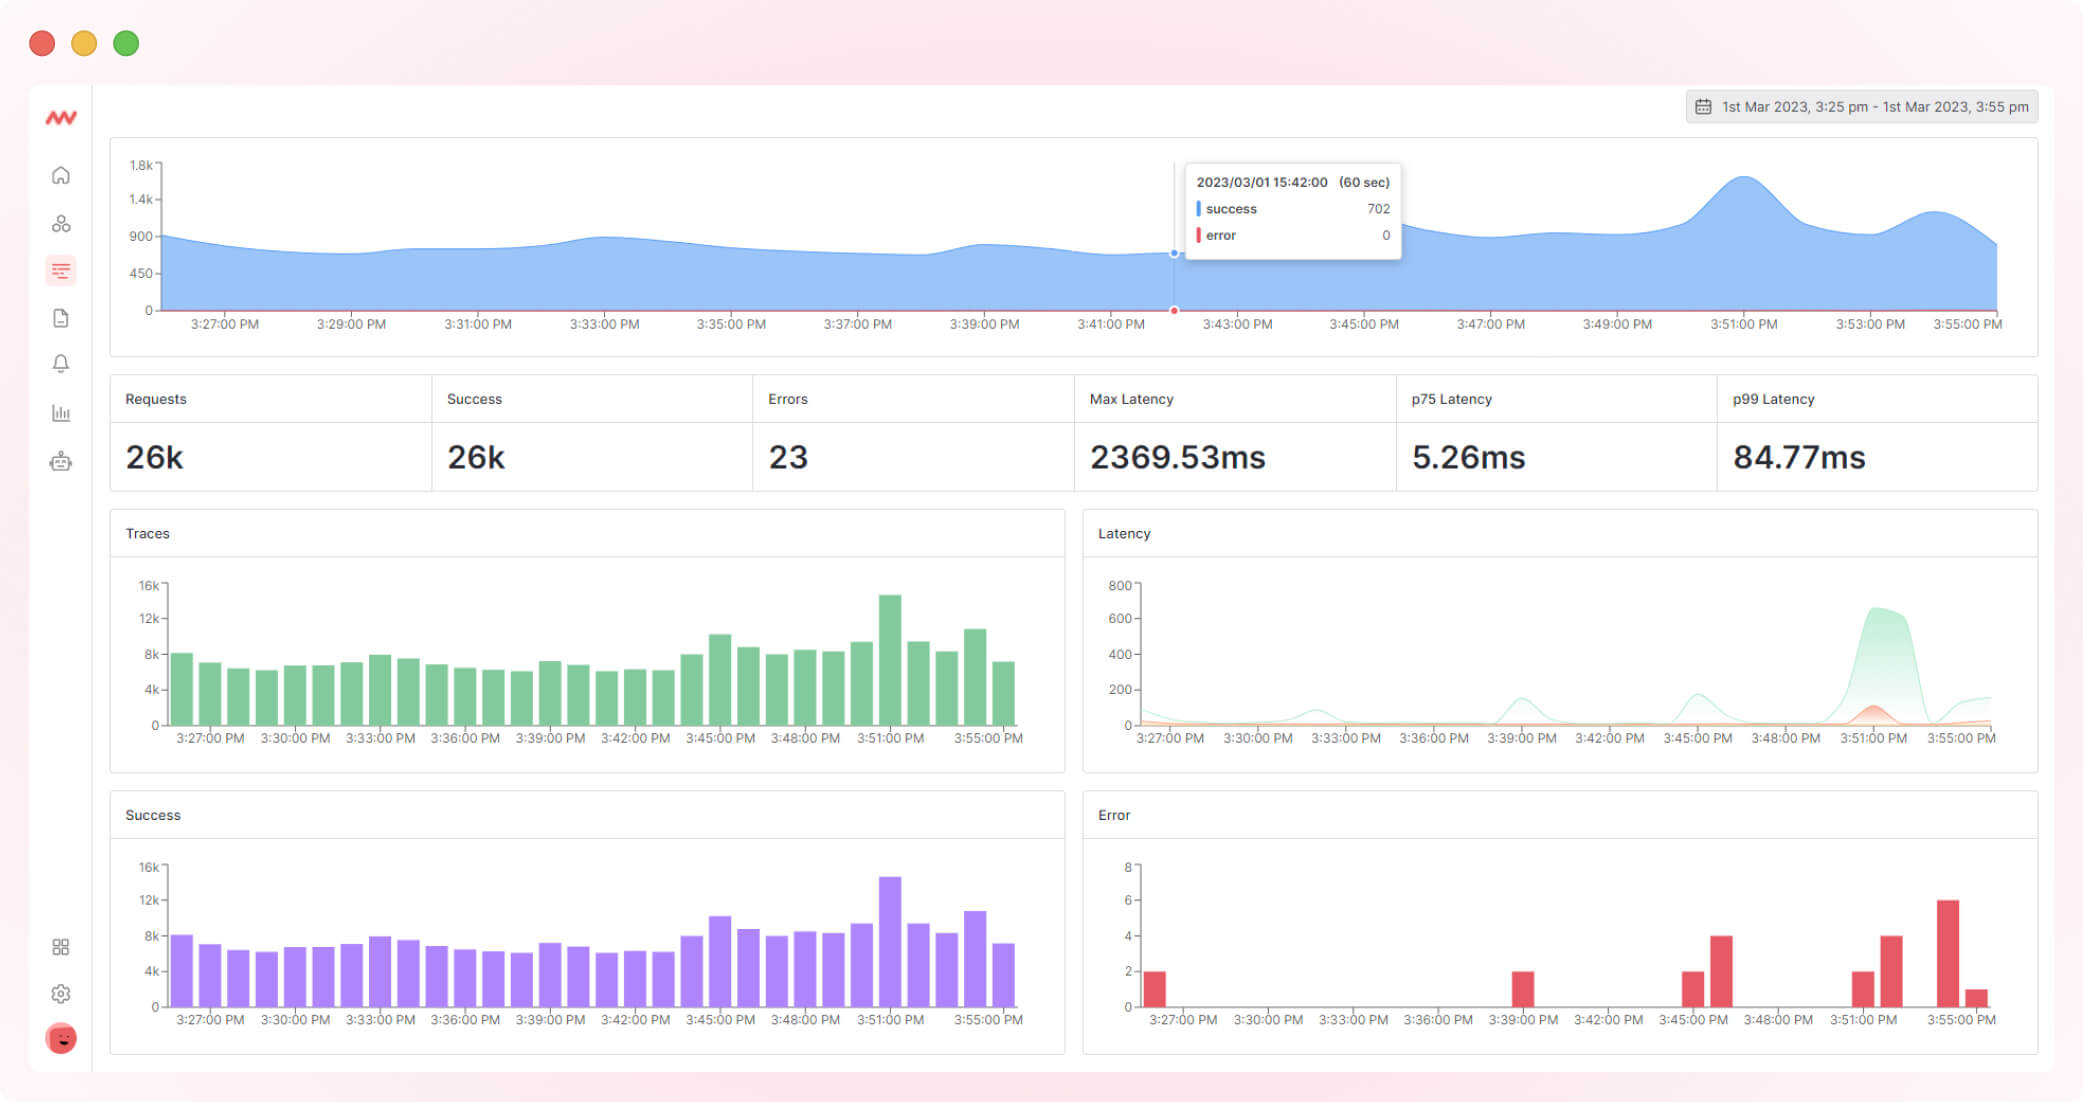
For demonstration purposes, we are using Middleware as an APM tool. The Middleware’s APM dashboard is a powerful tool that provides real-time insights into the performance of your applications. It helps you identify and resolve issues before they impact the end users.
To install Middleware and start monitoring, follow these steps:
Step 1: Install the Python package
pip install middleware-apm
Step 2: Import Tracker
from apmpythonpackage import apmpythonclasstracker =apmpythonclass()tracker.mw_tracer({APM-PROJECT-NAME}, {APM-SERVICE-NAME}
For more information about how Middleware’s APM works, please refer to our docs.
Once the agent is installed, you will start seeing data in your dashboard. Middleware’s APM dashboard provides real-time insights into the application’s usage patterns, response times, and success and error rates, enabling you to identify and resolve issues quickly and efficiently:
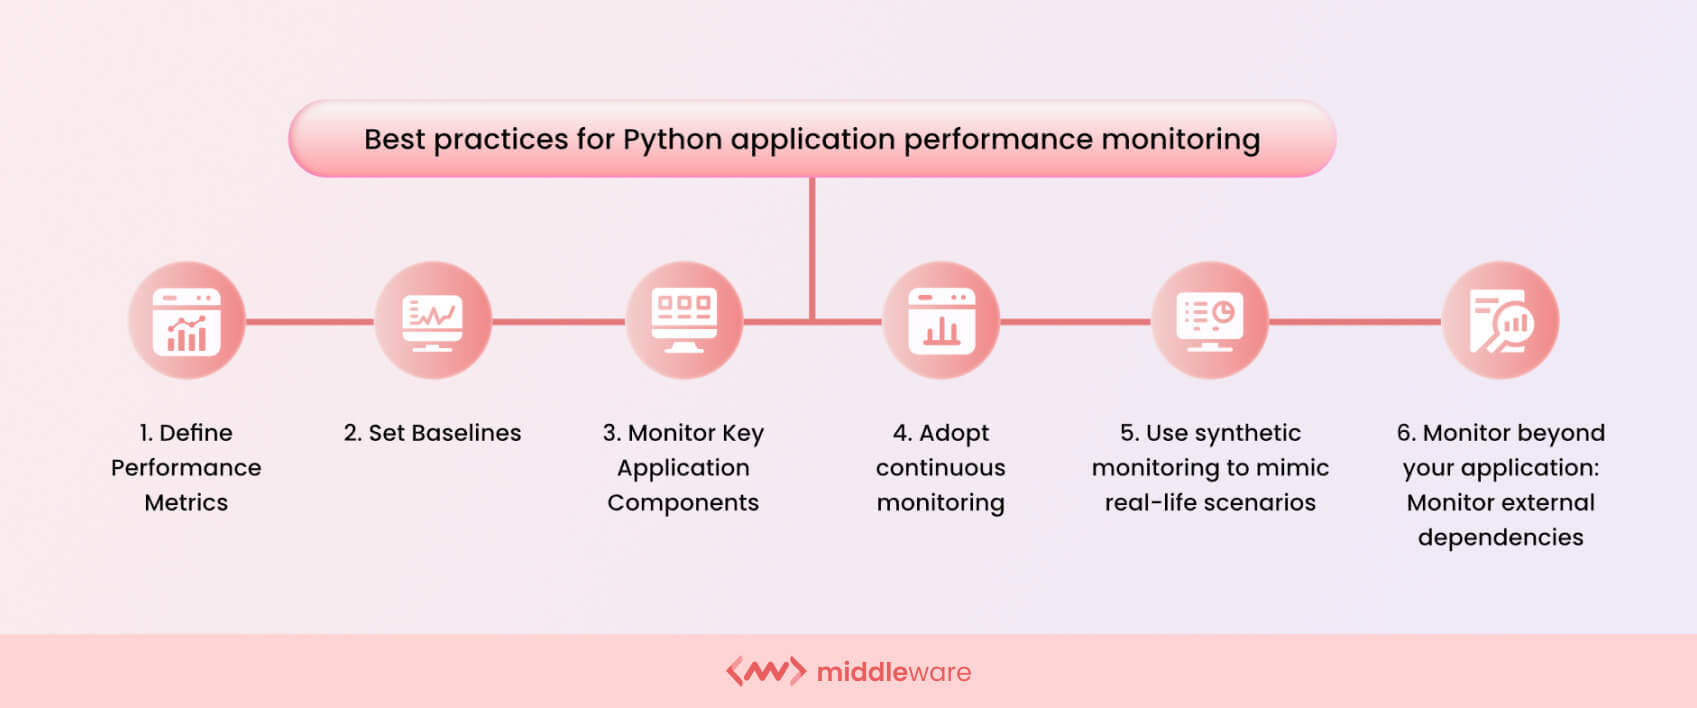
Top 6 Python application performance monitoring best practices
To ensure effective Python application performance monitoring, it is essential to follow best practices.
Let’s discuss a few best practices:
Define performance metrics
Defining performance metrics is a crucial aspect of Python application performance monitoring. It involves identifying and establishing key performance indicators (KPIs) that reflect your application’s desired behavior and performance. Performance metrics can include response time, CPU and memory utilization, throughput, error rates, and more.
By defining clear performance metrics, you can effectively measure and track the performance of your Python application, identify deviations from expected behavior, and take appropriate actions for optimization and improvement.
Set baselines
Setting baselines is an important practice in Python application performance monitoring. It involves establishing a reference point or benchmark for your application’s normal or expected performance under typical conditions.
By capturing and analyzing performance data during periods of normal operation, you can determine the baseline performance metrics for response time, CPU and memory usage, throughput, and other relevant indicators.
These baselines serve as a point of comparison to identify performance anomalies, deviations, or trends that may indicate potential issues or optimizations.
By setting baselines, you can effectively monitor the performance of your Python application over time, detect abnormalities, and take proactive measures to maintain optimal performance levels.
Monitor key application components
Monitoring key application components is a critical practice in Python application performance monitoring. It involves identifying and monitoring the critical components, modules, or services that directly impact the performance and functionality of your application.
Key application components can include database queries, external API calls, file I/O operations, third-party integrations, or any other component that plays a significant role in the application’s execution.
By monitoring these components, you can gain insights into their performance, identify bottlenecks or performance issues, and optimize them for better overall application performance.
Adopt continuous monitoring
Adopting continuous monitoring is a crucial best practice in Python application performance monitoring. Instead of sporadic or infrequent monitoring, continuous monitoring involves the ongoing and real-time observation of your application’s performance metrics.
By continuously monitoring your Python application, you can quickly detect and respond to performance issues, errors, or anomalies as they occur. This proactive approach allows you to identify and resolve problems before they escalate, ensuring optimal performance and user experience.
Continuous monitoring can be achieved through automated monitoring tools and techniques that provide real-time visibility into your application’s performance.
By regularly monitoring key metrics, analyzing trends, and receiving alerts or notifications, you can stay informed about the health and performance of your Python application, enabling you to take immediate action when necessary.
Use synthetic monitoring to mimic real-life scenarios
Utilizing synthetic monitoring is a valuable practice in Python application performance monitoring. Synthetic monitoring involves creating simulated or artificial transactions that mimic real-life user interactions with your application.
By setting up synthetic monitoring scenarios, you can proactively test and monitor the performance of your application under various conditions.
This can include simulating user actions such as logging in, browsing different pages, submitting forms, and executing specific tasks.
Synthetic monitoring allows you to measure response times, validate functionality, and identify any performance bottlenecks or issues.
Monitor beyond your application: Monitor external dependencies
Monitoring external dependencies is an essential best practice in Python application performance monitoring. External dependencies refer to any third-party services, APIs, databases, or other components your application relies on for its functionality.
You can ensure these external dependencies’ availability, responsiveness, and performance by monitoring them. This includes tracking these dependencies’ response times, error rates, and resource utilization.
Monitoring external dependencies helps you identify any performance issues or outages that may impact your Python application’s overall performance and user experience.
Top 3 Python application performance monitoring (APM) tools in 2025
There are several excellent tools and vendors available in the market. This section will discuss three top APM tools and vendors known for their robust features, reliability, and industry reputation.
Middleware
Middleware is a monitoring platform that specializes in complex, multi-tiered applications. It tracks the performance of web pages and APIs at various network levels, and you can easily deploy and scale with any environment like Docker, Kubernetes, and more.
- Visualize application performance and uptime data alongside key business metrics to find issues faster.
- Use a detailed time graph to find which step or endpoint has performance issues.
- View a breakdown of network timing data and response time by location for faster root cause analysis.
Datadog
Datadog offers Synthetic Monitoring, which enables users to create code-free tests that simulate user transactions on applications and monitor key network endpoints across different layers of systems.
- Stay ahead of issues by proactively monitoring your endpoints through API tests.
- Easily capture critical transactions without writing any code using our fully hosted web recorder.
- Ensure secure monitoring of any environment by using your own private locations.
New Relic
New Relic is a cloud-based observability platform that offers real-time monitoring of software applications, infrastructure, and customer experiences.
- Detects low-performing entities such as URLs, APIs, and services proactively.
- Collaborate to resolve issues automatically generated from affected tests.
- Leverage alerts and AI to seamlessly transition from synthetic checks to automatically generated tickets within AIOps.
Conclusion
Python application performance monitoring is crucial for optimizing the performance, reliability, and user experience of your applications.
By monitoring key metrics such as response time, CPU usage, memory usage, request throughput, and error rates, you can identify performance bottlenecks, troubleshoot issues, and optimize your code.
Application Performance Monitoring (APM) is critical for ensuring optimal software performance, availability, and user experience.
By utilizing APM tools and techniques, organizations can monitor and track various performance metrics, diagnose issues, optimize performance, and enhance collaboration across teams.